By InvestMacro
Here are the latest charts and statistics for the Commitment of Traders (COT) data published by the Commodities Futures Trading Commission (CFTC).
The latest COT data is updated through Tuesday April 22nd and shows a quick view of how large market participants (for-profit speculators and commercial traders) were positioned in the futures markets. All currency positions are in direct relation to the US dollar where, for example, a bet for the euro is a bet that the euro will rise versus the dollar while a bet against the euro will be a bet that the euro will decline versus the dollar.
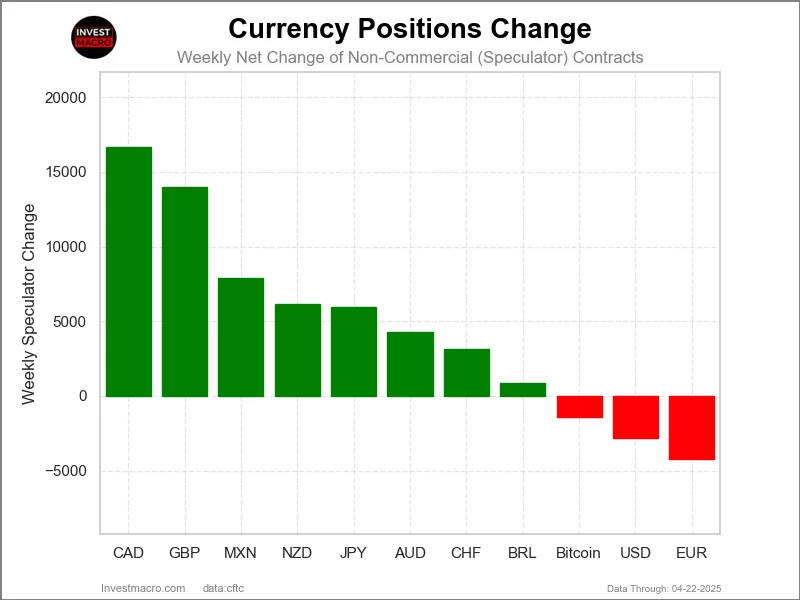
The COT currency market speculator bets were higher this week as eight out of the eleven currency markets we cover had higher positioning while the other three markets had lower speculator contracts.
Free Reports:
Leading the gains for the currency markets was the Canadian Dollar (16,693 contracts) with the British Pound (13,981 contracts), the Mexican Peso (7,896 contracts), the New Zealand Dollar (6,183 contracts), the Japanese Yen (5,959 contracts), the Australian Dollar (4,266 contracts), the Swiss Franc (3,110 contracts) and the Brazilian Real (855 contracts) also showing positive weeks.
The currencies seeing declines in speculator bets on the week were the EuroFX (-4,252 contracts), the US Dollar Index (-2,802 contracts) and with Bitcoin (-1,392 contracts) also registering lower bets on the week.
Highlighting the COT currency’s data this week is the continued decrease in sentiment for the US Dollar Index. Speculative positions for the USD Index declined this week by -2,802 contracts and have fallen in five out of the last six weeks. This amounts to a total decline of approximately -10,000 net contracts over the past six weeks.
The deterioration in sentiment has brought the Dollar Index into its first bearish position (currently at -974 net contracts) since December, a span of 19 weeks dating back to December 10th 2024.
Legend: Open Interest | Speculators Current Net Position | Weekly Specs Change | Specs Strength Score compared to last 3-Years (0-100 range)
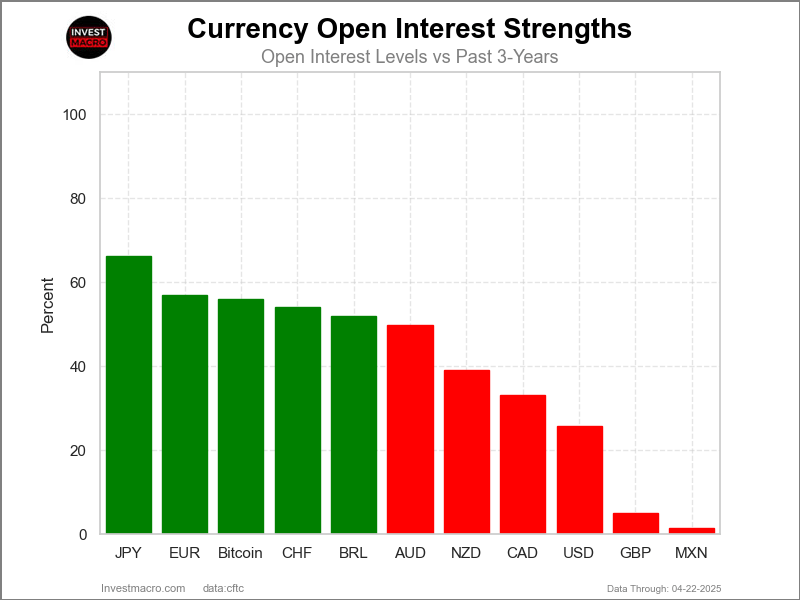
COT Strength Scores (a normalized measure of Speculator positions over a 3-Year range, from 0 to 100 where above 80 is Extreme-Bullish and below 20 is Extreme-Bearish) showed that the Japanese Yen (100 percent) and the Brazilian Real (100 percent) are at extreme high levels and lead the currency markets this week. The Canadian Dollar (58 percent) and the EuroFX (54 percent) come in as the next highest in the weekly strength scores.
On the downside, the US Dollar Index (5 percent) comes in at the lowest strength levels currently and is in Extreme-Bearish territory (below 20 percent). The next lowest strength scores are the New Zealand Dollar (33 percent), Bitcoin (34 percent) and the Australian Dollar (38 percent).
3-Year Strength Statistics:
US Dollar Index (4.7 percent) vs US Dollar Index previous week (10.5 percent)
EuroFX (53.5 percent) vs EuroFX previous week (55.1 percent)
British Pound Sterling (45.3 percent) vs British Pound Sterling previous week (39.0 percent)
Japanese Yen (100.0 percent) vs Japanese Yen previous week (98.4 percent)
Swiss Franc (49.3 percent) vs Swiss Franc previous week (43.0 percent)
Canadian Dollar (57.9 percent) vs Canadian Dollar previous week (50.4 percent)
Australian Dollar (37.6 percent) vs Australian Dollar previous week (34.5 percent)
New Zealand Dollar (33.4 percent) vs New Zealand Dollar previous week (26.2 percent)
Mexican Peso (49.7 percent) vs Mexican Peso previous week (45.7 percent)
Brazilian Real (99.7 percent) vs Brazilian Real previous week (98.8 percent)
Bitcoin (33.7 percent) vs Bitcoin previous week (64.1 percent)
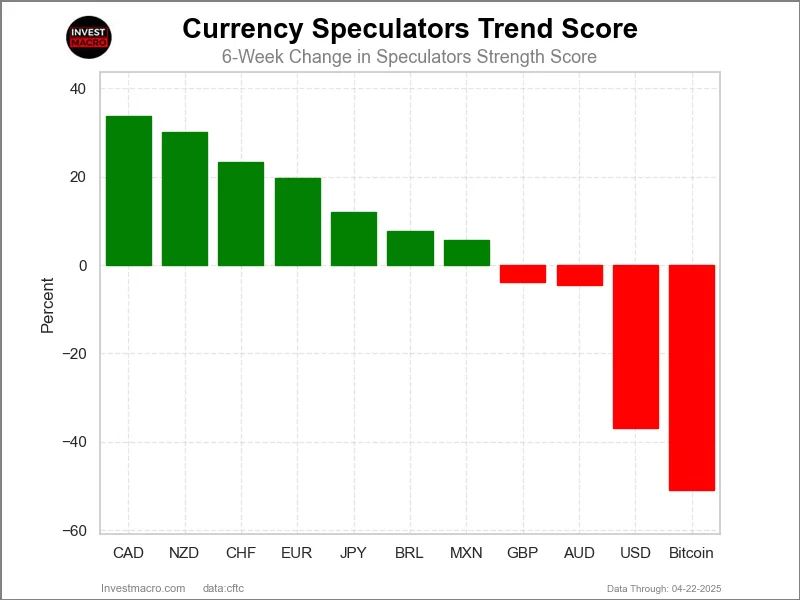
COT Strength Score Trends (or move index, calculates the 6-week changes in strength scores) showed that the Canadian Dollar (34 percent) and the New Zealand Dollar (30 percent) lead the past six weeks trends for the currencies. The Swiss Franc (23 percent), the EuroFX (20 percent) and the Japanese Yen (12 percent) are the next highest positive movers in the 3-Year trends data.
Bitcoin (-51 percent) leads the downside trend scores currently with the US Dollar Index (-37 percent), Australian Dollar (-5 percent) and the British Pound (-4 percent) following next with lower trend scores.
3-Year Strength Trends:
US Dollar Index (-36.9 percent) vs US Dollar Index previous week (-26.8 percent)
EuroFX (19.8 percent) vs EuroFX previous week (30.2 percent)
British Pound Sterling (-3.9 percent) vs British Pound Sterling previous week (-5.4 percent)
Japanese Yen (12.1 percent) vs Japanese Yen previous week (10.6 percent)
Swiss Franc (23.3 percent) vs Swiss Franc previous week (18.6 percent)
Canadian Dollar (33.7 percent) vs Canadian Dollar previous week (26.8 percent)
Australian Dollar (-4.5 percent) vs Australian Dollar previous week (-7.5 percent)
New Zealand Dollar (30.1 percent) vs New Zealand Dollar previous week (26.2 percent)
Mexican Peso (5.7 percent) vs Mexican Peso previous week (7.0 percent)
Brazilian Real (7.6 percent) vs Brazilian Real previous week (5.6 percent)
Bitcoin (-50.9 percent) vs Bitcoin previous week (-0.6 percent)
This week’s current strength score (the trader positioning range over the past three years, measured from 0 to 100) shows the speculators are currently Bearish-Extreme with a score of 4.7 percent. The commercials are Bullish-Extreme with a score of 98.0 percent and the small traders (not shown in chart) are Bearish-Extreme with a score of 16.6 percent.
Our weekly trend-following model classifies the current market price position as: Strong Downtrend.
| US DOLLAR INDEX Statistics | SPECULATORS | COMMERCIALS | SMALL TRADERS |
| – Percent of Open Interest Longs: | 56.9 | 28.2 | 9.0 |
| – Percent of Open Interest Shorts: | 59.8 | 22.2 | 12.0 |
| – Net Position: | -974 | 1,985 | -1,011 |
| – Gross Longs: | 18,696 | 9,286 | 2,951 |
| – Gross Shorts: | 19,670 | 7,301 | 3,962 |
| – Long to Short Ratio: | 1.0 to 1 | 1.3 to 1 | 0.7 to 1 |
| NET POSITION TREND: | |||
| – Strength Index Score (3 Year Range Pct): | 4.7 | 98.0 | 16.6 |
| – Strength Index Reading (3 Year Range): | Bearish-Extreme | Bullish-Extreme | Bearish-Extreme |
| NET POSITION MOVEMENT INDEX: | |||
| – 6-Week Change in Strength Index: | -36.9 | 38.0 | -19.8 |
This week’s current strength score (the trader positioning range over the past three years, measured from 0 to 100) shows the speculators are currently Bullish with a score of 53.5 percent. The commercials are Bearish with a score of 41.0 percent and the small traders (not shown in chart) are Bullish-Extreme with a score of 90.8 percent.
Our weekly trend-following model classifies the current market price position as: Strong Uptrend.
| EURO Currency Statistics | SPECULATORS | COMMERCIALS | SMALL TRADERS |
| – Percent of Open Interest Longs: | 27.3 | 55.8 | 13.4 |
| – Percent of Open Interest Shorts: | 18.2 | 72.2 | 6.0 |
| – Net Position: | 65,028 | -117,941 | 52,913 |
| – Gross Longs: | 196,205 | 401,257 | 96,353 |
| – Gross Shorts: | 131,177 | 519,198 | 43,440 |
| – Long to Short Ratio: | 1.5 to 1 | 0.8 to 1 | 2.2 to 1 |
| NET POSITION TREND: | |||
| – Strength Index Score (3 Year Range Pct): | 53.5 | 41.0 | 90.8 |
| – Strength Index Reading (3 Year Range): | Bullish | Bearish | Bullish-Extreme |
| NET POSITION MOVEMENT INDEX: | |||
| – 6-Week Change in Strength Index: | 19.8 | -23.9 | 40.4 |
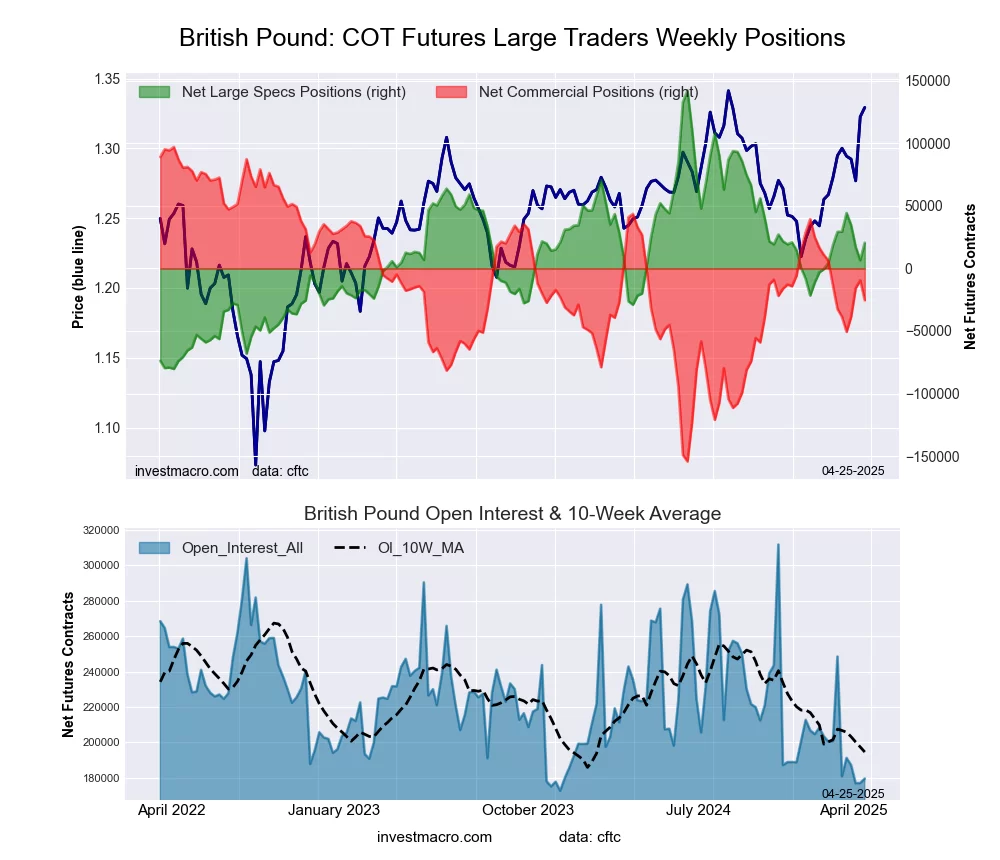
This week’s current strength score (the trader positioning range over the past three years, measured from 0 to 100) shows the speculators are currently Bearish with a score of 45.3 percent. The commercials are Bullish with a score of 51.3 percent and the small traders (not shown in chart) are Bullish with a score of 72.6 percent.
Our weekly trend-following model classifies the current market price position as: Strong Uptrend.
| BRITISH POUND Statistics | SPECULATORS | COMMERCIALS | SMALL TRADERS |
| – Percent of Open Interest Longs: | 52.4 | 30.3 | 16.3 |
| – Percent of Open Interest Shorts: | 41.0 | 44.5 | 13.6 |
| – Net Position: | 20,490 | -25,439 | 4,949 |
| – Gross Longs: | 94,021 | 54,477 | 29,322 |
| – Gross Shorts: | 73,531 | 79,916 | 24,373 |
| – Long to Short Ratio: | 1.3 to 1 | 0.7 to 1 | 1.2 to 1 |
| NET POSITION TREND: | |||
| – Strength Index Score (3 Year Range Pct): | 45.3 | 51.3 | 72.6 |
| – Strength Index Reading (3 Year Range): | Bearish | Bullish | Bullish |
| NET POSITION MOVEMENT INDEX: | |||
| – 6-Week Change in Strength Index: | -3.9 | 2.8 | 3.7 |
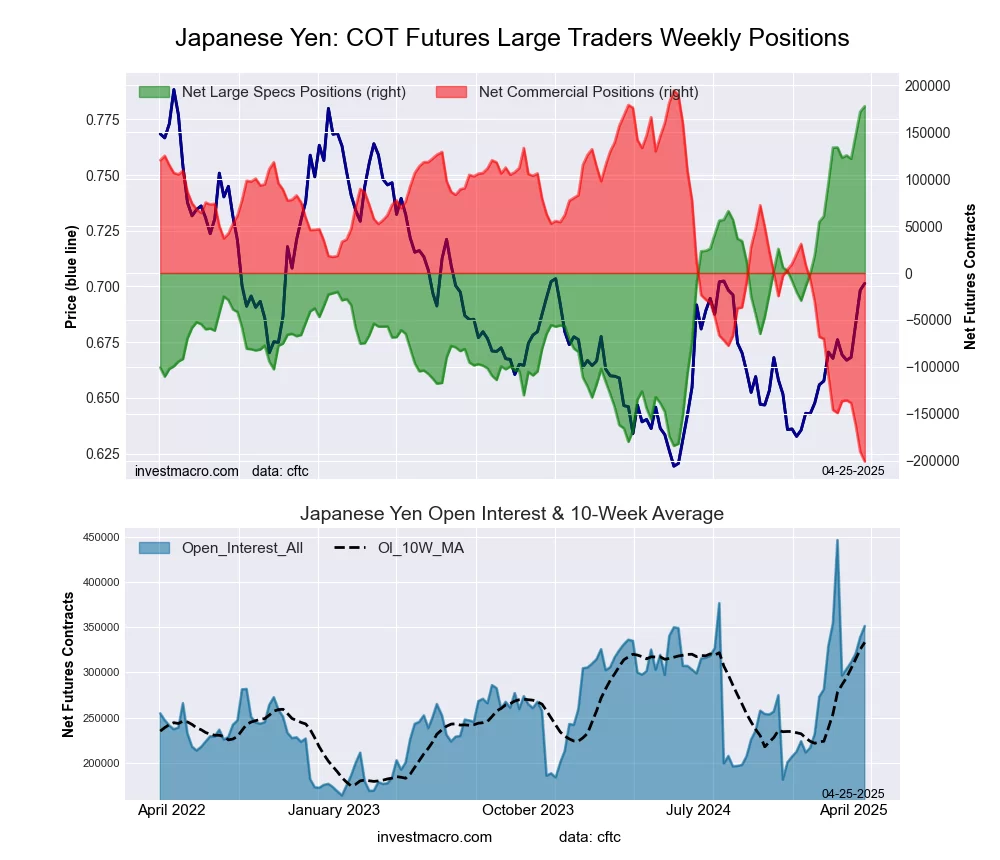
This week’s current strength score (the trader positioning range over the past three years, measured from 0 to 100) shows the speculators are currently Bullish-Extreme with a score of 100.0 percent. The commercials are Bearish-Extreme with a score of 0.0 percent and the small traders (not shown in chart) are Bullish-Extreme with a score of 100.0 percent.
Our weekly trend-following model classifies the current market price position as: Strong Uptrend.
| JAPANESE YEN Statistics | SPECULATORS | COMMERCIALS | SMALL TRADERS |
| – Percent of Open Interest Longs: | 57.6 | 28.6 | 12.7 |
| – Percent of Open Interest Shorts: | 7.0 | 85.8 | 6.1 |
| – Net Position: | 177,814 | -200,922 | 23,108 |
| – Gross Longs: | 202,373 | 100,299 | 44,643 |
| – Gross Shorts: | 24,559 | 301,221 | 21,535 |
| – Long to Short Ratio: | 8.2 to 1 | 0.3 to 1 | 2.1 to 1 |
| NET POSITION TREND: | |||
| – Strength Index Score (3 Year Range Pct): | 100.0 | 0.0 | 100.0 |
| – Strength Index Reading (3 Year Range): | Bullish-Extreme | Bearish-Extreme | Bullish-Extreme |
| NET POSITION MOVEMENT INDEX: | |||
| – 6-Week Change in Strength Index: | 12.1 | -13.1 | 18.1 |
This week’s current strength score (the trader positioning range over the past three years, measured from 0 to 100) shows the speculators are currently Bearish with a score of 49.3 percent. The commercials are Bearish with a score of 43.1 percent and the small traders (not shown in chart) are Bullish with a score of 73.4 percent.
Our weekly trend-following model classifies the current market price position as: Strong Uptrend.
| SWISS FRANC Statistics | SPECULATORS | COMMERCIALS | SMALL TRADERS |
| – Percent of Open Interest Longs: | 7.3 | 74.4 | 18.1 |
| – Percent of Open Interest Shorts: | 42.2 | 37.7 | 19.8 |
| – Net Position: | -25,474 | 26,742 | -1,268 |
| – Gross Longs: | 5,322 | 54,226 | 13,198 |
| – Gross Shorts: | 30,796 | 27,484 | 14,466 |
| – Long to Short Ratio: | 0.2 to 1 | 2.0 to 1 | 0.9 to 1 |
| NET POSITION TREND: | |||
| – Strength Index Score (3 Year Range Pct): | 49.3 | 43.1 | 73.4 |
| – Strength Index Reading (3 Year Range): | Bearish | Bearish | Bullish |
| NET POSITION MOVEMENT INDEX: | |||
| – 6-Week Change in Strength Index: | 23.3 | -25.2 | 17.0 |
This week’s current strength score (the trader positioning range over the past three years, measured from 0 to 100) shows the speculators are currently Bullish with a score of 57.9 percent. The commercials are Bearish with a score of 44.6 percent and the small traders (not shown in chart) are Bearish with a score of 26.8 percent.
Our weekly trend-following model classifies the current market price position as: Strong Uptrend.
| CANADIAN DOLLAR Statistics | SPECULATORS | COMMERCIALS | SMALL TRADERS |
| – Percent of Open Interest Longs: | 7.4 | 82.2 | 9.5 |
| – Percent of Open Interest Shorts: | 34.3 | 52.9 | 11.9 |
| – Net Position: | -67,167 | 73,173 | -6,006 |
| – Gross Longs: | 18,357 | 205,325 | 23,821 |
| – Gross Shorts: | 85,524 | 132,152 | 29,827 |
| – Long to Short Ratio: | 0.2 to 1 | 1.6 to 1 | 0.8 to 1 |
| NET POSITION TREND: | |||
| – Strength Index Score (3 Year Range Pct): | 57.9 | 44.6 | 26.8 |
| – Strength Index Reading (3 Year Range): | Bullish | Bearish | Bearish |
| NET POSITION MOVEMENT INDEX: | |||
| – 6-Week Change in Strength Index: | 33.7 | -35.2 | 22.1 |
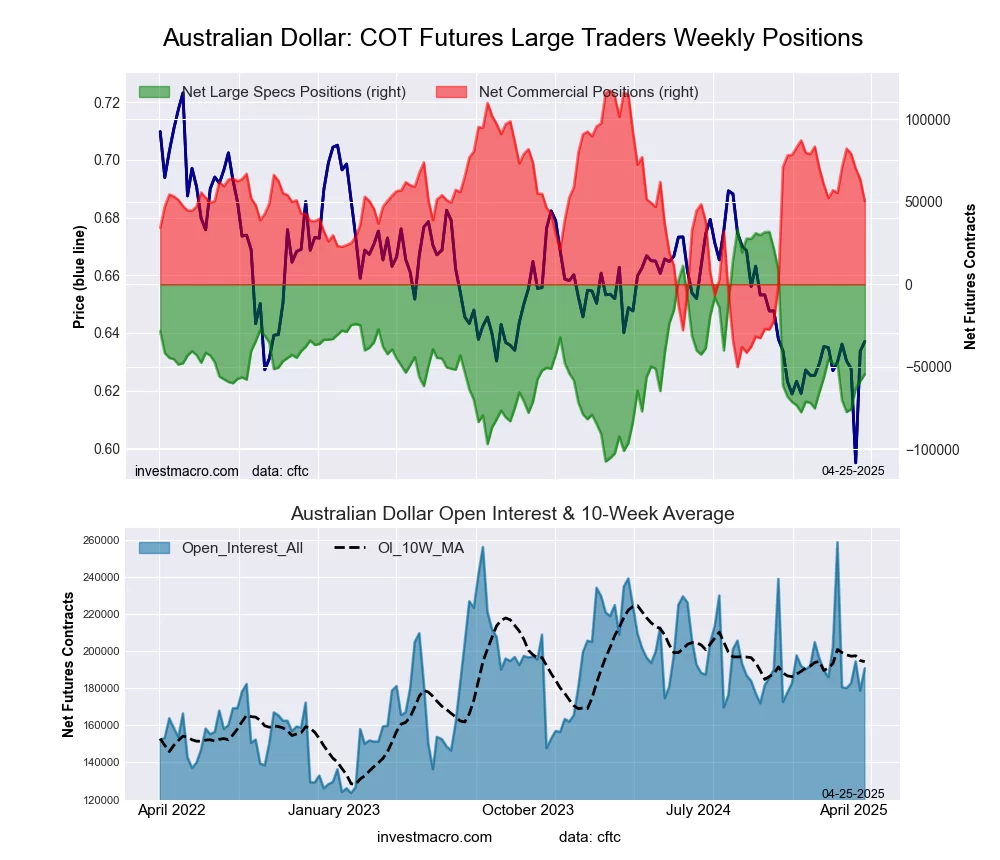
This week’s current strength score (the trader positioning range over the past three years, measured from 0 to 100) shows the speculators are currently Bearish with a score of 37.6 percent. The commercials are Bullish with a score of 60.0 percent and the small traders (not shown in chart) are Bullish with a score of 60.0 percent.
Our weekly trend-following model classifies the current market price position as: Strong Uptrend.
| AUSTRALIAN DOLLAR Statistics | SPECULATORS | COMMERCIALS | SMALL TRADERS |
| – Percent of Open Interest Longs: | 14.2 | 65.8 | 12.7 |
| – Percent of Open Interest Shorts: | 42.9 | 39.4 | 10.5 |
| – Net Position: | -54,582 | 50,430 | 4,152 |
| – Gross Longs: | 27,175 | 125,583 | 24,156 |
| – Gross Shorts: | 81,757 | 75,153 | 20,004 |
| – Long to Short Ratio: | 0.3 to 1 | 1.7 to 1 | 1.2 to 1 |
| NET POSITION TREND: | |||
| – Strength Index Score (3 Year Range Pct): | 37.6 | 60.0 | 60.0 |
| – Strength Index Reading (3 Year Range): | Bearish | Bullish | Bullish |
| NET POSITION MOVEMENT INDEX: | |||
| – 6-Week Change in Strength Index: | -4.5 | -3.0 | 29.8 |
This week’s current strength score (the trader positioning range over the past three years, measured from 0 to 100) shows the speculators are currently Bearish with a score of 33.4 percent. The commercials are Bullish with a score of 65.0 percent and the small traders (not shown in chart) are Bearish with a score of 46.4 percent.
Our weekly trend-following model classifies the current market price position as: Strong Uptrend.
| NEW ZEALAND DOLLAR Statistics | SPECULATORS | COMMERCIALS | SMALL TRADERS |
| – Percent of Open Interest Longs: | 15.8 | 77.1 | 6.3 |
| – Percent of Open Interest Shorts: | 58.7 | 33.3 | 7.2 |
| – Net Position: | -26,895 | 27,449 | -554 |
| – Gross Longs: | 9,897 | 48,333 | 3,948 |
| – Gross Shorts: | 36,792 | 20,884 | 4,502 |
| – Long to Short Ratio: | 0.3 to 1 | 2.3 to 1 | 0.9 to 1 |
| NET POSITION TREND: | |||
| – Strength Index Score (3 Year Range Pct): | 33.4 | 65.0 | 46.4 |
| – Strength Index Reading (3 Year Range): | Bearish | Bullish | Bearish |
| NET POSITION MOVEMENT INDEX: | |||
| – 6-Week Change in Strength Index: | 30.1 | -31.3 | 23.4 |
This week’s current strength score (the trader positioning range over the past three years, measured from 0 to 100) shows the speculators are currently Bearish with a score of 49.7 percent. The commercials are Bullish with a score of 52.4 percent and the small traders (not shown in chart) are Bearish with a score of 29.3 percent.
Our weekly trend-following model classifies the current market price position as: Strong Uptrend.
| MEXICAN PESO Statistics | SPECULATORS | COMMERCIALS | SMALL TRADERS |
| – Percent of Open Interest Longs: | 51.9 | 43.2 | 3.7 |
| – Percent of Open Interest Shorts: | 20.3 | 75.7 | 2.8 |
| – Net Position: | 41,165 | -42,348 | 1,183 |
| – Gross Longs: | 67,624 | 56,341 | 4,828 |
| – Gross Shorts: | 26,459 | 98,689 | 3,645 |
| – Long to Short Ratio: | 2.6 to 1 | 0.6 to 1 | 1.3 to 1 |
| NET POSITION TREND: | |||
| – Strength Index Score (3 Year Range Pct): | 49.7 | 52.4 | 29.3 |
| – Strength Index Reading (3 Year Range): | Bearish | Bullish | Bearish |
| NET POSITION MOVEMENT INDEX: | |||
| – 6-Week Change in Strength Index: | 5.7 | -6.2 | 5.4 |
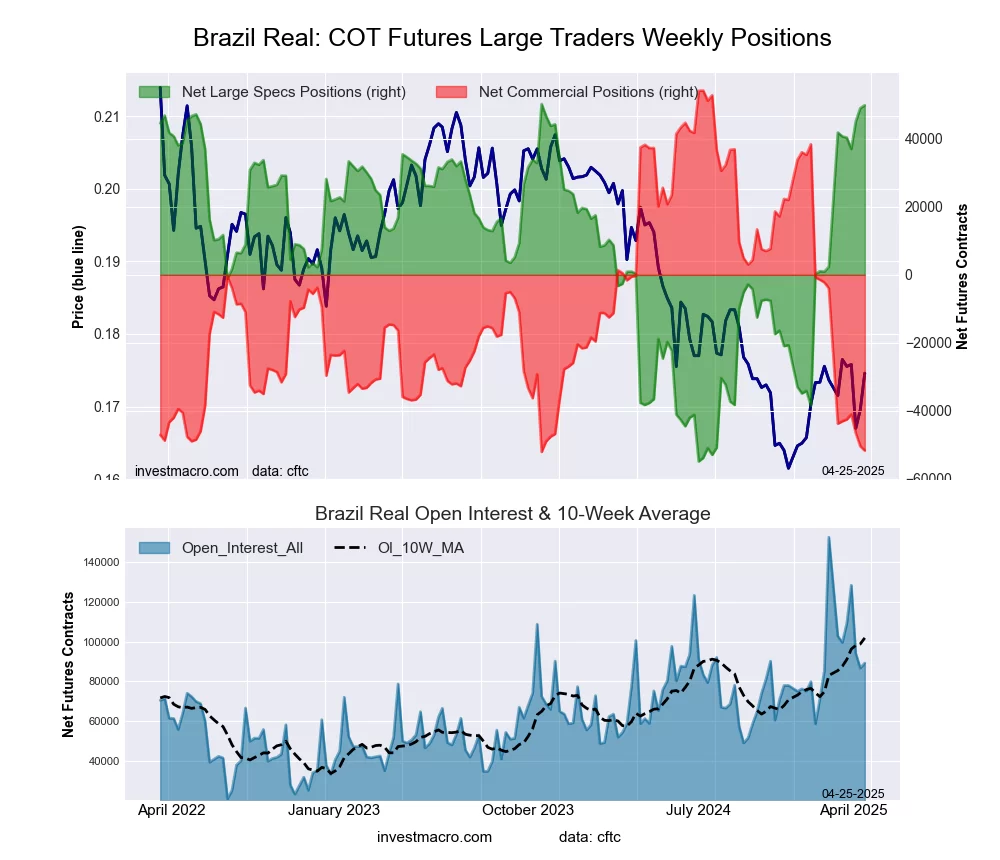
This week’s current strength score (the trader positioning range over the past three years, measured from 0 to 100) shows the speculators are currently Bullish-Extreme with a score of 99.7 percent. The commercials are Bearish-Extreme with a score of 0.4 percent and the small traders (not shown in chart) are Bearish with a score of 31.0 percent.
Our weekly trend-following model classifies the current market price position as: Strong Uptrend.
| BRAZIL REAL Statistics | SPECULATORS | COMMERCIALS | SMALL TRADERS |
| – Percent of Open Interest Longs: | 71.2 | 23.5 | 4.2 |
| – Percent of Open Interest Shorts: | 15.3 | 81.5 | 2.2 |
| – Net Position: | 49,887 | -51,682 | 1,795 |
| – Gross Longs: | 63,534 | 21,010 | 3,743 |
| – Gross Shorts: | 13,647 | 72,692 | 1,948 |
| – Long to Short Ratio: | 4.7 to 1 | 0.3 to 1 | 1.9 to 1 |
| NET POSITION TREND: | |||
| – Strength Index Score (3 Year Range Pct): | 99.7 | 0.4 | 31.0 |
| – Strength Index Reading (3 Year Range): | Bullish-Extreme | Bearish-Extreme | Bearish |
| NET POSITION MOVEMENT INDEX: | |||
| – 6-Week Change in Strength Index: | 7.6 | -7.4 | -0.7 |
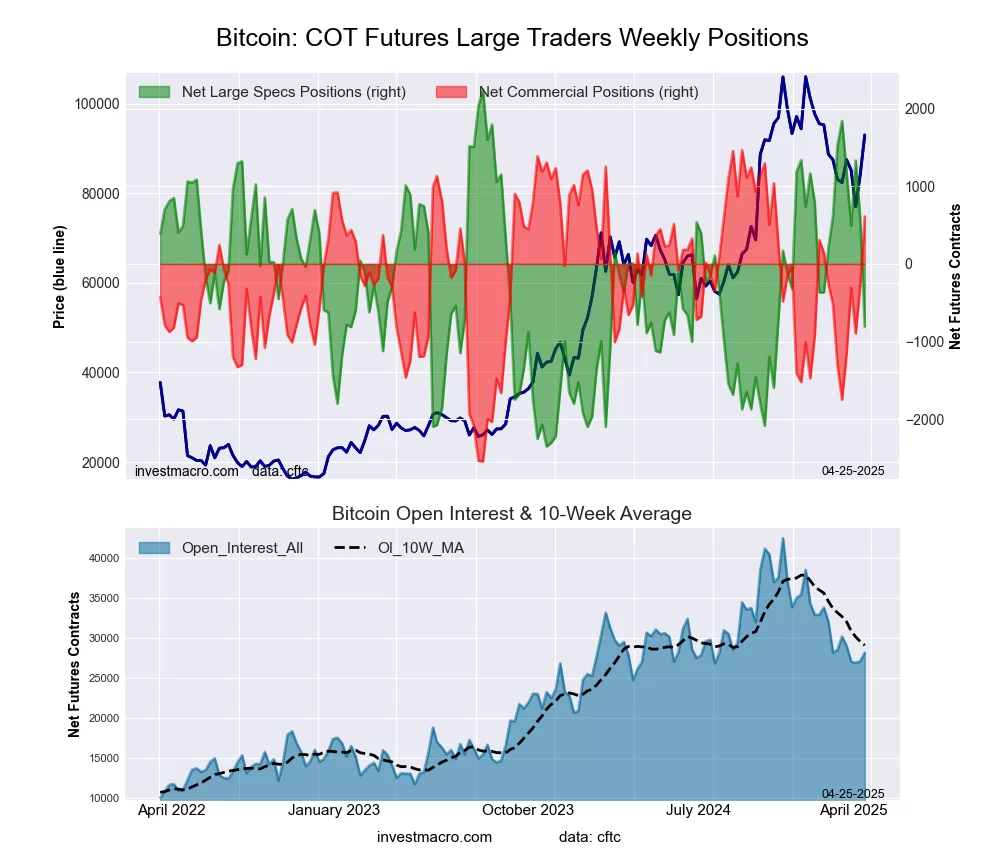
This week’s current strength score (the trader positioning range over the past three years, measured from 0 to 100) shows the speculators are currently Bearish with a score of 33.7 percent. The commercials are Bullish with a score of 78.7 percent and the small traders (not shown in chart) are Bearish with a score of 38.2 percent.
Our weekly trend-following model classifies the current market price position as: Weak Downtrend.
| BITCOIN Statistics | SPECULATORS | COMMERCIALS | SMALL TRADERS |
| – Percent of Open Interest Longs: | 81.8 | 3.8 | 4.4 |
| – Percent of Open Interest Shorts: | 84.6 | 1.7 | 3.8 |
| – Net Position: | -806 | 612 | 194 |
| – Gross Longs: | 23,058 | 1,080 | 1,253 |
| – Gross Shorts: | 23,864 | 468 | 1,059 |
| – Long to Short Ratio: | 1.0 to 1 | 2.3 to 1 | 1.2 to 1 |
| NET POSITION TREND: | |||
| – Strength Index Score (3 Year Range Pct): | 33.7 | 78.7 | 38.2 |
| – Strength Index Reading (3 Year Range): | Bearish | Bullish | Bearish |
| NET POSITION MOVEMENT INDEX: | |||
| – 6-Week Change in Strength Index: | -50.9 | 47.7 | 25.7 |
Article By InvestMacro – Receive our weekly COT Newsletter
*COT Report: The COT data, released weekly to the public each Friday, is updated through the most recent Tuesday (data is 3 days old) and shows a quick view of how large speculators or non-commercials (for-profit traders) were positioned in the futures markets.
The CFTC categorizes trader positions according to commercial hedgers (traders who use futures contracts for hedging as part of the business), non-commercials (large traders who speculate to realize trading profits) and nonreportable traders (usually small traders/speculators) as well as their open interest (contracts open in the market at time of reporting). See CFTC criteria here.
By ForexTime FXTM’s USDInd ↑ 2% MTD Dollar best performing G10 currency MTD Geopolitical risk…
By JustMarkets The US stock market concluded Thursday’s session in the red as the escalating…
By Analytical Department RoboForex EUR/USD is holding near 1.1620 on Friday, with the US dollar…
By JustMarkets The US stock market rose on Wednesday. By the end of the day,…
By Daniele D'Alvia, Queen Mary University of London When a conflict escalates, financial markets respond…
By Analytical Department RoboForex GBP/USD contracted to 1.3350 on Thursday, with the pound remaining under…
This website uses cookies.