By RoboForex Analytical Department
NZD/USD is attempting to recover from yesterday’s decline on Thursday and is heading towards 0.6148. The pair came under downward pressure on 29 August, and since then its attempts to stabilise have not brought any tangible result. The ambiguous US inflation release has increased bets that the Federal Reserve will ease monetary policy very cautiously next week. This means a 25-basis-point interest rate cut.
The Reserve Bank of New Zealand has already started its easing cycle, with a launch in August. At that time, the RBNZ cut interest rates by 25 basis points, marking the first reduction in four years. The RBNZ is expected to lower borrowing costs at each of the two meetings scheduled for this year, with a 50-basis-point rate cut possible at one of these meetings.
The consensus forecast suggests that the cash rate will be 3.00% by the end of 2025, down from 5.25% now. As for the latest statistics, annual food inflation in New Zealand eased to 0.4% in August from the previous 0.6%. This is a good signal, enabling the RBNZ to maintain its global easing stance.
Technical analysis of NZD/USD
Free Reports:
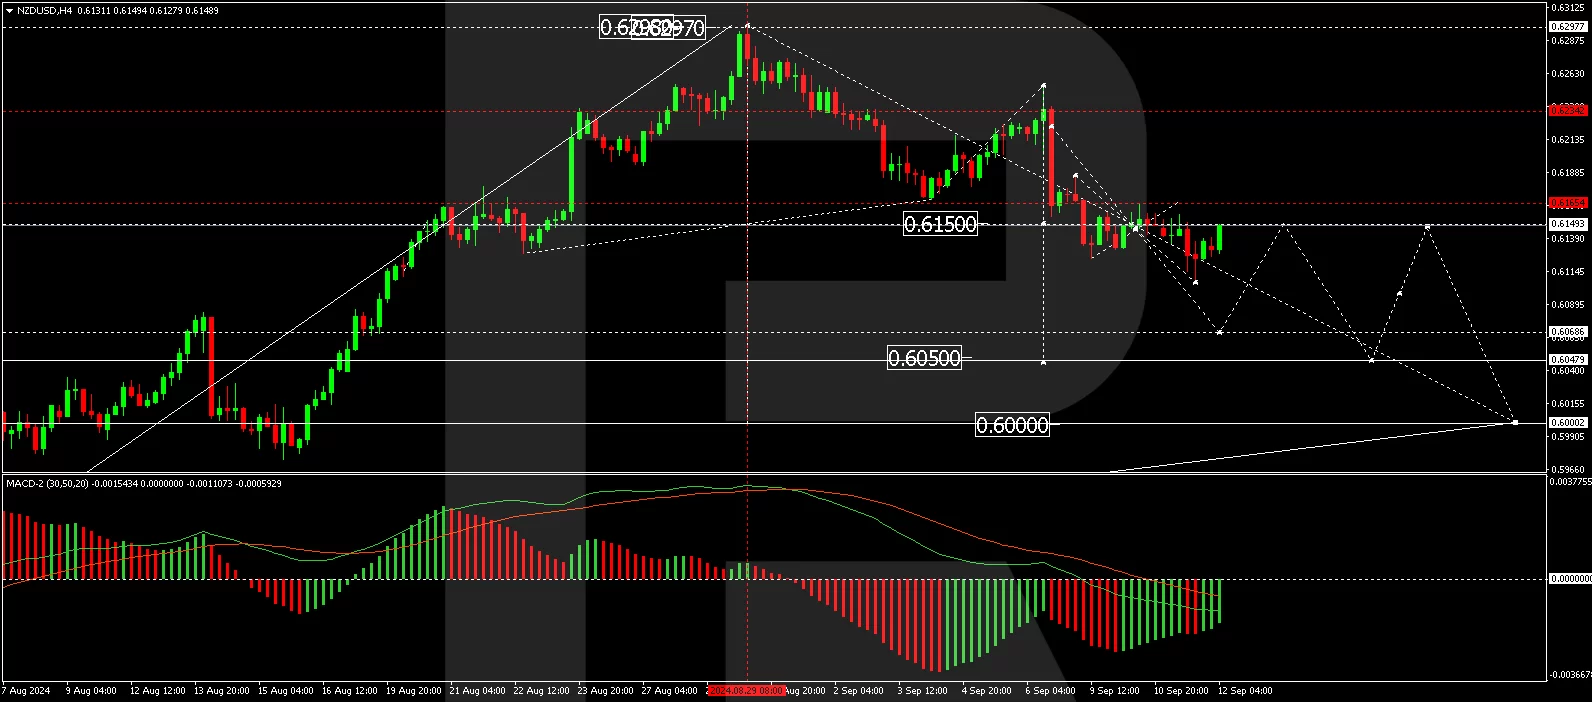
The NZD/USD H4 chart shows that the market has completed a downward wave, reaching 0.6106. A corrective structure is forming today, aiming for 0.6150 (testing from below). The correction could extend to 0.6166. Subsequently, the price might decline to 0.6070, potentially continuing the trend towards the local target of 0.6050. This scenario is technically supported by the MACD indicator, whose signal line is below zero and pointing strictly downwards.
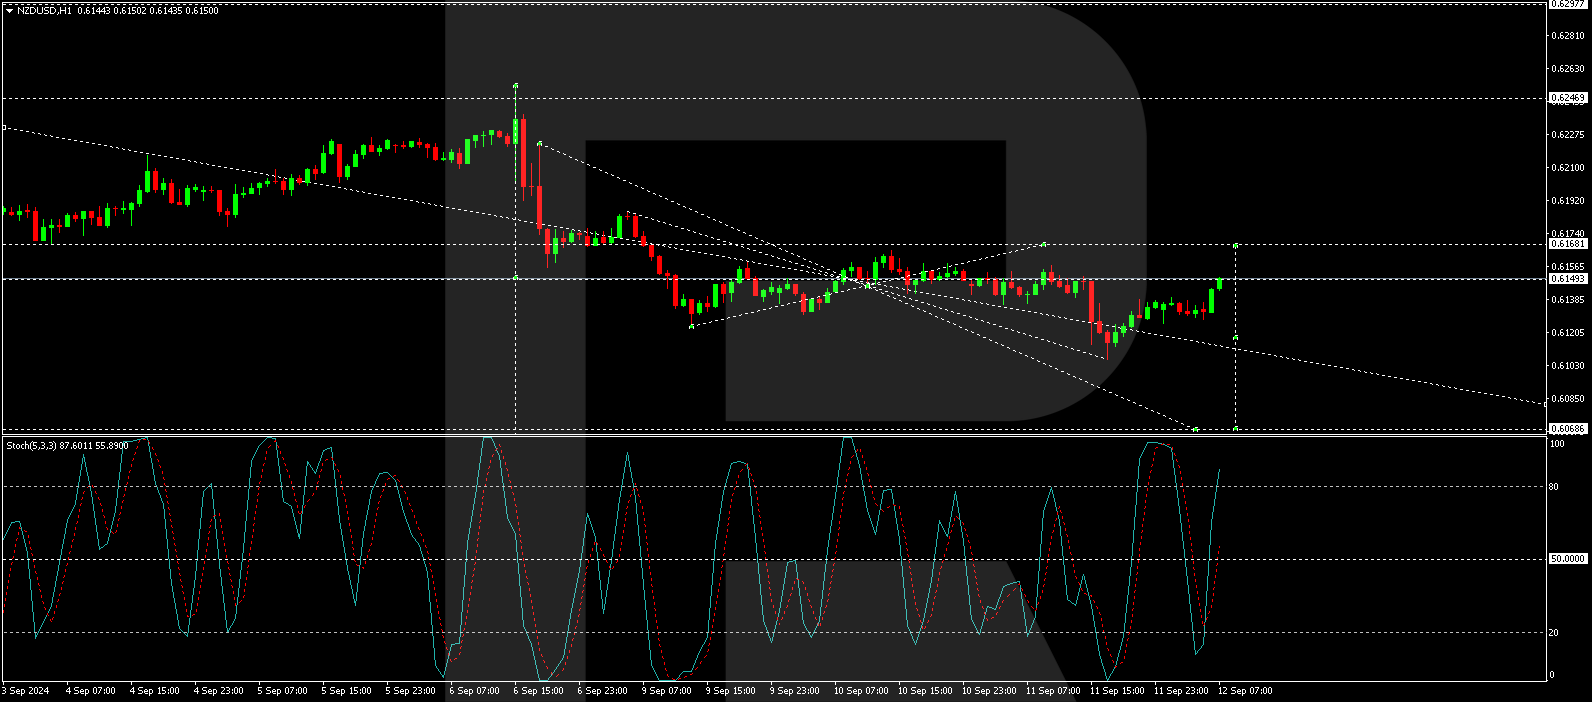
The NZD/USD H1 chart shows that the market has formed a consolidation range around 0.6140 and extended it down to 0.6106. Today, the market is correcting the downward wave, with the target for a correction of at least 0.6157. Once the correction is complete, the downward wave could develop towards 0.6069. This scenario is also technically supported by the Stochastic oscillator, whose signal line is below 50 and pointing strictly towards 80. Subsequently, a decline to 20 is expected.
Disclaimer
Any forecasts contained herein are based on the author’s particular opinion. This analysis may not be treated as trading advice. RoboForex bears no responsibility for trading results based on trading recommendations and reviews contained herein.
By JustMarkets The US equity indices ended Friday’s session mixed. The Dow Jones (US30) gained…
By Analytical Department RoboForex EUR/USD enters the final week of July at 1.1369. Friday's modest…
By InvestMacro Here are the latest charts and statistics for the Commitment of Traders (COT)…
By InvestMacro The latest update for the weekly Commitment of Traders (COT) report was released…
By InvestMacro Here are the latest charts and statistics for the Commitment of Traders (COT)…
By InvestMacro Here are the latest charts and statistics for the Commitment of Traders (COT)…
This website uses cookies.