
By InvestMacro
Here are the latest charts and statistics for the Commitment of Traders (COT) data published by the Commodities Futures Trading Commission (CFTC).
The latest COT data is updated through Tuesday September 12th and shows a quick view of how large traders (for-profit speculators and commercial entities) were positioned in the futures markets.
Weekly Speculator Bets led lower by Gold, Silver & Platinum
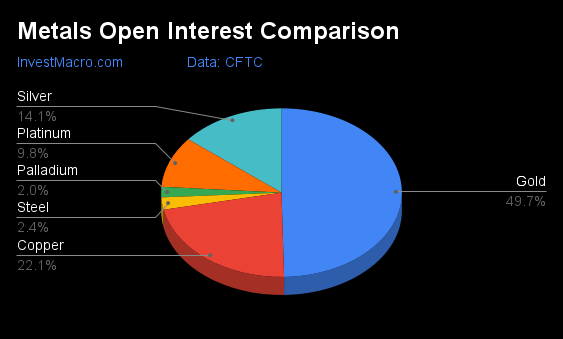
The COT metals markets speculator bets were overall lower this week as just one out of the six metals markets we cover had higher positioning while the other five markets had lower speculator contracts.
Free Reports:
 Get our Weekly Commitment of Traders Reports - See where the biggest traders (Hedge Funds and Commercial Hedgers) are positioned in the futures markets on a weekly basis.
 Sign Up for Our Stock Market Newsletter – Get updated on News, Charts & Rankings of Public Companies when you join our Stocks Newsletter
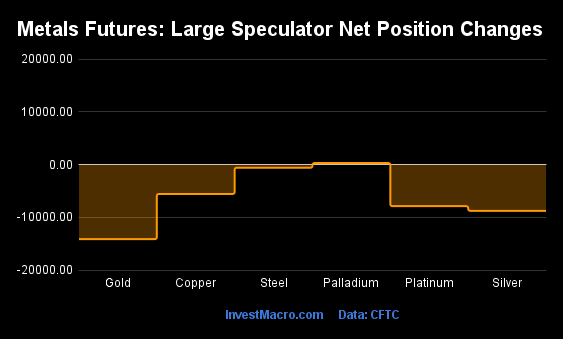
Leading the gains for the metals was Palladium (309 contracts) with also showing positive weeks.
The markets with declines in speculator bets for the week were Gold (-14,142 contracts) with Silver (-8,771 contracts), Platinum (-7,881 contracts), Copper (-5,564 contracts) and Steel (-588 contracts) also registering lower bets on the week.
| Sep-12-2023 | OI | OI-Index | Spec-Net | Spec-Index | Com-Net | COM-Index | Smalls-Net | Smalls-Index |
|---|---|---|---|---|---|---|---|---|
| Gold | 441,221 | 9 | 123,864 | 32 | -144,810 | 68 | 20,946 | 32 |
| Silver | 125,292 | 14 | 18,033 | 44 | -32,040 | 55 | 14,007 | 44 |
| Copper | 196,198 | 39 | -12,334 | 20 | 9,886 | 80 | 2,448 | 34 |
| Palladium | 17,838 | 82 | -10,712 | 2 | 10,761 | 99 | -49 | 39 |
| Platinum | 87,021 | 100 | 6,721 | 31 | -12,396 | 68 | 5,675 | 44 |
Strength Scores led by Steel & Silver
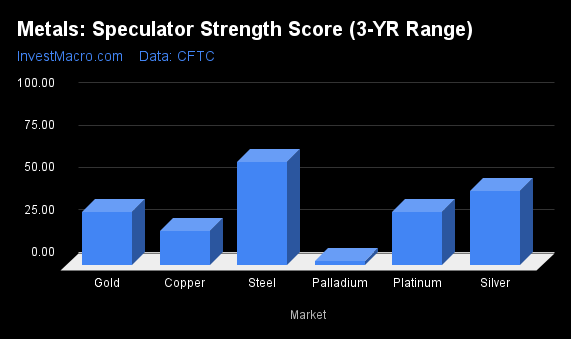
COT Strength Scores (a normalized measure of Speculator positions over a 3-Year range, from 0 to 100 where above 80 is Extreme-Bullish and below 20 is Extreme-Bearish) showed that Steel (61 percent) and Silver (44 percent) lead the metals markets this week. Palladium (2 percent) comes in as the next highest in the weekly strength scores.
On the downside, Copper (20 percent) comes in at the lowest strength level currently and is in Extreme-Bearish territory (below 20 percent). The next lowest strength score was Platinum (31 percent).
Strength Statistics:
Gold (31.6 percent) vs Gold previous week (37.8 percent)
Silver (44.0 percent) vs Silver previous week (56.5 percent)
Copper (20.2 percent) vs Copper previous week (25.0 percent)
Platinum (31.1 percent) vs Platinum previous week (49.3 percent)
Palladium (2.1 percent) vs Palladium previous week (0.0 percent)
Steel (60.6 percent) vs Palladium previous week (62.3 percent)
Steel & Palladium top the 6-Week Strength Trends
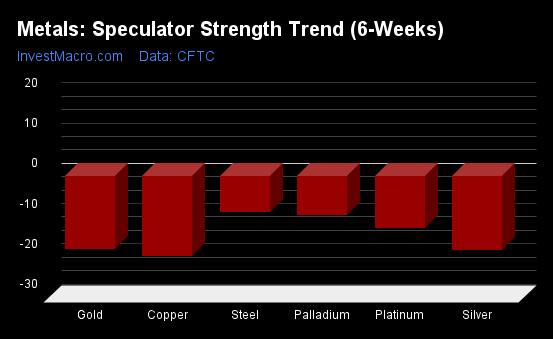
COT Strength Score Trends (or move index, calculates the 6-week changes in strength scores) showed that Steel (-9 percent) and Palladium (-10 percent) lead the past six weeks trends for metals. Silver (-18 percent) is the next highest positive mover in the latest trends data.
Gold (-18 percent) leads the downside trend scores currently with Copper (-20 percent) as the next market with lower trend scores.
Move Statistics:
Gold (-18.1 percent) vs Gold previous week (-15.7 percent)
Silver (-18.3 percent) vs Silver previous week (-14.4 percent)
Copper (-19.9 percent) vs Copper previous week (-6.9 percent)
Platinum (-12.9 percent) vs Platinum previous week (-2.0 percent)
Palladium (-9.6 percent) vs Palladium previous week (-17.9 percent)
Steel (-8.9 percent) vs Steel previous week (-8.1 percent)
Individual Markets:
Gold Comex Futures:
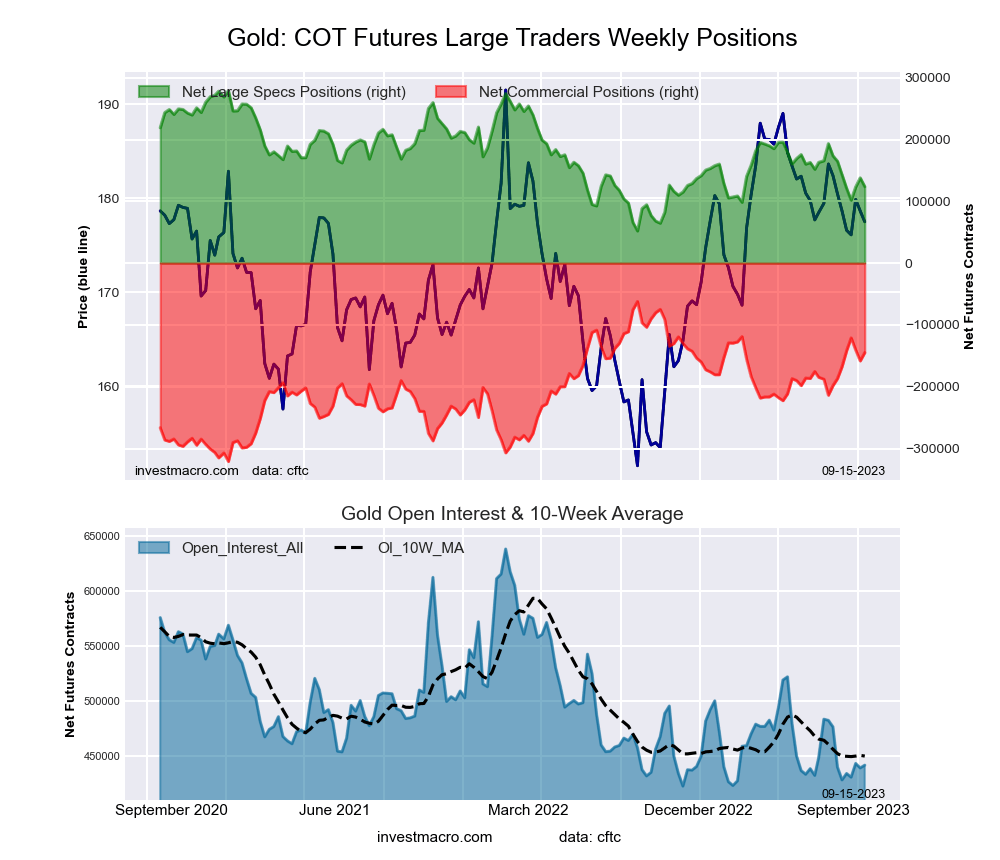 The Gold Comex Futures large speculator standing this week came in at a net position of 123,864 contracts in the data reported through Tuesday. This was a weekly lowering of -14,142 contracts from the previous week which had a total of 138,006 net contracts.
This week’s current strength score (the trader positioning range over the past three years, measured from 0 to 100) shows the speculators are currently Bearish with a score of 31.6 percent. The commercials are Bullish with a score of 68.1 percent and the small traders (not shown in chart) are Bearish with a score of 32.4 percent.
Price Trend-Following Model: Downtrend
Our weekly trend-following model classifies the current market price position as: Downtrend. The current action for the model is considered to be: Hold – Maintain Short Position.
| Gold Futures Statistics | SPECULATORS | COMMERCIALS | SMALL TRADERS |
| – Percent of Open Interest Longs: | 53.4 | 25.6 | 10.6 |
| – Percent of Open Interest Shorts: | 25.3 | 58.4 | 5.8 |
| – Net Position: | 123,864 | -144,810 | 20,946 |
| – Gross Longs: | 235,704 | 113,062 | 46,740 |
| – Gross Shorts: | 111,840 | 257,872 | 25,794 |
| – Long to Short Ratio: | 2.1 to 1 | 0.4 to 1 | 1.8 to 1 |
| NET POSITION TREND: | |||
| – Strength Index Score (3 Year Range Pct): | 31.6 | 68.1 | 32.4 |
| – Strength Index Reading (3 Year Range): | Bearish | Bullish | Bearish |
| NET POSITION MOVEMENT INDEX: | |||
| – 6-Week Change in Strength Index: | -18.1 | 16.2 | -2.5 |
Silver Comex Futures:
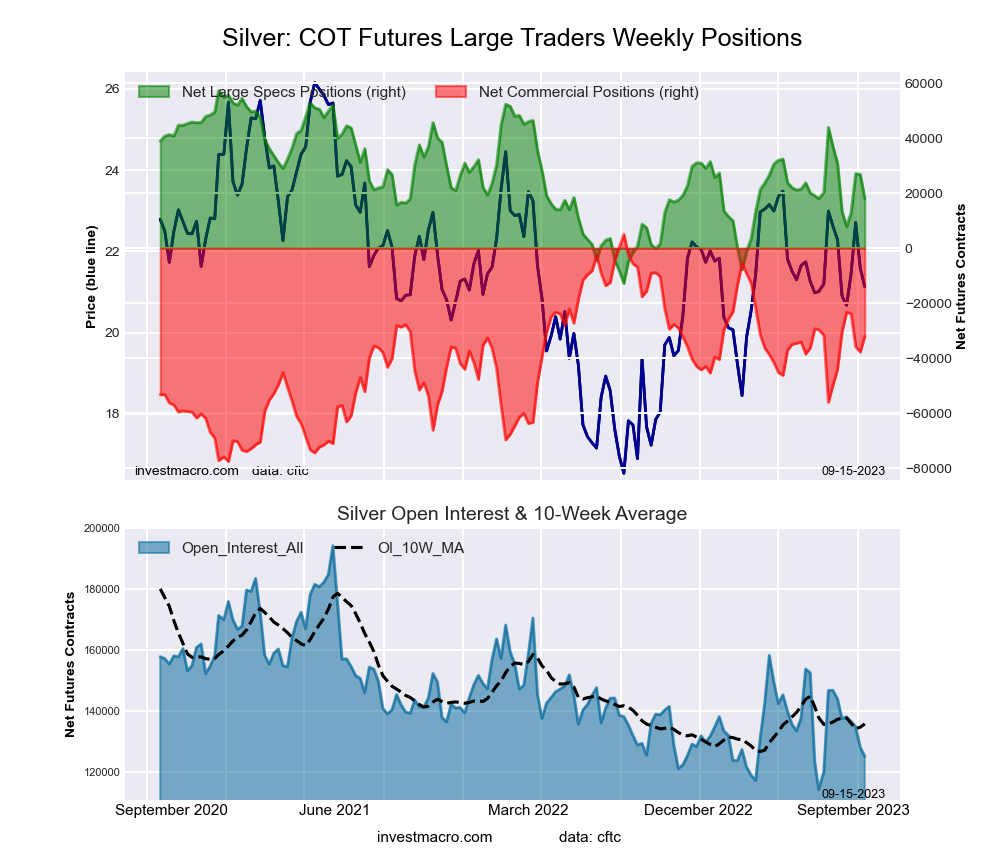 The Silver Comex Futures large speculator standing this week came in at a net position of 18,033 contracts in the data reported through Tuesday. This was a weekly reduction of -8,771 contracts from the previous week which had a total of 26,804 net contracts.
This week’s current strength score (the trader positioning range over the past three years, measured from 0 to 100) shows the speculators are currently Bearish with a score of 44.0 percent. The commercials are Bullish with a score of 55.1 percent and the small traders (not shown in chart) are Bearish with a score of 44.3 percent.
Price Trend-Following Model: Strong Downtrend
Our weekly trend-following model classifies the current market price position as: Strong Downtrend. The current action for the model is considered to be: Hold – Maintain Short Position.
| Silver Futures Statistics | SPECULATORS | COMMERCIALS | SMALL TRADERS |
| – Percent of Open Interest Longs: | 42.3 | 31.9 | 21.1 |
| – Percent of Open Interest Shorts: | 27.9 | 57.5 | 9.9 |
| – Net Position: | 18,033 | -32,040 | 14,007 |
| – Gross Longs: | 52,963 | 40,030 | 26,427 |
| – Gross Shorts: | 34,930 | 72,070 | 12,420 |
| – Long to Short Ratio: | 1.5 to 1 | 0.6 to 1 | 2.1 to 1 |
| NET POSITION TREND: | |||
| – Strength Index Score (3 Year Range Pct): | 44.0 | 55.1 | 44.3 |
| – Strength Index Reading (3 Year Range): | Bearish | Bullish | Bearish |
| NET POSITION MOVEMENT INDEX: | |||
| – 6-Week Change in Strength Index: | -18.3 | 14.5 | 4.6 |
Copper Grade #1 Futures:
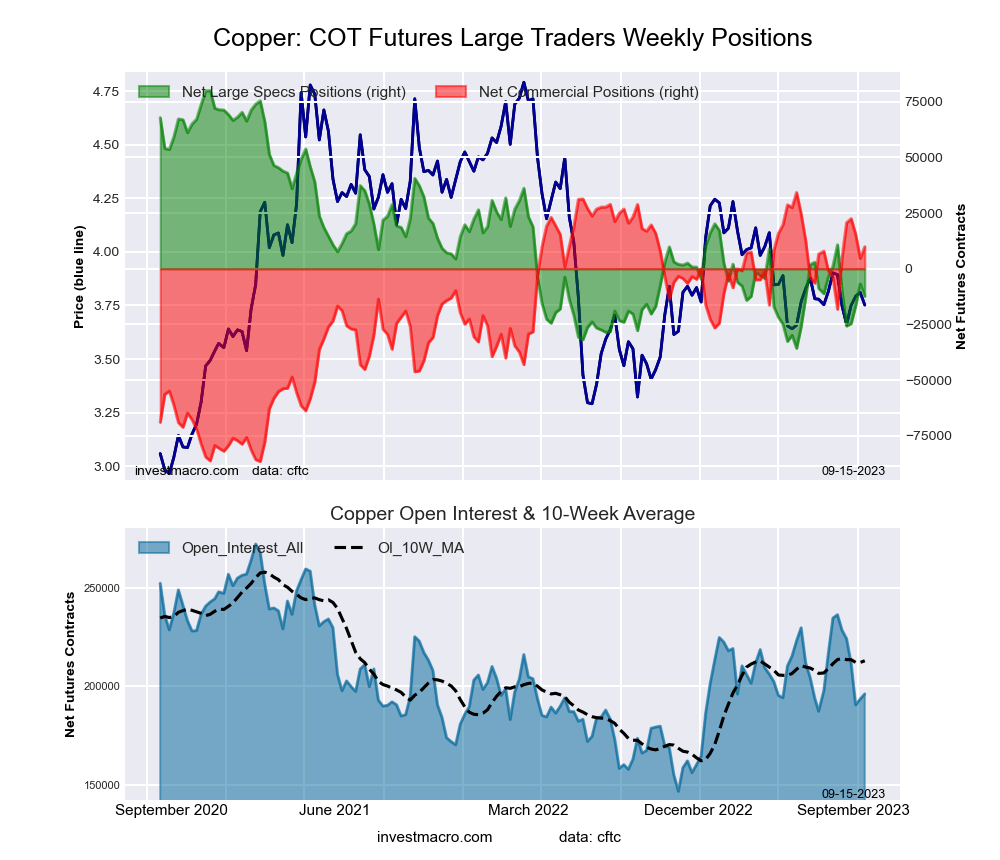 The Copper Grade #1 Futures large speculator standing this week came in at a net position of -12,334 contracts in the data reported through Tuesday. This was a weekly reduction of -5,564 contracts from the previous week which had a total of -6,770 net contracts.
This week’s current strength score (the trader positioning range over the past three years, measured from 0 to 100) shows the speculators are currently Bearish with a score of 20.2 percent. The commercials are Bullish with a score of 79.8 percent and the small traders (not shown in chart) are Bearish with a score of 33.9 percent.
Price Trend-Following Model: Weak Downtrend
Our weekly trend-following model classifies the current market price position as: Weak Downtrend. The current action for the model is considered to be: Hold – Maintain Short Position.
| Copper Futures Statistics | SPECULATORS | COMMERCIALS | SMALL TRADERS |
| – Percent of Open Interest Longs: | 34.3 | 39.0 | 8.2 |
| – Percent of Open Interest Shorts: | 40.6 | 34.0 | 6.9 |
| – Net Position: | -12,334 | 9,886 | 2,448 |
| – Gross Longs: | 67,333 | 76,561 | 16,045 |
| – Gross Shorts: | 79,667 | 66,675 | 13,597 |
| – Long to Short Ratio: | 0.8 to 1 | 1.1 to 1 | 1.2 to 1 |
| NET POSITION TREND: | |||
| – Strength Index Score (3 Year Range Pct): | 20.2 | 79.8 | 33.9 |
| – Strength Index Reading (3 Year Range): | Bearish | Bullish | Bearish |
| NET POSITION MOVEMENT INDEX: | |||
| – 6-Week Change in Strength Index: | -19.9 | 23.2 | -31.3 |
Platinum Futures:
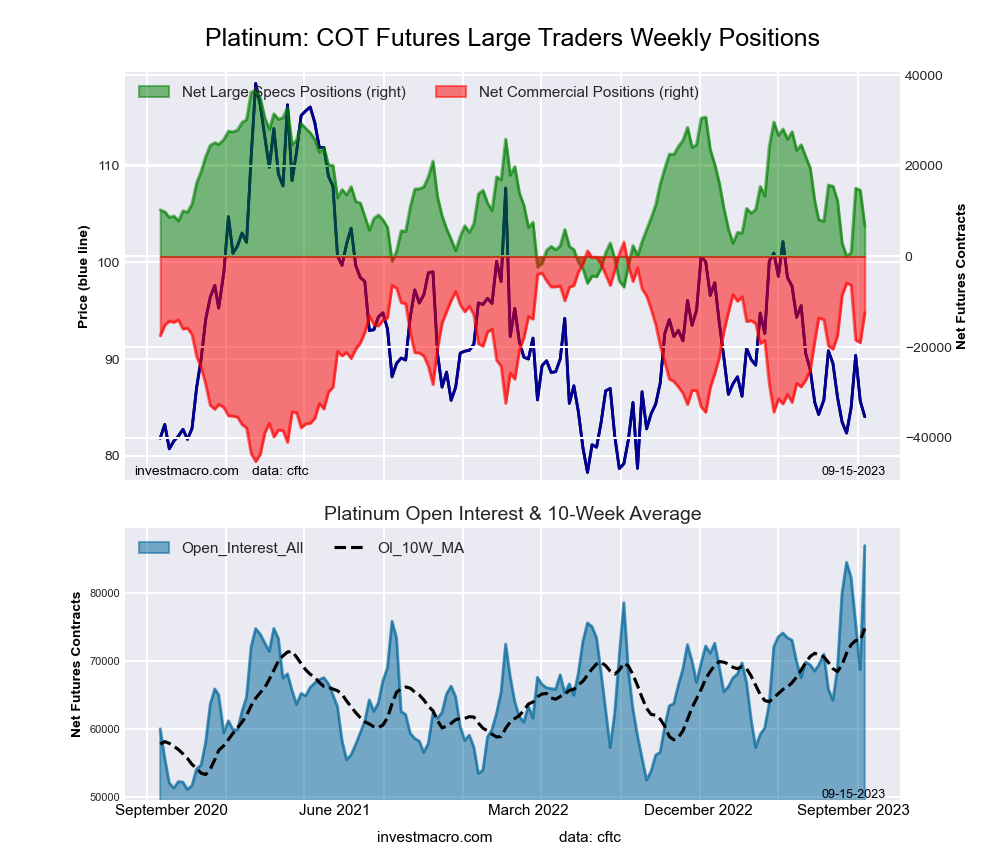 The Platinum Futures large speculator standing this week came in at a net position of 6,721 contracts in the data reported through Tuesday. This was a weekly decline of -7,881 contracts from the previous week which had a total of 14,602 net contracts.
This week’s current strength score (the trader positioning range over the past three years, measured from 0 to 100) shows the speculators are currently Bearish with a score of 31.1 percent. The commercials are Bullish with a score of 67.9 percent and the small traders (not shown in chart) are Bearish with a score of 44.0 percent.
Price Trend-Following Model: Downtrend
Our weekly trend-following model classifies the current market price position as: Downtrend. The current action for the model is considered to be: Hold – Maintain Short Position.
| Platinum Futures Statistics | SPECULATORS | COMMERCIALS | SMALL TRADERS |
| – Percent of Open Interest Longs: | 50.1 | 23.0 | 10.4 |
| – Percent of Open Interest Shorts: | 42.4 | 37.2 | 3.9 |
| – Net Position: | 6,721 | -12,396 | 5,675 |
| – Gross Longs: | 43,619 | 19,999 | 9,083 |
| – Gross Shorts: | 36,898 | 32,395 | 3,408 |
| – Long to Short Ratio: | 1.2 to 1 | 0.6 to 1 | 2.7 to 1 |
| NET POSITION TREND: | |||
| – Strength Index Score (3 Year Range Pct): | 31.1 | 67.9 | 44.0 |
| – Strength Index Reading (3 Year Range): | Bearish | Bullish | Bearish |
| NET POSITION MOVEMENT INDEX: | |||
| – 6-Week Change in Strength Index: | -12.9 | 10.5 | 6.7 |
Palladium Futures:
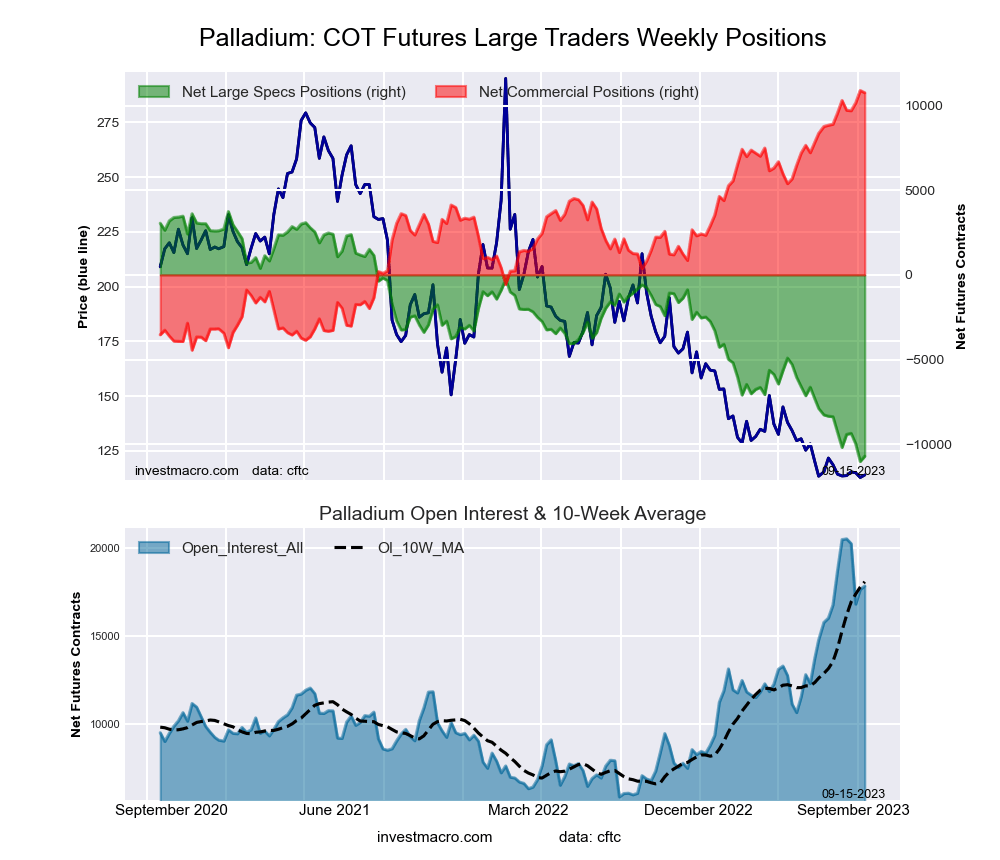 The Palladium Futures large speculator standing this week came in at a net position of -10,712 contracts in the data reported through Tuesday. This was a weekly gain of 309 contracts from the previous week which had a total of -11,021 net contracts.
This week’s current strength score (the trader positioning range over the past three years, measured from 0 to 100) shows the speculators are currently Bearish-Extreme with a score of 2.1 percent. The commercials are Bullish-Extreme with a score of 99.2 percent and the small traders (not shown in chart) are Bearish with a score of 38.8 percent.
Price Trend-Following Model: Downtrend
Our weekly trend-following model classifies the current market price position as: Downtrend. The current action for the model is considered to be: Hold – Maintain Short Position.
| Palladium Futures Statistics | SPECULATORS | COMMERCIALS | SMALL TRADERS |
| – Percent of Open Interest Longs: | 25.0 | 62.9 | 9.1 |
| – Percent of Open Interest Shorts: | 85.0 | 2.6 | 9.4 |
| – Net Position: | -10,712 | 10,761 | -49 |
| – Gross Longs: | 4,452 | 11,217 | 1,627 |
| – Gross Shorts: | 15,164 | 456 | 1,676 |
| – Long to Short Ratio: | 0.3 to 1 | 24.6 to 1 | 1.0 to 1 |
| NET POSITION TREND: | |||
| – Strength Index Score (3 Year Range Pct): | 2.1 | 99.2 | 38.8 |
| – Strength Index Reading (3 Year Range): | Bearish-Extreme | Bullish-Extreme | Bearish |
| NET POSITION MOVEMENT INDEX: | |||
| – 6-Week Change in Strength Index: | -9.6 | 7.9 | 12.6 |
Steel Futures Futures:
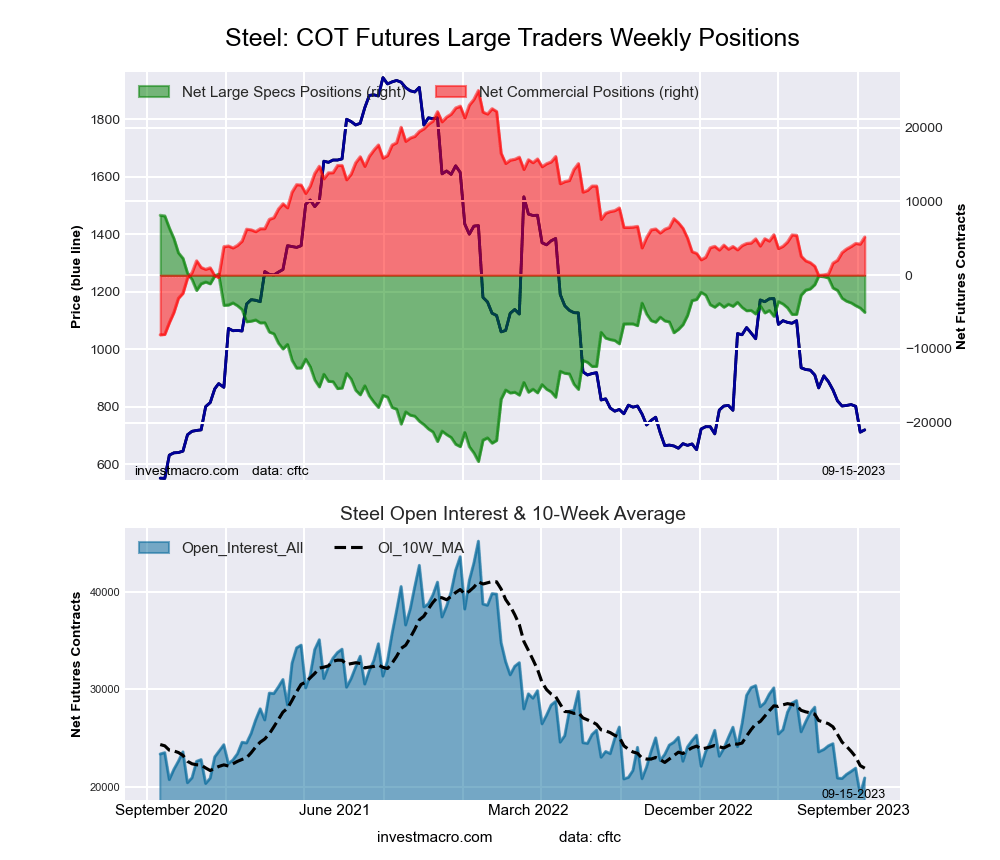 The Steel Futures large speculator standing this week came in at a net position of -5,030 contracts in the data reported through Tuesday. This was a weekly decrease of -588 contracts from the previous week which had a total of -4,442 net contracts.
This week’s current strength score (the trader positioning range over the past three years, measured from 0 to 100) shows the speculators are currently Bullish with a score of 60.6 percent. The commercials are Bearish with a score of 40.0 percent and the small traders (not shown in chart) are Bearish-Extreme with a score of 4.6 percent.
Price Trend-Following Model: Downtrend
Our weekly trend-following model classifies the current market price position as: Downtrend. The current action for the model is considered to be: Hold – Maintain Short Position.
| Steel Futures Statistics | SPECULATORS | COMMERCIALS | SMALL TRADERS |
| – Percent of Open Interest Longs: | 5.5 | 88.0 | 1.0 |
| – Percent of Open Interest Shorts: | 29.6 | 63.2 | 1.8 |
| – Net Position: | -5,030 | 5,182 | -152 |
| – Gross Longs: | 1,154 | 18,389 | 215 |
| – Gross Shorts: | 6,184 | 13,207 | 367 |
| – Long to Short Ratio: | 0.2 to 1 | 1.4 to 1 | 0.6 to 1 |
| NET POSITION TREND: | |||
| – Strength Index Score (3 Year Range Pct): | 60.6 | 40.0 | 4.6 |
| – Strength Index Reading (3 Year Range): | Bullish | Bearish | Bearish-Extreme |
| NET POSITION MOVEMENT INDEX: | |||
| – 6-Week Change in Strength Index: | -8.9 | 9.5 | -22.9 |
Article By InvestMacro – Receive our weekly COT Newsletter
*COT Report: The COT data, released weekly to the public each Friday, is updated through the most recent Tuesday (data is 3 days old) and shows a quick view of how large speculators or non-commercials (for-profit traders) were positioned in the futures markets.
The CFTC categorizes trader positions according to commercial hedgers (traders who use futures contracts for hedging as part of the business), non-commercials (large traders who speculate to realize trading profits) and nonreportable traders (usually small traders/speculators) as well as their open interest (contracts open in the market at time of reporting). See CFTC criteria here.

- The US introduces new import tariffs for 60 countries. Brent crude surpasses $100 per barrel Jul 24, 2026
- USD/JPY Breaks Records: Nothing Slows the Yen’s Decline Jul 24, 2026
- Oil prices reached a 6‑week high. The AUD strengthened on the back of a strong labor‑market report Jul 23, 2026
- EUR/USD Recovers as Dollar Weakens Jul 23, 2026
- Bitcoin rose to $66,000. The New Zealand dollar continues to strengthen Jul 22, 2026
- Inflationary pressure is easing in Canada. In New Zealand, on the contrary, inflation is rising Jul 21, 2026
- GBP/USD Falls After Cabinet Changes Jul 21, 2026
- Geopolitical and macroeconomic conditions continue to pressure market sentiment Jul 20, 2026
- USD/JPY Poised to Continue Gains as Expensive Oil and Lack of Support Weigh on Yen Jul 20, 2026
- COT Metals Charts: Weekly Speculator Bets led by Copper & Steel Jul 18, 2026