By InvestMacro
Here are the latest charts and statistics for the Commitment of Traders (COT) data published by the Commodities Futures Trading Commission (CFTC).
The latest COT data is updated through Tuesday January 31st and shows a quick view of how large traders (for-profit speculators and commercial entities) were positioned in the futures markets.
*** This data is almost a month old because the CFTC up-to-date data has been delayed due to a cybersecurity event that happened in early February to ION Cleared Derivatives (a subsidiary of ION Markets). This hack of ION has created a problem for the large trader positions to be reported and reconciled. The CFTC states that they will be back-filling the data over the next couple weeks and will get the data back up to date.
Free Reports:
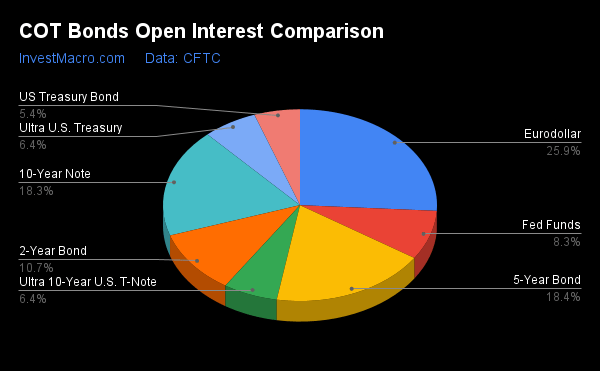
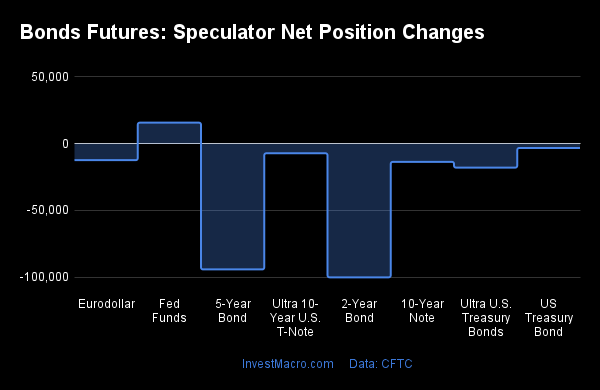
The COT bond market speculator bets were sharply lower for that week as just one out of the eight bond markets we cover had higher positioning while the other seven markets had lower speculator contracts.
Leading the gains for the bond markets was the Fed Funds with a gain of 15,702 contracts.
The bond markets with declines in speculator bets for the week were the 2-Year Bonds (-100,142 contracts), the 5-Year Bonds (-94,219 contracts), Ultra Treasury Bonds (-17,997 contracts), Ultra 10-Year Bonds (-7,222 contracts), US Treasury Bonds (-3,260 contracts), the Eurodollar (-12,402 contracts) and the 10-Year Bonds (-13,650 contracts) also registering lower bets through January 31st.
| Jan-31-2023 | OI | OI-Index | Spec-Net | Spec-Index | Com-Net | COM-Index | Smalls-Net | Smalls-Index |
|---|---|---|---|---|---|---|---|---|
| Eurodollar | 5,879,918 | 0 | -1,026,275 | 34 | 1,226,679 | 63 | -200,404 | 60 |
| FedFunds | 1,889,652 | 79 | -20,128 | 37 | 50,487 | 66 | -30,359 | 0 |
| 2-Year | 2,428,703 | 29 | -577,165 | 1 | 552,882 | 94 | 24,283 | 63 |
| Long T-Bond | 1,226,430 | 48 | -199,076 | 20 | 172,835 | 72 | 26,241 | 73 |
| 10-Year | 4,151,853 | 75 | -555,471 | 0 | 623,943 | 96 | -68,472 | 64 |
| 5-Year | 4,177,919 | 61 | -732,956 | 0 | 722,945 | 94 | 10,011 | 84 |
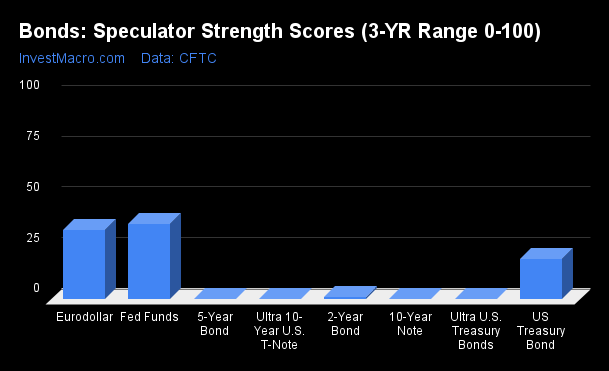
COT Strength Scores (a normalized measure of Speculator positions over a 3-Year range, from 0 to 100 where above 80 is Extreme-Bullish and below 20 is Extreme-Bearish) showed that the Fed Funds (37 percent) and the Eurodollar (34 percent) led the bond markets for that week. The US Treasury Bonds (20 percent) came in as the next highest in the weekly strength scores.
On the downside, the Ultra Treasury Bonds (0 percent), 5-Year Bonds (0 percent), Ultra 10-Year Bonds (0 percent), 10-Year Bond (0.0 percent), 2-Year Bond (1.4 percent) and the US Treasury Bond (19.8 percent) came in with the lowest strength levels and all were in Extreme-Bearish territory (below 20 percent).
Strength Statistics:
Fed Funds (37.1 percent) vs Fed Funds previous week (35.2 percent)
2-Year Bond (1.4 percent) vs 2-Year Bond previous week (16.2 percent)
5-Year Bond (0.0 percent) vs 5-Year Bond previous week (11.4 percent)
10-Year Bond (0.0 percent) vs 10-Year Bond previous week (1.9 percent)
Ultra 10-Year Bond (0.0 percent) vs Ultra 10-Year Bond previous week (1.8 percent)
US Treasury Bond (19.8 percent) vs US Treasury Bond previous week (20.9 percent)
Ultra US Treasury Bond (0.0 percent) vs Ultra US Treasury Bond previous week (8.0 percent)
Eurodollar (34.3 percent) vs Eurodollar previous week (34.5 percent)
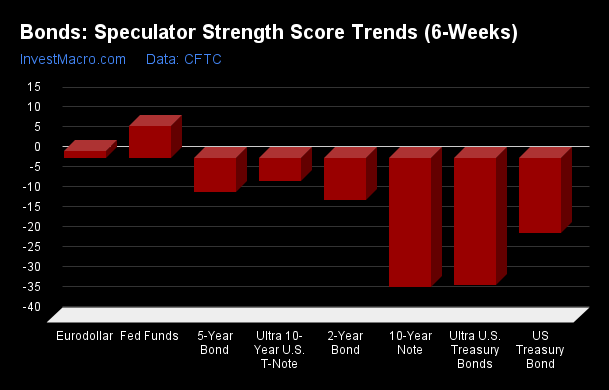
COT Strength Score Trends (or move index, calculates the 6-week changes in strength scores) showed that the Fed Funds (8 percent) and the Eurodollar (2 percent) led the past six weeks trends for bonds.
The Ultra Treasury Bonds (-32 percent) led the downside trend scores with the 10-Year Bonds (-32 percent) and the US Treasury Bonds (-19 percent) following next with lower trend scores.
Strength Trend Statistics:
Fed Funds (8.1 percent) vs Fed Funds previous week (4.7 percent)
2-Year Bond (-10.5 percent) vs 2-Year Bond previous week (6.6 percent)
5-Year Bond (-8.5 percent) vs 5-Year Bond previous week (6.4 percent)
10-Year Bond (-32.4 percent) vs 10-Year Bond previous week (-22.4 percent)
Ultra 10-Year Bond (-5.8 percent) vs Ultra 10-Year Bond previous week (-6.0 percent)
US Treasury Bond (-18.8 percent) vs US Treasury Bond previous week (-25.7 percent)
Ultra US Treasury Bond (-31.9 percent) vs Ultra US Treasury Bond previous week (-21.5 percent)
Eurodollar (1.6 percent) vs Eurodollar previous week (11.1 percent)
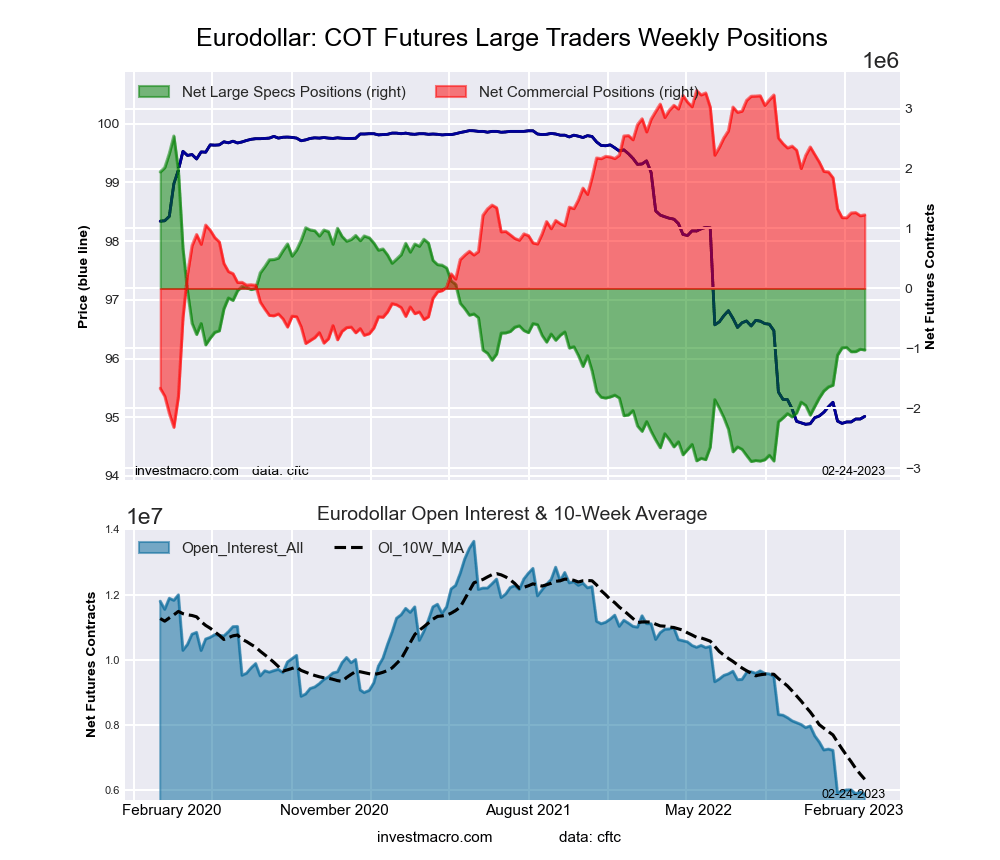
This week’s current strength score (the trader positioning range over the past three years, measured from 0 to 100) shows the speculators are currently Bearish with a score of 34.3 percent. The commercials are Bullish with a score of 63.1 percent and the small traders (not shown in chart) are Bullish with a score of 60.4 percent.
| 3-Month Eurodollars Statistics | SPECULATORS | COMMERCIALS | SMALL TRADERS |
| – Percent of Open Interest Longs: | 8.2 | 68.4 | 4.9 |
| – Percent of Open Interest Shorts: | 25.6 | 47.6 | 8.3 |
| – Net Position: | -1,026,275 | 1,226,679 | -200,404 |
| – Gross Longs: | 480,357 | 4,023,635 | 289,015 |
| – Gross Shorts: | 1,506,632 | 2,796,956 | 489,419 |
| – Long to Short Ratio: | 0.3 to 1 | 1.4 to 1 | 0.6 to 1 |
| NET POSITION TREND: | |||
| – Strength Index Score (3 Year Range Pct): | 34.3 | 63.1 | 60.4 |
| – Strength Index Reading (3 Year Range): | Bearish | Bullish | Bullish |
| NET POSITION MOVEMENT INDEX: | |||
| – 6-Week Change in Strength Index: | 1.6 | -1.8 | 3.7 |
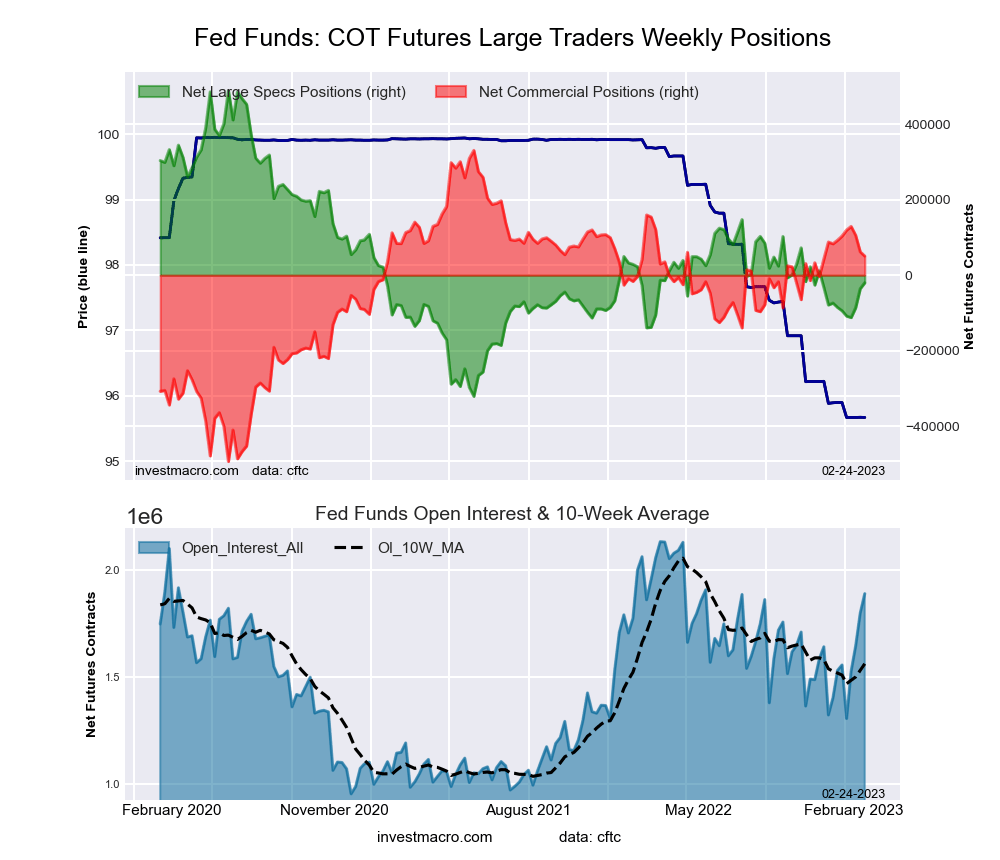
This week’s current strength score (the trader positioning range over the past three years, measured from 0 to 100) shows the speculators are currently Bearish with a score of 37.1 percent. The commercials are Bullish with a score of 66.0 percent and the small traders (not shown in chart) are Bearish-Extreme with a score of 0.0 percent.
| 30-Day Federal Funds Statistics | SPECULATORS | COMMERCIALS | SMALL TRADERS |
| – Percent of Open Interest Longs: | 9.8 | 75.9 | 1.8 |
| – Percent of Open Interest Shorts: | 10.9 | 73.3 | 3.4 |
| – Net Position: | -20,128 | 50,487 | -30,359 |
| – Gross Longs: | 185,358 | 1,435,042 | 34,298 |
| – Gross Shorts: | 205,486 | 1,384,555 | 64,657 |
| – Long to Short Ratio: | 0.9 to 1 | 1.0 to 1 | 0.5 to 1 |
| NET POSITION TREND: | |||
| – Strength Index Score (3 Year Range Pct): | 37.1 | 66.0 | 0.0 |
| – Strength Index Reading (3 Year Range): | Bearish | Bullish | Bearish-Extreme |
| NET POSITION MOVEMENT INDEX: | |||
| – 6-Week Change in Strength Index: | 8.1 | -5.1 | -55.8 |
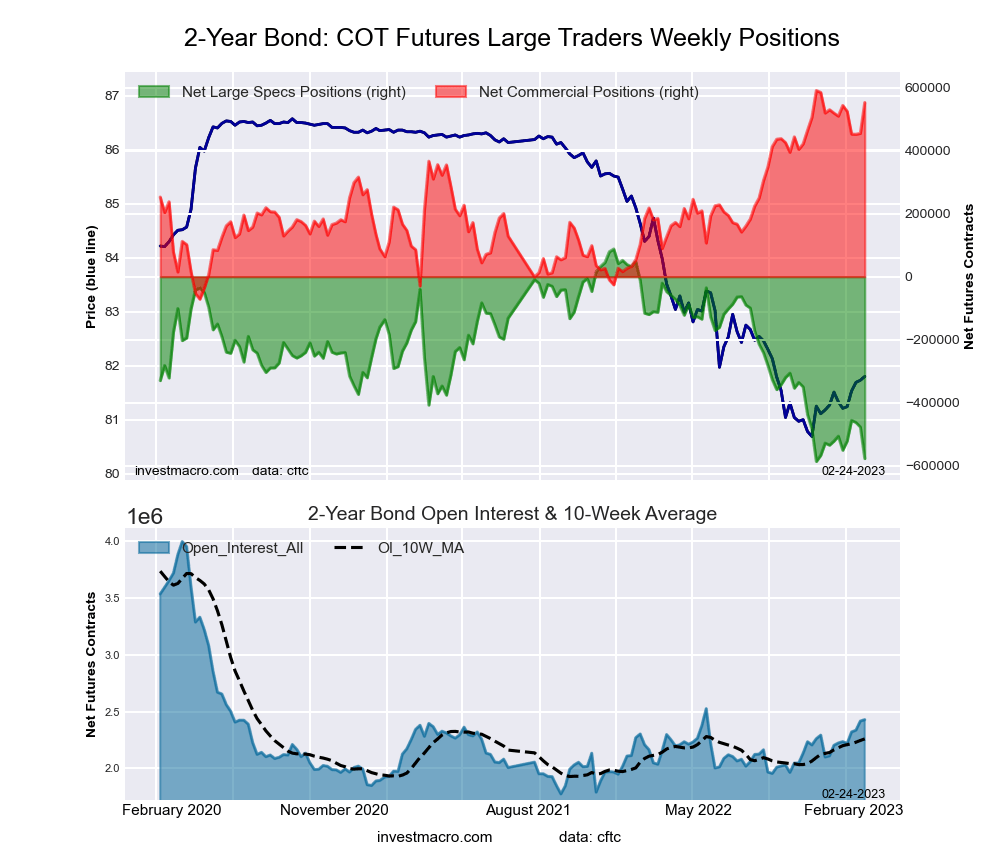
This week’s current strength score (the trader positioning range over the past three years, measured from 0 to 100) shows the speculators are currently Bearish-Extreme with a score of 1.4 percent. The commercials are Bullish-Extreme with a score of 94.3 percent and the small traders (not shown in chart) are Bullish with a score of 62.9 percent.
| 2-Year Treasury Note Statistics | SPECULATORS | COMMERCIALS | SMALL TRADERS |
| – Percent of Open Interest Longs: | 6.7 | 83.5 | 8.2 |
| – Percent of Open Interest Shorts: | 30.5 | 60.7 | 7.2 |
| – Net Position: | -577,165 | 552,882 | 24,283 |
| – Gross Longs: | 163,860 | 2,027,636 | 198,658 |
| – Gross Shorts: | 741,025 | 1,474,754 | 174,375 |
| – Long to Short Ratio: | 0.2 to 1 | 1.4 to 1 | 1.1 to 1 |
| NET POSITION TREND: | |||
| – Strength Index Score (3 Year Range Pct): | 1.4 | 94.3 | 62.9 |
| – Strength Index Reading (3 Year Range): | Bearish-Extreme | Bullish-Extreme | Bullish |
| NET POSITION MOVEMENT INDEX: | |||
| – 6-Week Change in Strength Index: | -10.5 | 6.6 | 12.4 |
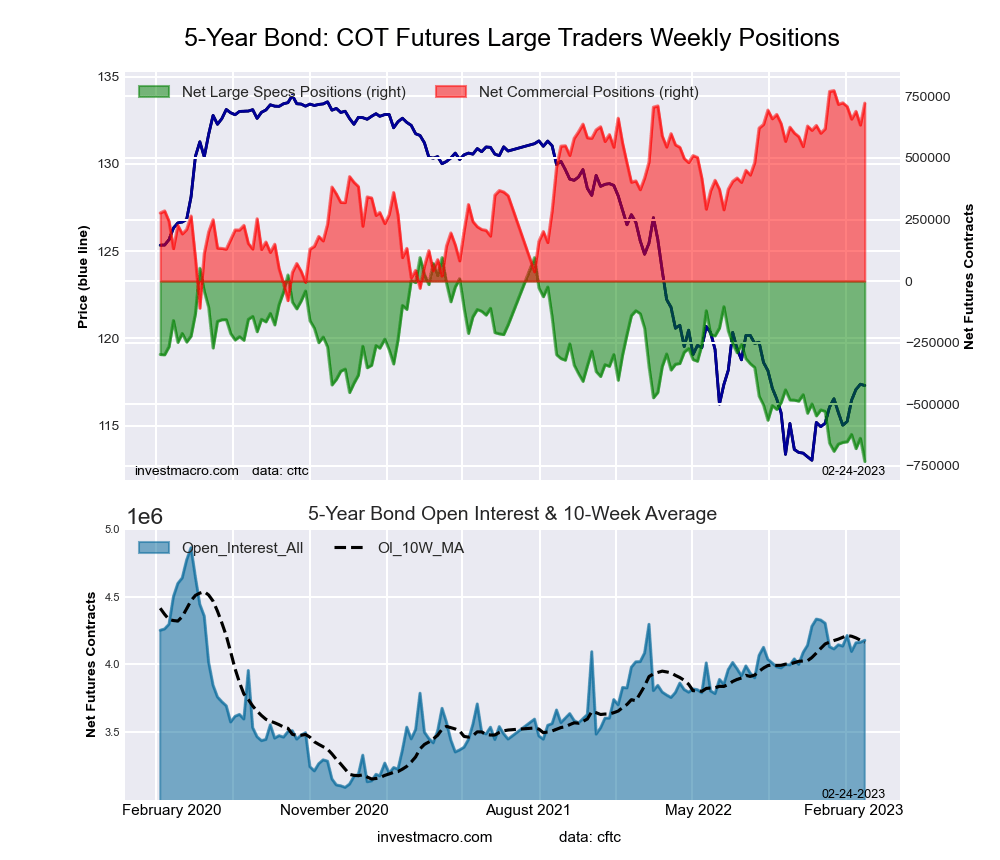
This week’s current strength score (the trader positioning range over the past three years, measured from 0 to 100) shows the speculators are currently Bearish-Extreme with a score of 0.0 percent. The commercials are Bullish-Extreme with a score of 94.2 percent and the small traders (not shown in chart) are Bullish-Extreme with a score of 83.8 percent.
| 5-Year Treasury Note Statistics | SPECULATORS | COMMERCIALS | SMALL TRADERS |
| – Percent of Open Interest Longs: | 5.4 | 84.7 | 8.1 |
| – Percent of Open Interest Shorts: | 22.9 | 67.4 | 7.9 |
| – Net Position: | -732,956 | 722,945 | 10,011 |
| – Gross Longs: | 224,985 | 3,538,717 | 340,298 |
| – Gross Shorts: | 957,941 | 2,815,772 | 330,287 |
| – Long to Short Ratio: | 0.2 to 1 | 1.3 to 1 | 1.0 to 1 |
| NET POSITION TREND: | |||
| – Strength Index Score (3 Year Range Pct): | 0.0 | 94.2 | 83.8 |
| – Strength Index Reading (3 Year Range): | Bearish-Extreme | Bullish-Extreme | Bullish-Extreme |
| NET POSITION MOVEMENT INDEX: | |||
| – 6-Week Change in Strength Index: | -8.5 | 0.6 | 17.9 |
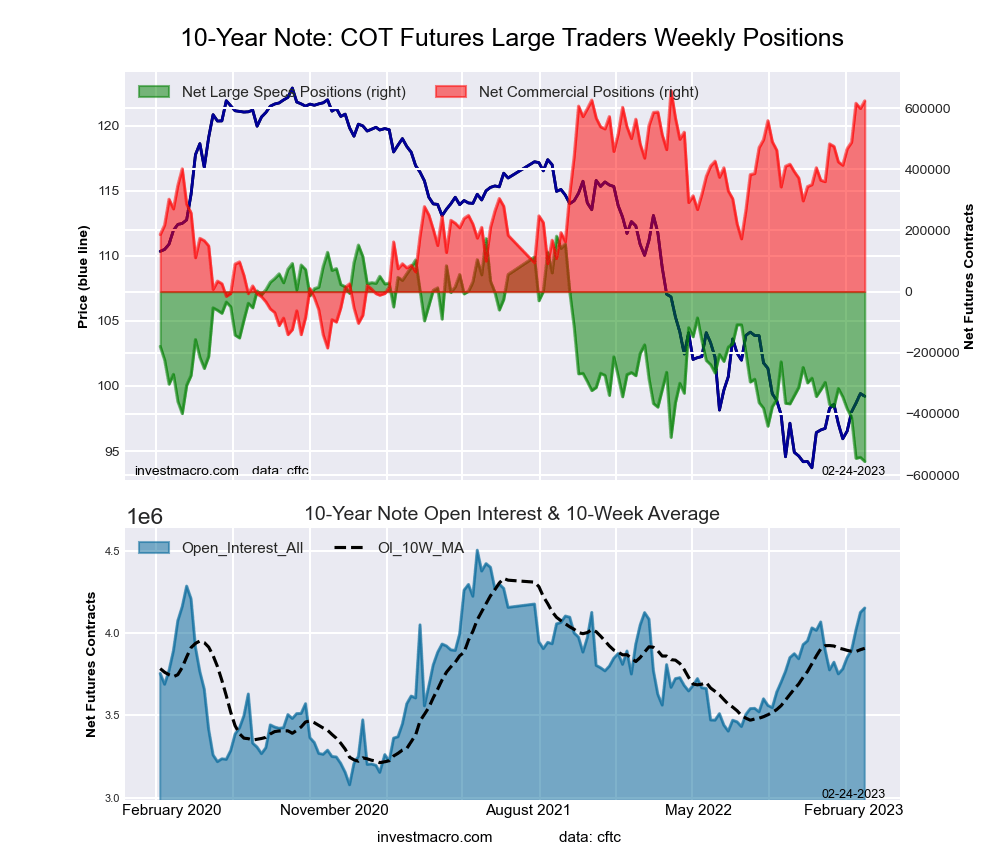
This week’s current strength score (the trader positioning range over the past three years, measured from 0 to 100) shows the speculators are currently Bearish-Extreme with a score of 0.0 percent. The commercials are Bullish-Extreme with a score of 96.0 percent and the small traders (not shown in chart) are Bullish with a score of 63.8 percent.
| 10-Year Treasury Note Statistics | SPECULATORS | COMMERCIALS | SMALL TRADERS |
| – Percent of Open Interest Longs: | 8.9 | 79.8 | 8.4 |
| – Percent of Open Interest Shorts: | 22.2 | 64.8 | 10.1 |
| – Net Position: | -555,471 | 623,943 | -68,472 |
| – Gross Longs: | 367,733 | 3,313,634 | 349,227 |
| – Gross Shorts: | 923,204 | 2,689,691 | 417,699 |
| – Long to Short Ratio: | 0.4 to 1 | 1.2 to 1 | 0.8 to 1 |
| NET POSITION TREND: | |||
| – Strength Index Score (3 Year Range Pct): | 0.0 | 96.0 | 63.8 |
| – Strength Index Reading (3 Year Range): | Bearish-Extreme | Bullish-Extreme | Bullish |
| NET POSITION MOVEMENT INDEX: | |||
| – 6-Week Change in Strength Index: | -32.4 | 23.7 | 9.2 |
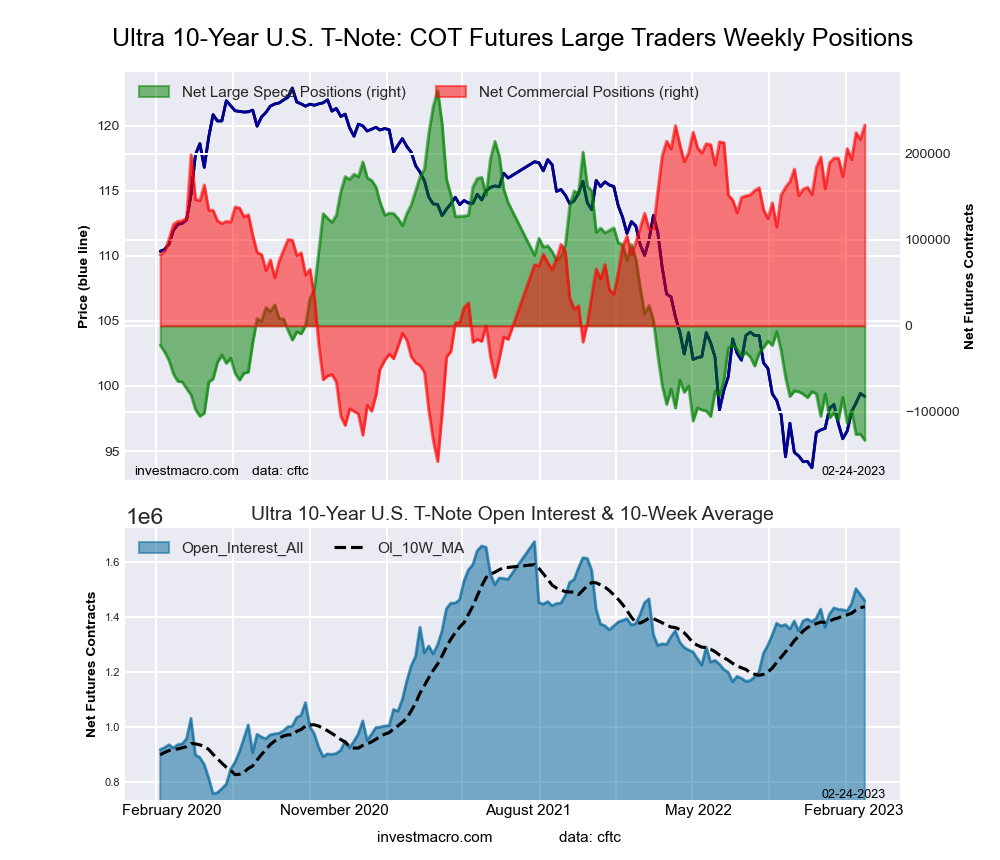
This week’s current strength score (the trader positioning range over the past three years, measured from 0 to 100) shows the speculators are currently Bearish-Extreme with a score of 0.0 percent. The commercials are Bullish-Extreme with a score of 100.0 percent and the small traders (not shown in chart) are Bullish with a score of 60.5 percent.
| Ultra 10-Year Notes Statistics | SPECULATORS | COMMERCIALS | SMALL TRADERS |
| – Percent of Open Interest Longs: | 10.2 | 78.4 | 10.4 |
| – Percent of Open Interest Shorts: | 19.3 | 62.4 | 17.3 |
| – Net Position: | -133,133 | 233,431 | -100,298 |
| – Gross Longs: | 148,741 | 1,144,072 | 152,412 |
| – Gross Shorts: | 281,874 | 910,641 | 252,710 |
| – Long to Short Ratio: | 0.5 to 1 | 1.3 to 1 | 0.6 to 1 |
| NET POSITION TREND: | |||
| – Strength Index Score (3 Year Range Pct): | 0.0 | 100.0 | 60.5 |
| – Strength Index Reading (3 Year Range): | Bearish-Extreme | Bullish-Extreme | Bullish |
| NET POSITION MOVEMENT INDEX: | |||
| – 6-Week Change in Strength Index: | -5.8 | 9.8 | -9.9 |
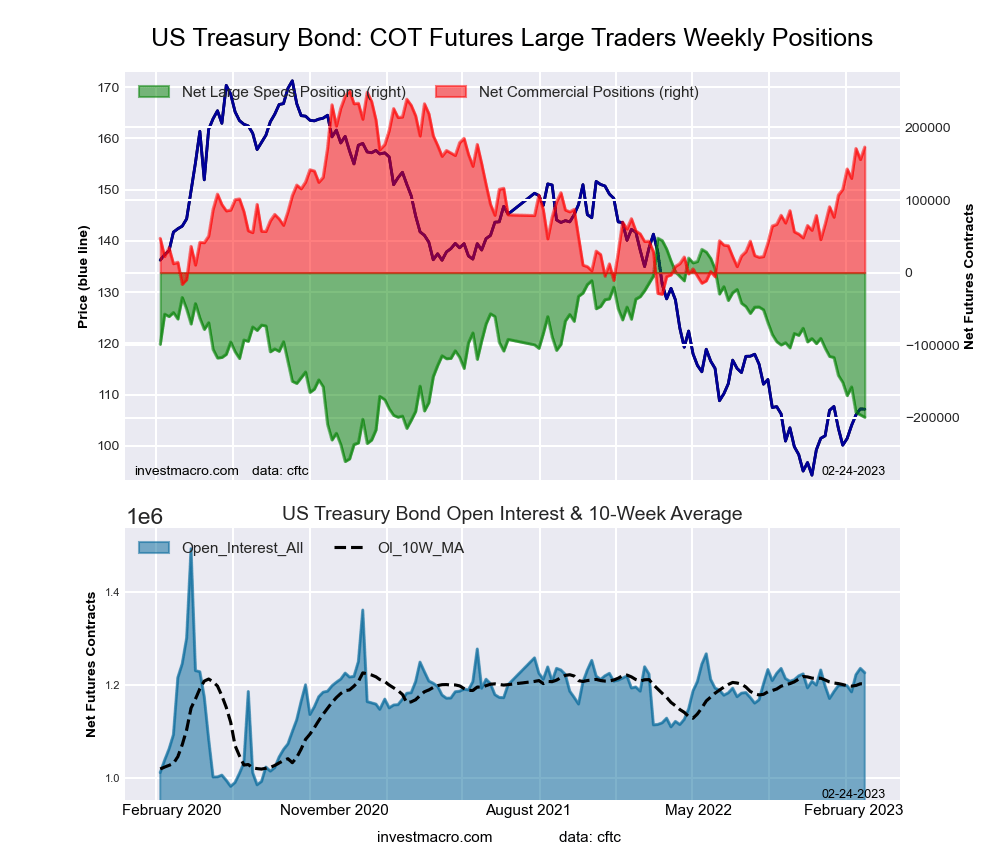
This week’s current strength score (the trader positioning range over the past three years, measured from 0 to 100) shows the speculators are currently Bearish-Extreme with a score of 19.8 percent. The commercials are Bullish with a score of 72.2 percent and the small traders (not shown in chart) are Bullish with a score of 73.4 percent.
| US Treasury Bonds Statistics | SPECULATORS | COMMERCIALS | SMALL TRADERS |
| – Percent of Open Interest Longs: | 4.8 | 80.3 | 14.1 |
| – Percent of Open Interest Shorts: | 21.0 | 66.2 | 11.9 |
| – Net Position: | -199,076 | 172,835 | 26,241 |
| – Gross Longs: | 58,575 | 984,869 | 172,662 |
| – Gross Shorts: | 257,651 | 812,034 | 146,421 |
| – Long to Short Ratio: | 0.2 to 1 | 1.2 to 1 | 1.2 to 1 |
| NET POSITION TREND: | |||
| – Strength Index Score (3 Year Range Pct): | 19.8 | 72.2 | 73.4 |
| – Strength Index Reading (3 Year Range): | Bearish-Extreme | Bullish | Bullish |
| NET POSITION MOVEMENT INDEX: | |||
| – 6-Week Change in Strength Index: | -18.8 | 23.6 | -6.7 |
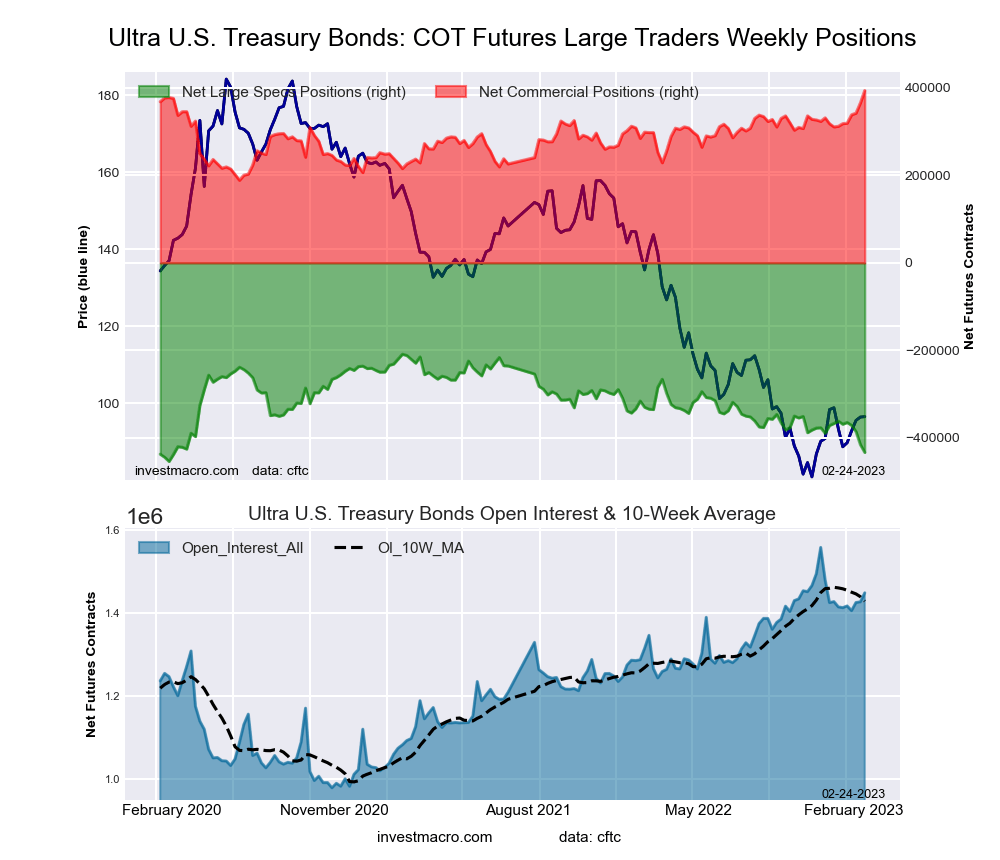
This week’s current strength score (the trader positioning range over the past three years, measured from 0 to 100) shows the speculators are currently Bearish-Extreme with a score of 0.0 percent. The commercials are Bullish-Extreme with a score of 100.0 percent and the small traders (not shown in chart) are Bullish with a score of 66.0 percent.
| Ultra US Treasury Bonds Statistics | SPECULATORS | COMMERCIALS | SMALL TRADERS |
| – Percent of Open Interest Longs: | 3.4 | 85.2 | 11.2 |
| – Percent of Open Interest Shorts: | 33.3 | 58.0 | 8.5 |
| – Net Position: | -433,360 | 393,878 | 39,482 |
| – Gross Longs: | 48,954 | 1,234,463 | 162,321 |
| – Gross Shorts: | 482,314 | 840,585 | 122,839 |
| – Long to Short Ratio: | 0.1 to 1 | 1.5 to 1 | 1.3 to 1 |
| NET POSITION TREND: | |||
| – Strength Index Score (3 Year Range Pct): | 0.0 | 100.0 | 66.0 |
| – Strength Index Reading (3 Year Range): | Bearish-Extreme | Bullish-Extreme | Bullish |
| NET POSITION MOVEMENT INDEX: | |||
| – 6-Week Change in Strength Index: | -31.9 | 39.8 | -8.5 |
Article By InvestMacro – Receive our weekly COT Newsletter
*COT Report: The COT data, released weekly to the public each Friday, is updated through the most recent Tuesday (data is 3 days old) and shows a quick view of how large speculators or non-commercials (for-profit traders) were positioned in the futures markets.
The CFTC categorizes trader positions according to commercial hedgers (traders who use futures contracts for hedging as part of the business), non-commercials (large traders who speculate to realize trading profits) and nonreportable traders (usually small traders/speculators) as well as their open interest (contracts open in the market at time of reporting). See CFTC criteria here.
By JustMarkets The US stock indices ended Friday’s session in the red. By the end…
By Analytical Department RoboForex USD/JPY opens the week at 162.36 on Monday. The Japanese yen…
By InvestMacro Here are the latest charts and statistics for the Commitment of Traders (COT)…
By InvestMacro The latest update for the weekly Commitment of Traders (COT) report was released…
By InvestMacro Here are the latest charts and statistics for the Commitment of Traders (COT)…
By InvestMacro Here are the latest charts and statistics for the Commitment of Traders (COT)…
This website uses cookies.