By InvestMacro
Here are the latest charts and statistics for the Commitment of Traders (COT) reports data published by the Commodities Futures Trading Commission (CFTC).
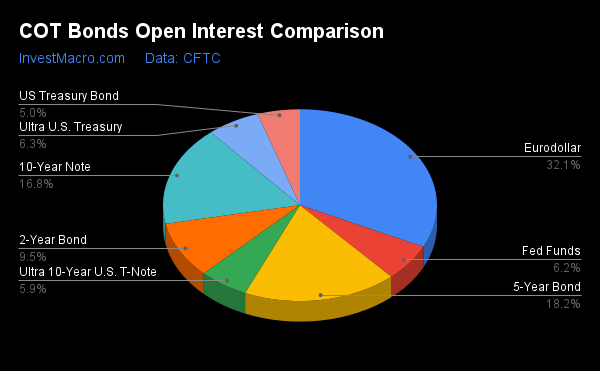
The latest COT data is updated through Tuesday November 15th and shows a quick view of how large traders (for-profit speculators and commercial hedgers) were positioned in the futures markets.
The COT bond market speculator bets were lower overall this week as just two out of the eight bond markets we cover had higher positioning this week while six other markets had lower contracts.
Free Reports:
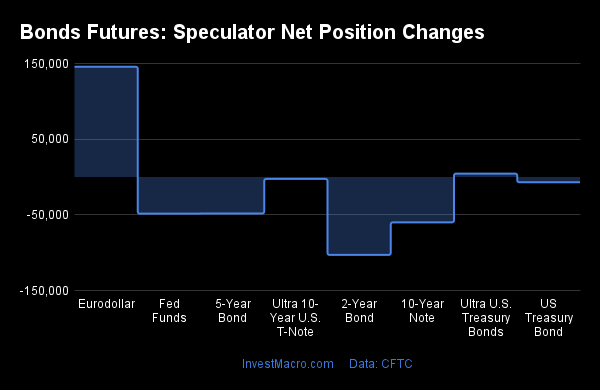
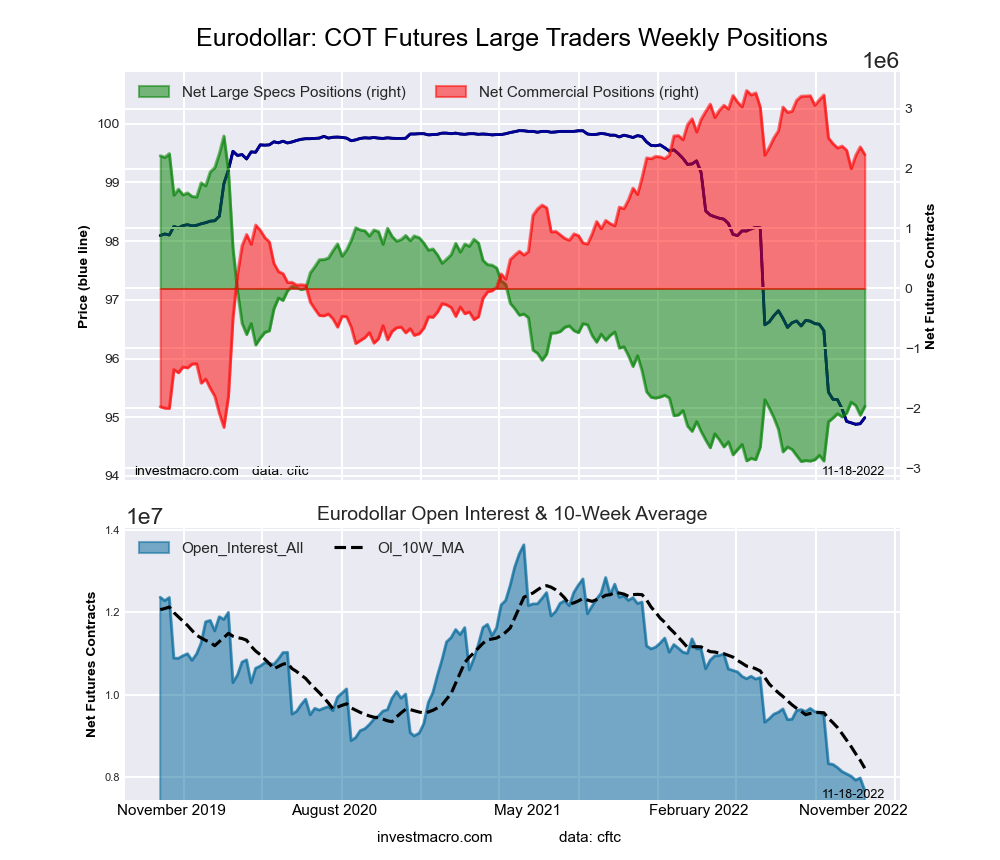
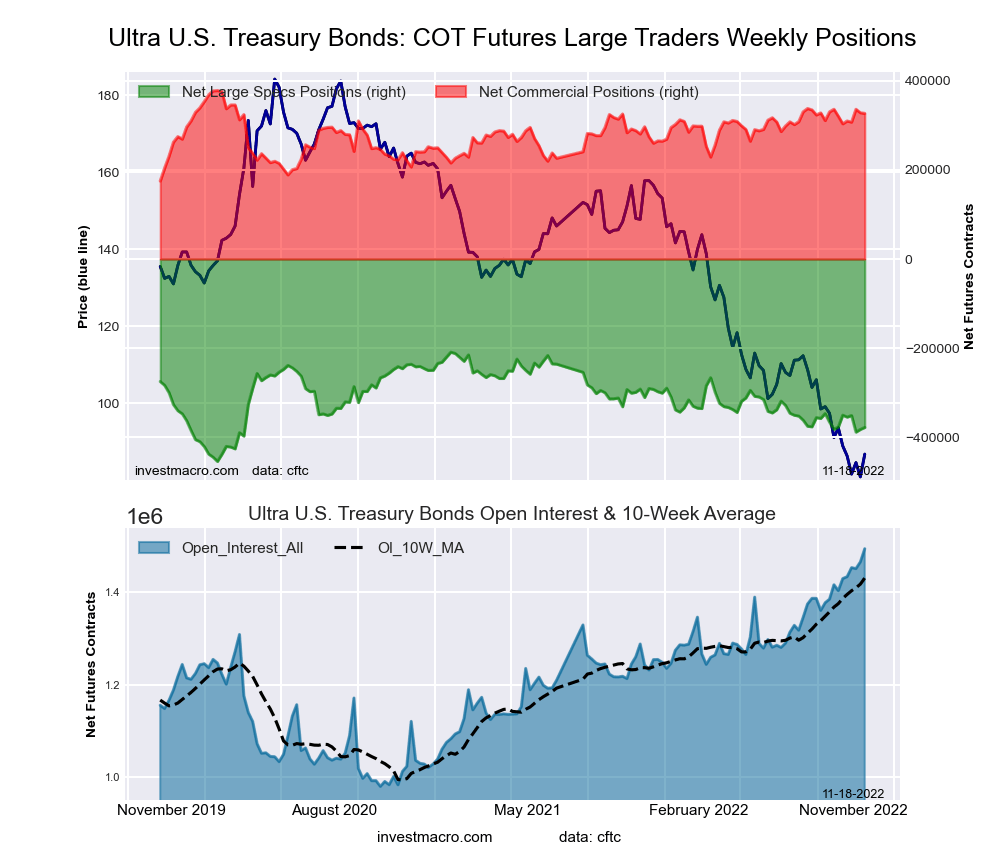
Leading the weekly gains for the bond markets was the Eurodollar (145,719 contracts) with the Ultra US Bond (4,465 contracts) also showing a positive week.
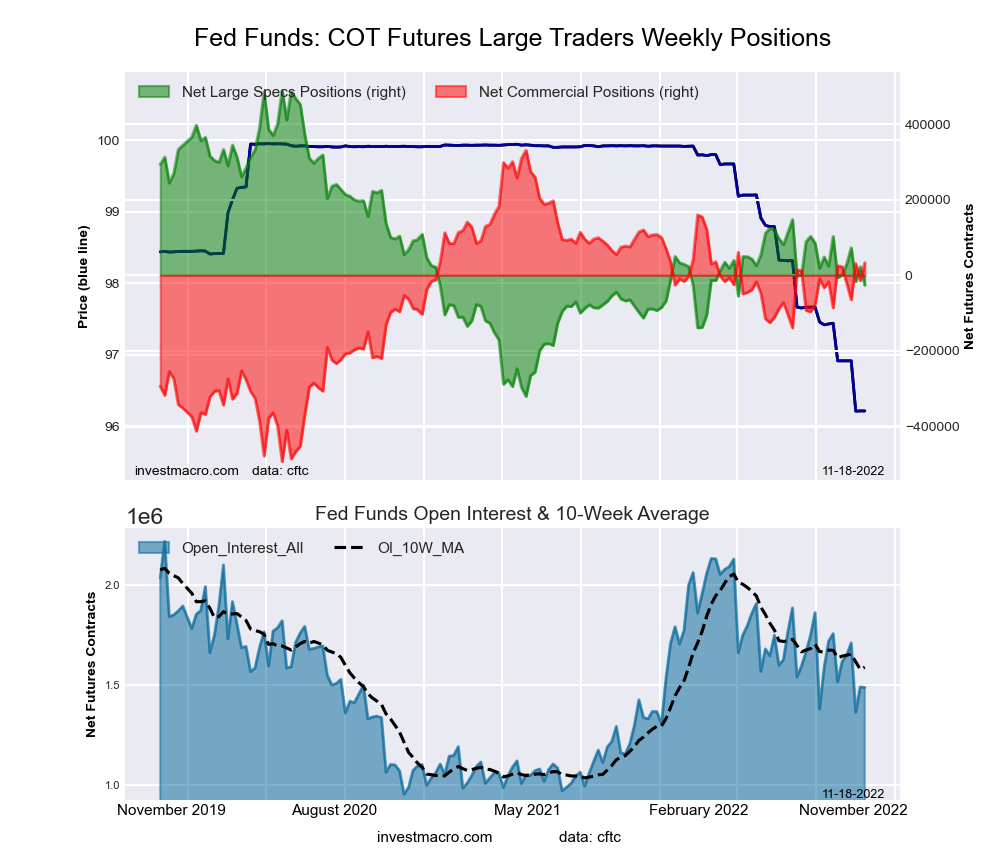
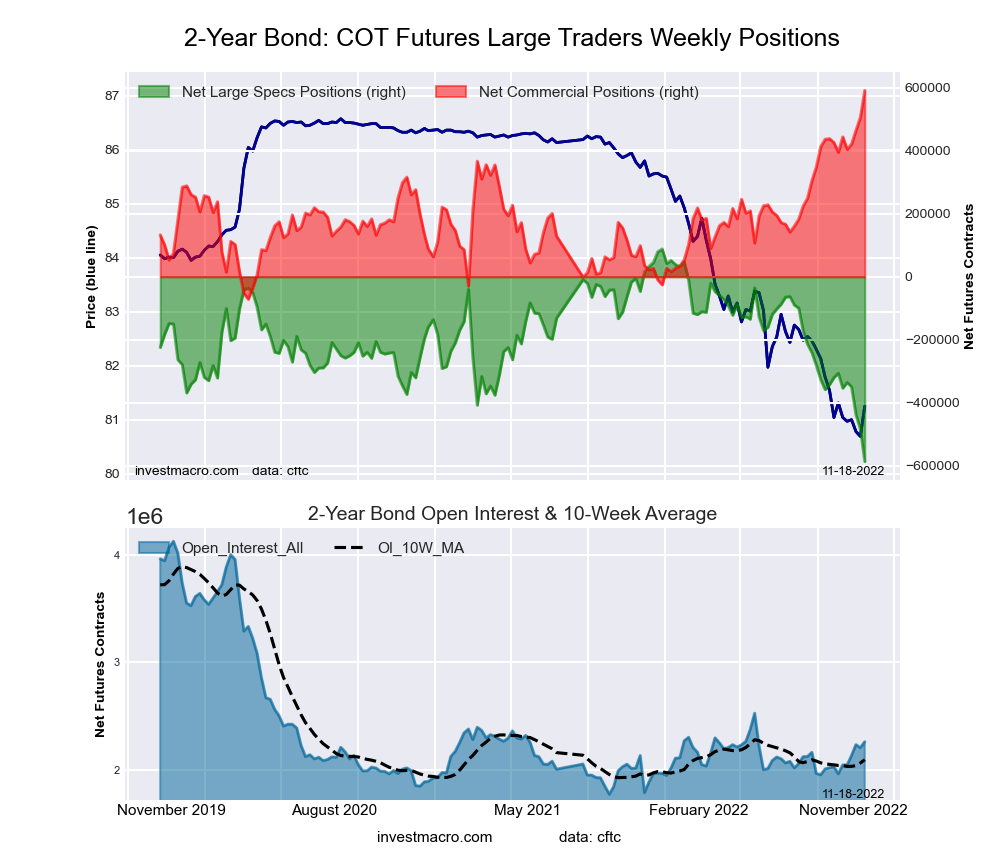
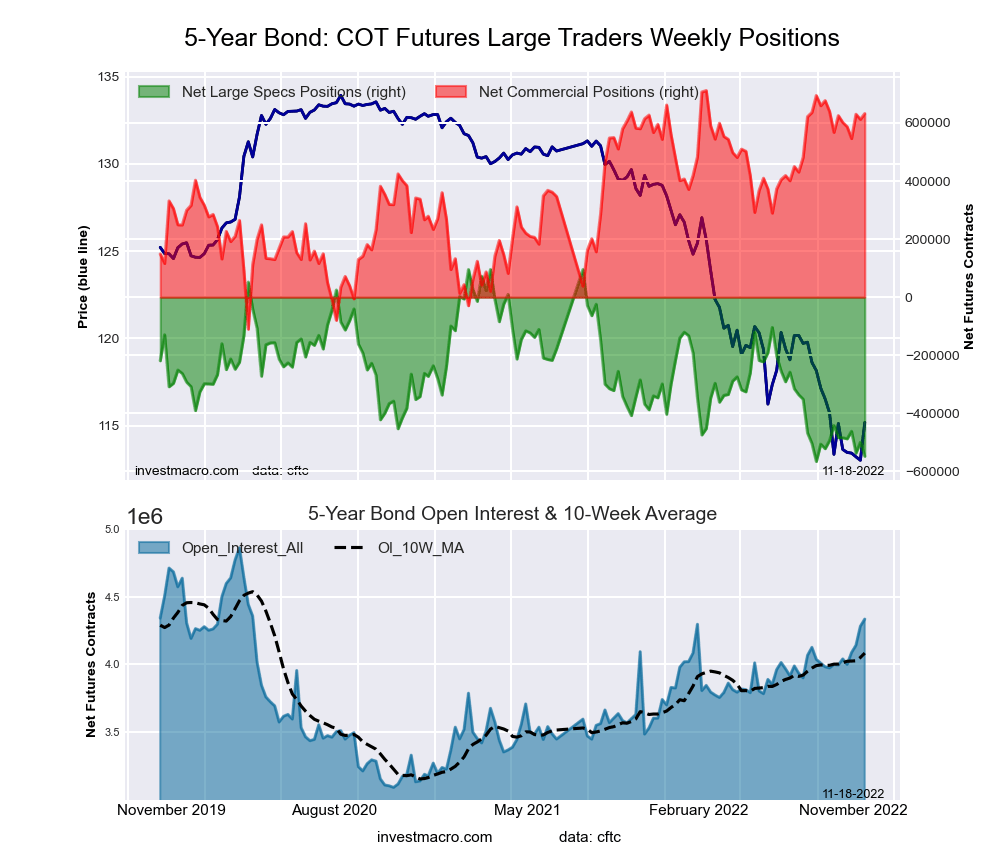
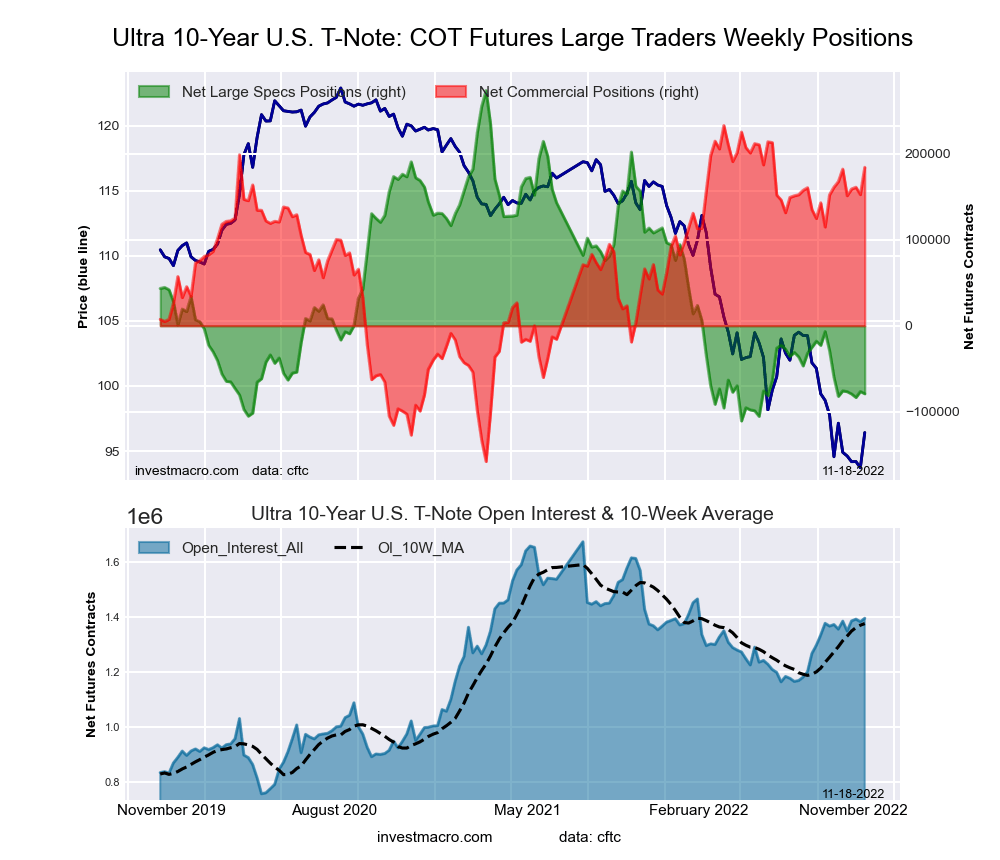
The bond markets leading the weekly declines in speculator bets this week was the 2-Year Bond (-102,997 contracts) with the 10-Year Bond (-59,962 contracts), the Fed Funds (-48,469 contracts), the 5-Year Bond (-48,163 contracts), the Long US Bond (-6,956 contracts) and the Ultra 10-Year (-2,545 contracts) also registering lower bets on the week.
Highlighting the COT bonds data this week is the 2-Year Bond position that continues to see the bearish bets pile up. Large speculators sharply added to their bearish positioning this week by a total of -102,997 contracts and marking the largest one-week bearish gain since February. Overall, bearish bets have risen for the past four straight weeks and for five out of the past six weeks. The bearish position has now risen by a total of -250,758 contracts over just the past four weeks.
This continued weakness for the 2-Year has pushed the overall net position standing to the lowest on record for a third straight week with this week’s standing totaling -586,270 contracts, according to CFTC data going back to 1990.
The 2-Year Bond futures price has continued to be in a steep downtrend but has trended a bit higher in the past week off its recent low touched on November 4th at 101.19.
| Nov-15-2022 | OI | OI-Index | Spec-Net | Spec-Index | Com-Net | COM-Index | Smalls-Net | Smalls-Index |
|---|---|---|---|---|---|---|---|---|
| Eurodollar | 7,670,696 | 0 | -1,966,931 | 17 | 2,232,777 | 81 | -265,846 | 46 |
| FedFunds | 1,488,043 | 42 | -26,285 | 36 | 32,822 | 64 | -6,537 | 43 |
| 2-Year | 2,261,042 | 22 | -586,270 | 0 | 590,806 | 100 | -4,536 | 50 |
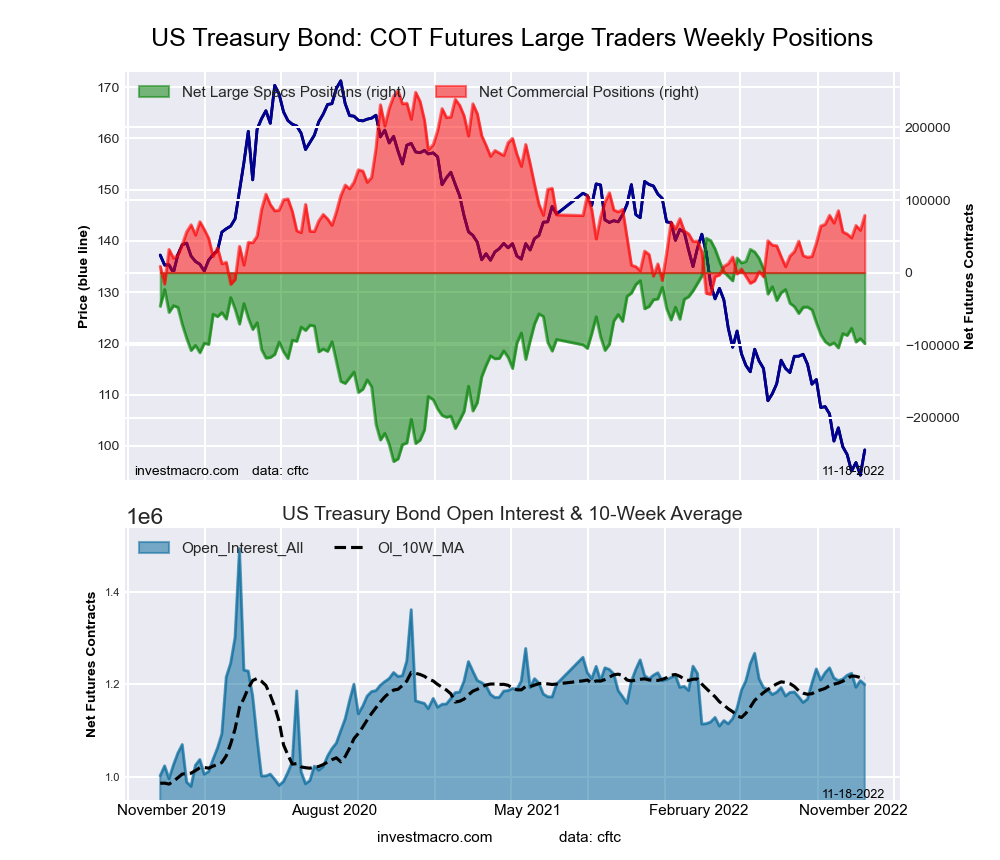
| Long T-Bond | 1,199,687 | 43 | -97,681 | 53 | 78,745 | 39 | 18,936 | 68 |
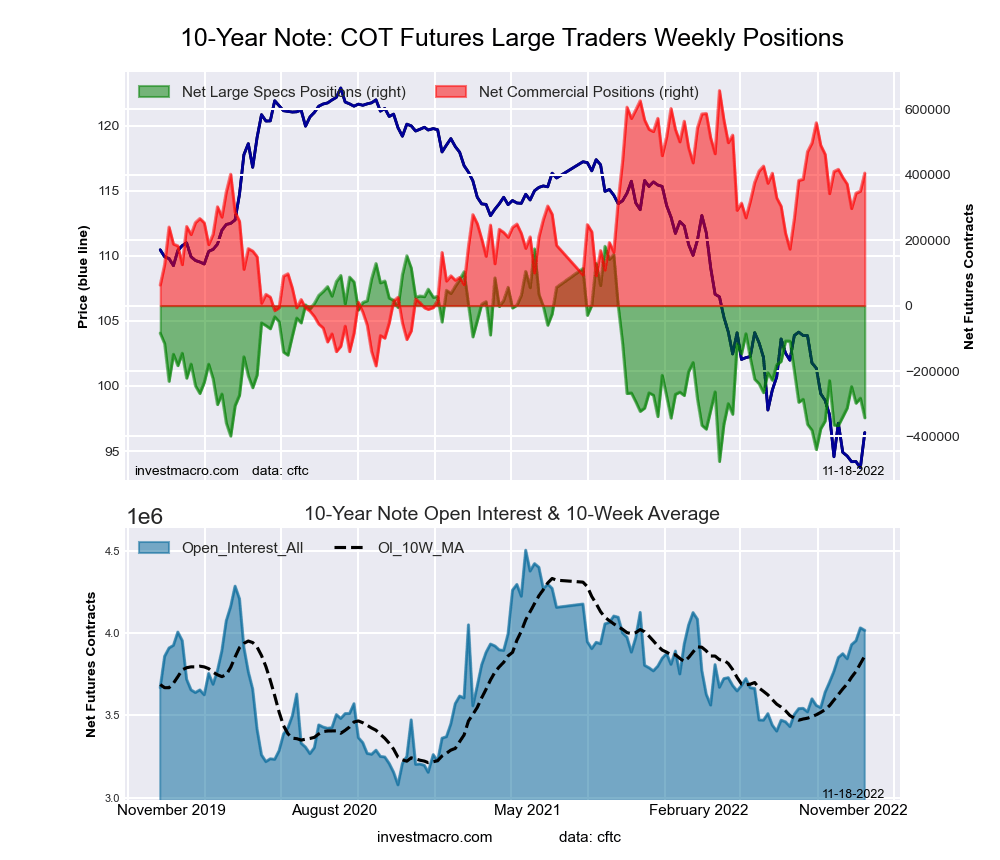
| 10-Year | 4,015,833 | 66 | -343,021 | 20 | 405,129 | 70 | -62,108 | 65 |
| 5-Year | 4,333,912 | 70 | -547,618 | 3 | 632,207 | 90 | -84,589 | 58 |
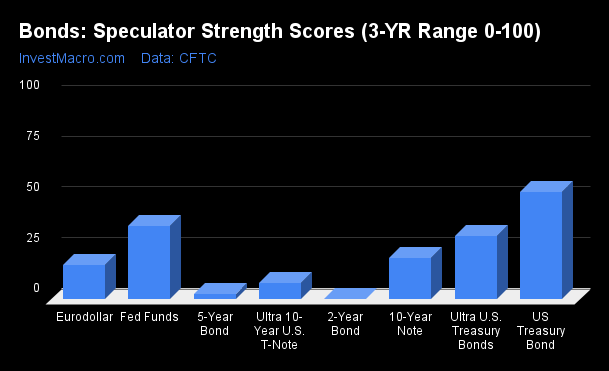
Strength Scores (a normalized measure of Speculator positions over a 3-Year range, from 0 to 100 where above 80 is extreme bullish and below 20 is extreme bearish) show that the US Treasury Bond (52.8 percent) leads the bonds category and is the only bond market above the 50 percent level (3-Year Midpoint).
On the downside, the 2-Year Bond (0.0 percent) comes in at the lowest strength level and currently at the bottom of its 3-Year range. The 5-Year Bond (2.7 percent), the Ultra 10-Year Bond (8.2 percent) and the Eurodollar (16.9 percent) join the 2-Year Bond with scores in bearish extreme positions (below 20 percent).
Strength Statistics:
Fed Funds (36.4 percent) vs Fed Funds previous week (42.4 percent)
2-Year Bond (0.0 percent) vs 2-Year Bond previous week (15.3 percent)
5-Year Bond (2.7 percent) vs 5-Year Bond previous week (10.0 percent)
10-Year Bond (20.3 percent) vs 10-Year Bond previous week (29.4 percent)
Ultra 10-Year Bond (8.2 percent) vs Ultra 10-Year Bond previous week (8.9 percent)
US Treasury Bond (52.8 percent) vs US Treasury Bond previous week (55.1 percent)
Ultra US Treasury Bond (31.1 percent) vs Ultra US Treasury Bond previous week (29.3 percent)
Eurodollar (16.9 percent) vs Eurodollar previous week (14.2 percent)
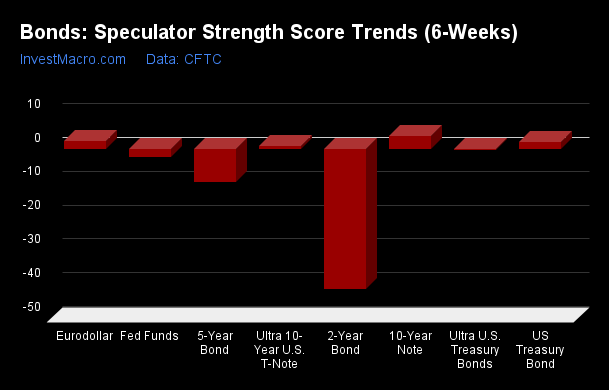
Strength Score Trends (or move index, calculates the 6-week changes in strength scores) show that the 10-Year Bond (3.6 percent) leads the past six weeks trends for bonds this week. The Eurodollar (2.2 percent), the US Treasury Bond (1.9 percent) and the Ultra 10-Year Bond (0.8 percent) fill out the other positive movers in the latest trends data.
The 2-Year Bond (-41.6 percent) leads the downside trend scores currently with a steep drop while the next markets with lower trend scores was the 5-Year Bond (-9.8 percent) followed by the Fed Funds (-2.4 percent).
Strength Trend Statistics:
Fed Funds (-2.4 percent) vs Fed Funds previous week (-9.9 percent)
2-Year Bond (-41.6 percent) vs 2-Year Bond previous week (-24.2 percent)
5-Year Bond (-9.8 percent) vs 5-Year Bond previous week (-8.7 percent)
10-Year Bond (3.6 percent) vs 10-Year Bond previous week (12.5 percent)
Ultra 10-Year Bond (0.8 percent) vs Ultra 10-Year Bond previous week (-4.4 percent)
US Treasury Bond (1.9 percent) vs US Treasury Bond previous week (1.9 percent)
Ultra US Treasury Bond (-0.4 percent) vs Ultra US Treasury Bond previous week (-0.1 percent)
Eurodollar (2.2 percent) vs Eurodollar previous week (0.9 percent)
This week’s current strength score (the trader positioning range over the past three years, measured from 0 to 100) shows the speculators are currently Bearish-Extreme with a score of 16.9 percent. The commercials are Bullish-Extreme with a score of 81.0 percent and the small traders (not shown in chart) are Bearish with a score of 45.9 percent.
| 3-Month Eurodollars Statistics | SPECULATORS | COMMERCIALS | SMALL TRADERS |
| – Percent of Open Interest Longs: | 7.3 | 67.9 | 5.2 |
| – Percent of Open Interest Shorts: | 32.9 | 38.8 | 8.7 |
| – Net Position: | -1,966,931 | 2,232,777 | -265,846 |
| – Gross Longs: | 559,946 | 5,207,904 | 402,188 |
| – Gross Shorts: | 2,526,877 | 2,975,127 | 668,034 |
| – Long to Short Ratio: | 0.2 to 1 | 1.8 to 1 | 0.6 to 1 |
| NET POSITION TREND: | |||
| – Strength Index Score (3 Year Range Pct): | 16.9 | 81.0 | 45.9 |
| – Strength Index Reading (3 Year Range): | Bearish-Extreme | Bullish-Extreme | Bearish |
| NET POSITION MOVEMENT INDEX: | |||
| – 6-Week Change in Strength Index: | 2.2 | -2.0 | -2.1 |
This week’s current strength score (the trader positioning range over the past three years, measured from 0 to 100) shows the speculators are currently Bearish with a score of 36.4 percent. The commercials are Bullish with a score of 63.9 percent and the small traders (not shown in chart) are Bearish with a score of 43.0 percent.
| 30-Day Federal Funds Statistics | SPECULATORS | COMMERCIALS | SMALL TRADERS |
| – Percent of Open Interest Longs: | 10.1 | 75.6 | 2.6 |
| – Percent of Open Interest Shorts: | 11.8 | 73.4 | 3.0 |
| – Net Position: | -26,285 | 32,822 | -6,537 |
| – Gross Longs: | 149,693 | 1,124,421 | 38,519 |
| – Gross Shorts: | 175,978 | 1,091,599 | 45,056 |
| – Long to Short Ratio: | 0.9 to 1 | 1.0 to 1 | 0.9 to 1 |
| NET POSITION TREND: | |||
| – Strength Index Score (3 Year Range Pct): | 36.4 | 63.9 | 43.0 |
| – Strength Index Reading (3 Year Range): | Bearish | Bullish | Bearish |
| NET POSITION MOVEMENT INDEX: | |||
| – 6-Week Change in Strength Index: | -2.4 | 1.0 | 29.4 |
This week’s current strength score (the trader positioning range over the past three years, measured from 0 to 100) shows the speculators are currently Bearish-Extreme with a score of 0.0 percent. The commercials are Bullish-Extreme with a score of 100.0 percent and the small traders (not shown in chart) are Bullish with a score of 50.0 percent.
| 2-Year Treasury Note Statistics | SPECULATORS | COMMERCIALS | SMALL TRADERS |
| – Percent of Open Interest Longs: | 6.5 | 82.2 | 8.3 |
| – Percent of Open Interest Shorts: | 32.4 | 56.1 | 8.5 |
| – Net Position: | -586,270 | 590,806 | -4,536 |
| – Gross Longs: | 146,333 | 1,859,038 | 187,082 |
| – Gross Shorts: | 732,603 | 1,268,232 | 191,618 |
| – Long to Short Ratio: | 0.2 to 1 | 1.5 to 1 | 1.0 to 1 |
| NET POSITION TREND: | |||
| – Strength Index Score (3 Year Range Pct): | 0.0 | 100.0 | 50.0 |
| – Strength Index Reading (3 Year Range): | Bearish-Extreme | Bullish-Extreme | Bullish |
| NET POSITION MOVEMENT INDEX: | |||
| – 6-Week Change in Strength Index: | -41.6 | 29.6 | 37.5 |
This week’s current strength score (the trader positioning range over the past three years, measured from 0 to 100) shows the speculators are currently Bearish-Extreme with a score of 2.7 percent. The commercials are Bullish-Extreme with a score of 90.3 percent and the small traders (not shown in chart) are Bullish with a score of 57.8 percent.
| 5-Year Treasury Note Statistics | SPECULATORS | COMMERCIALS | SMALL TRADERS |
| – Percent of Open Interest Longs: | 7.1 | 83.8 | 7.2 |
| – Percent of Open Interest Shorts: | 19.8 | 69.2 | 9.1 |
| – Net Position: | -547,618 | 632,207 | -84,589 |
| – Gross Longs: | 309,373 | 3,632,210 | 310,934 |
| – Gross Shorts: | 856,991 | 3,000,003 | 395,523 |
| – Long to Short Ratio: | 0.4 to 1 | 1.2 to 1 | 0.8 to 1 |
| NET POSITION TREND: | |||
| – Strength Index Score (3 Year Range Pct): | 2.7 | 90.3 | 57.8 |
| – Strength Index Reading (3 Year Range): | Bearish-Extreme | Bullish-Extreme | Bullish |
| NET POSITION MOVEMENT INDEX: | |||
| – 6-Week Change in Strength Index: | -9.8 | 0.9 | 15.8 |
This week’s current strength score (the trader positioning range over the past three years, measured from 0 to 100) shows the speculators are currently Bearish with a score of 20.3 percent. The commercials are Bullish with a score of 70.0 percent and the small traders (not shown in chart) are Bullish with a score of 65.3 percent.
| 10-Year Treasury Note Statistics | SPECULATORS | COMMERCIALS | SMALL TRADERS |
| – Percent of Open Interest Longs: | 11.8 | 76.1 | 9.4 |
| – Percent of Open Interest Shorts: | 20.3 | 66.0 | 11.0 |
| – Net Position: | -343,021 | 405,129 | -62,108 |
| – Gross Longs: | 472,288 | 3,054,508 | 379,476 |
| – Gross Shorts: | 815,309 | 2,649,379 | 441,584 |
| – Long to Short Ratio: | 0.6 to 1 | 1.2 to 1 | 0.9 to 1 |
| NET POSITION TREND: | |||
| – Strength Index Score (3 Year Range Pct): | 20.3 | 70.0 | 65.3 |
| – Strength Index Reading (3 Year Range): | Bearish | Bullish | Bullish |
| NET POSITION MOVEMENT INDEX: | |||
| – 6-Week Change in Strength Index: | 3.6 | -1.4 | -2.9 |
This week’s current strength score (the trader positioning range over the past three years, measured from 0 to 100) shows the speculators are currently Bearish-Extreme with a score of 8.2 percent. The commercials are Bullish-Extreme with a score of 87.6 percent and the small traders (not shown in chart) are Bullish with a score of 57.3 percent.
| Ultra 10-Year Notes Statistics | SPECULATORS | COMMERCIALS | SMALL TRADERS |
| – Percent of Open Interest Longs: | 9.6 | 79.9 | 9.6 |
| – Percent of Open Interest Shorts: | 15.3 | 66.7 | 17.1 |
| – Net Position: | -79,073 | 184,254 | -105,181 |
| – Gross Longs: | 133,971 | 1,114,722 | 133,372 |
| – Gross Shorts: | 213,044 | 930,468 | 238,553 |
| – Long to Short Ratio: | 0.6 to 1 | 1.2 to 1 | 0.6 to 1 |
| NET POSITION TREND: | |||
| – Strength Index Score (3 Year Range Pct): | 8.2 | 87.6 | 57.3 |
| – Strength Index Reading (3 Year Range): | Bearish-Extreme | Bullish-Extreme | Bullish |
| NET POSITION MOVEMENT INDEX: | |||
| – 6-Week Change in Strength Index: | 0.8 | 4.2 | -12.9 |
This week’s current strength score (the trader positioning range over the past three years, measured from 0 to 100) shows the speculators are currently Bullish with a score of 52.8 percent. The commercials are Bearish with a score of 38.7 percent and the small traders (not shown in chart) are Bullish with a score of 67.6 percent.
| US Treasury Bonds Statistics | SPECULATORS | COMMERCIALS | SMALL TRADERS |
| – Percent of Open Interest Longs: | 4.8 | 79.3 | 14.5 |
| – Percent of Open Interest Shorts: | 12.9 | 72.8 | 13.0 |
| – Net Position: | -97,681 | 78,745 | 18,936 |
| – Gross Longs: | 57,233 | 951,931 | 174,421 |
| – Gross Shorts: | 154,914 | 873,186 | 155,485 |
| – Long to Short Ratio: | 0.4 to 1 | 1.1 to 1 | 1.1 to 1 |
| NET POSITION TREND: | |||
| – Strength Index Score (3 Year Range Pct): | 52.8 | 38.7 | 67.6 |
| – Strength Index Reading (3 Year Range): | Bullish | Bearish | Bullish |
| NET POSITION MOVEMENT INDEX: | |||
| – 6-Week Change in Strength Index: | 1.9 | -2.3 | 0.6 |
This week’s current strength score (the trader positioning range over the past three years, measured from 0 to 100) shows the speculators are currently Bearish with a score of 31.1 percent. The commercials are Bullish with a score of 72.9 percent and the small traders (not shown in chart) are Bullish with a score of 73.8 percent.
| Ultra US Treasury Bonds Statistics | SPECULATORS | COMMERCIALS | SMALL TRADERS |
| – Percent of Open Interest Longs: | 6.3 | 81.5 | 11.4 |
| – Percent of Open Interest Shorts: | 31.6 | 59.7 | 8.0 |
| – Net Position: | -377,708 | 326,617 | 51,091 |
| – Gross Longs: | 94,540 | 1,217,889 | 170,609 |
| – Gross Shorts: | 472,248 | 891,272 | 119,518 |
| – Long to Short Ratio: | 0.2 to 1 | 1.4 to 1 | 1.4 to 1 |
| NET POSITION TREND: | |||
| – Strength Index Score (3 Year Range Pct): | 31.1 | 72.9 | 73.8 |
| – Strength Index Reading (3 Year Range): | Bearish | Bullish | Bullish |
| NET POSITION MOVEMENT INDEX: | |||
| – 6-Week Change in Strength Index: | -0.4 | 3.5 | -4.6 |
Article By InvestMacro – Receive our weekly COT Newsletter
*COT Report: The COT data, released weekly to the public each Friday, is updated through the most recent Tuesday (data is 3 days old) and shows a quick view of how large speculators or non-commercials (for-profit traders) were positioned in the futures markets.
The CFTC categorizes trader positions according to commercial hedgers (traders who use futures contracts for hedging as part of the business), non-commercials (large traders who speculate to realize trading profits) and nonreportable traders (usually small traders/speculators) as well as their open interest (contracts open in the market at time of reporting). See CFTC criteria here.
By Laura Russo, University of Tennessee A surprisingly large number and diversity of bee species…
By JustMarkets The US stock indices ended Tuesday with confident gains, fully driven by a…
By Analytical Department RoboForex Gold traded around 4,080 USD per ounce on Wednesday, having risen…
By JustMarkets The US stock indices started the week on a downbeat note. By the…
By Analytical Department RoboForex GBP/USD fell to 1.3437 on Tuesday as investors assessed the appointment…
By JustMarkets The US stock indices ended Friday’s session in the red. By the end…
This website uses cookies.