By InvestMacro
Here are the latest charts and statistics for the Commitment of Traders (COT) reports data published by the Commodities Futures Trading Commission (CFTC).
The latest COT data is updated through Tuesday October 11th and shows a quick view of how large traders (for-profit speculators and commercial hedgers) were positioned in the futures markets.
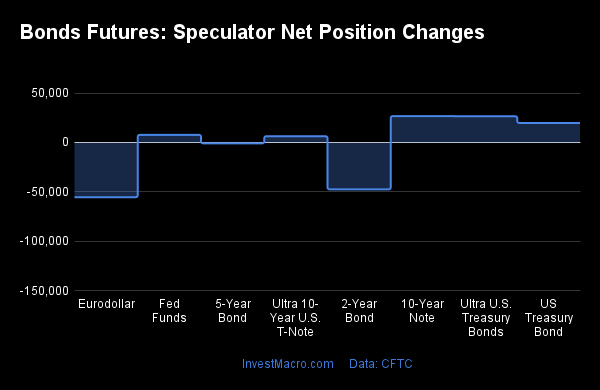
The COT bond market speculator bets were higher this week as five out of the eight bond markets we cover had higher positioning this week while two markets had lower contracts.
Free Reports:
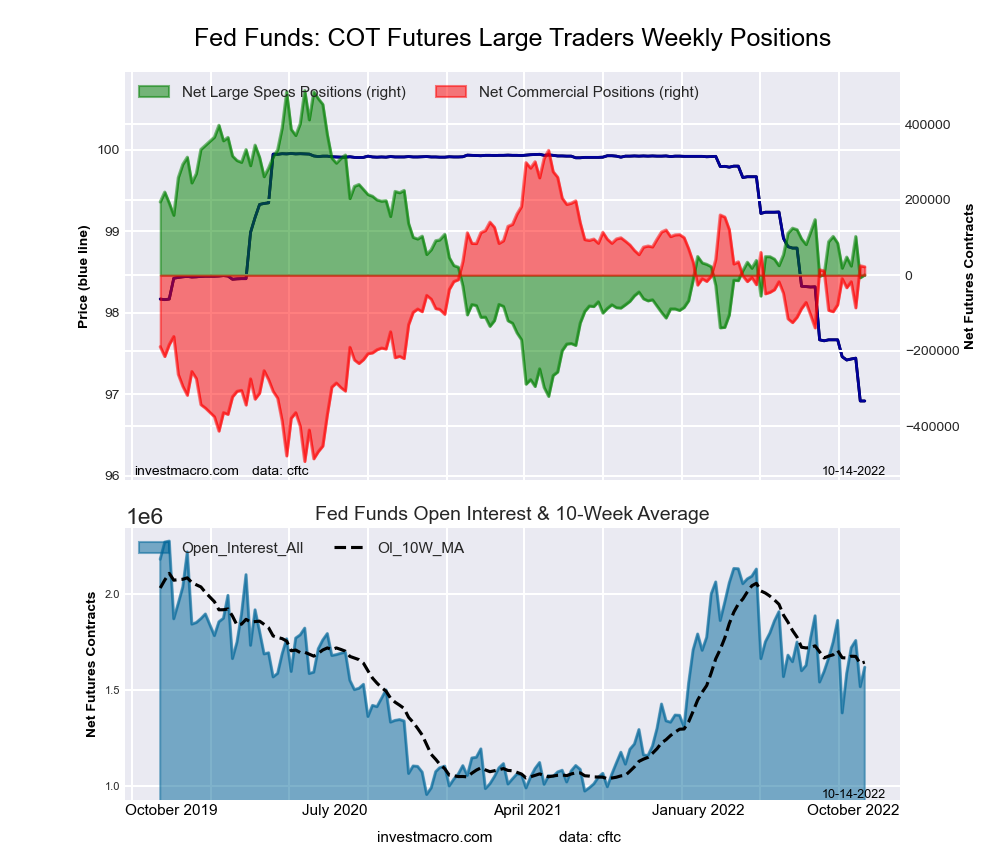
Leading the weekly gains for the bond market was the 10-Year Bond (26,709 contracts) with the Ultra US Bond (26,591 contracts), the Long US Bond (19,731 contracts), the Fed Funds (7,692 contracts) and the Ultra 10-Year (6,320 contracts) also showing positive weeks.
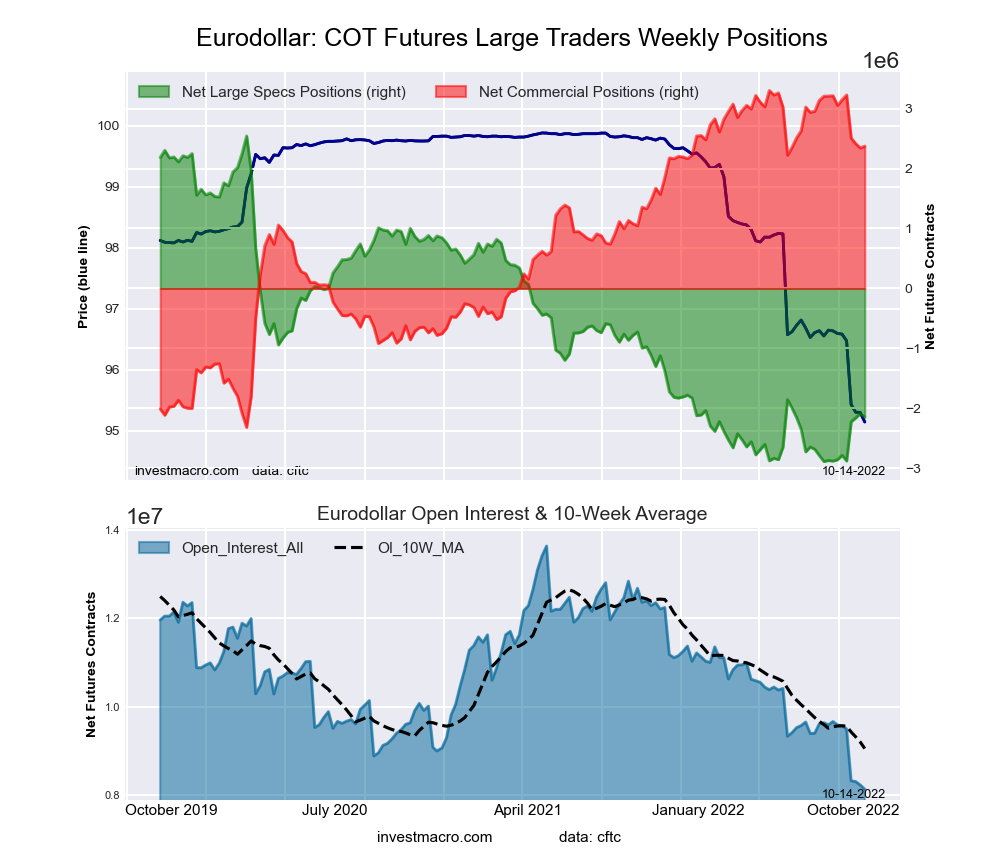
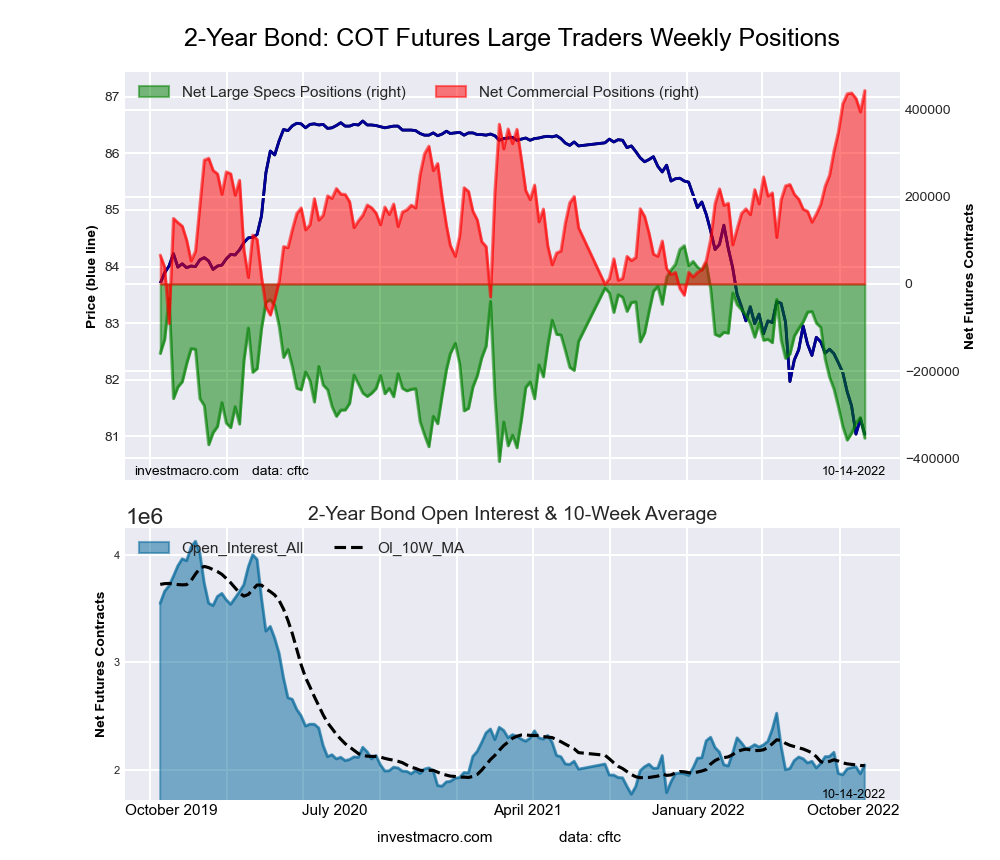
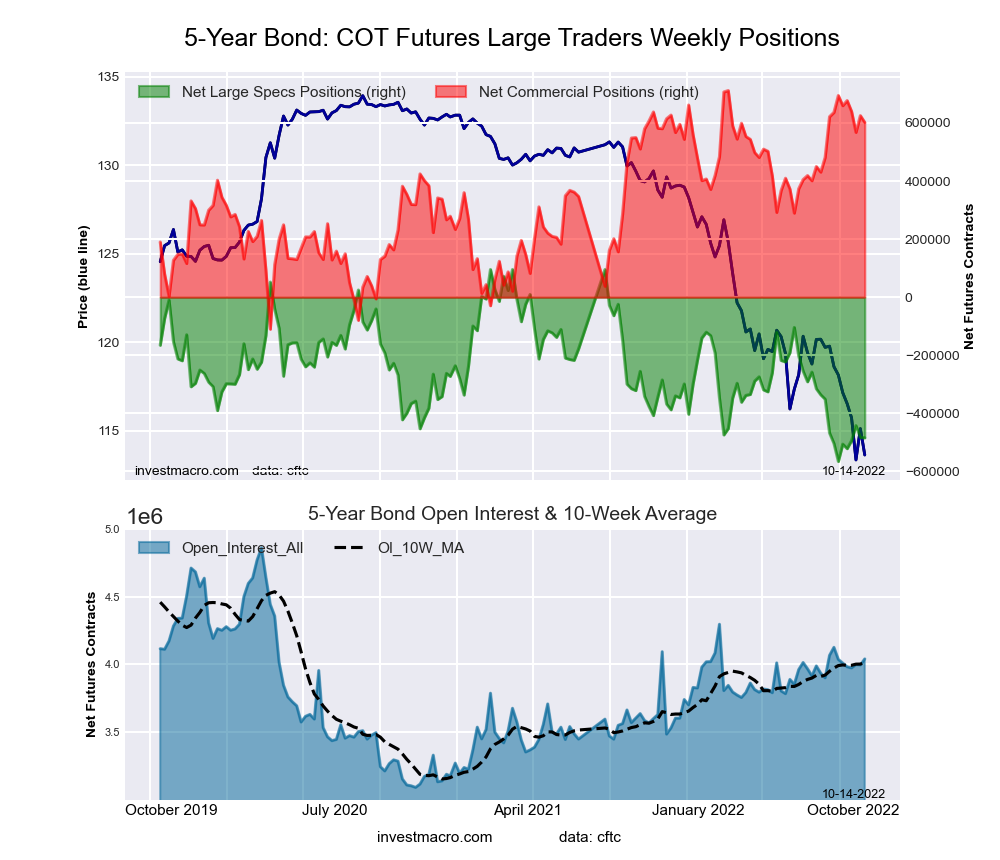
The bond market leading the weekly declines in speculator bets this week was the Eurodollar (-55,468 contracts) with the 2-Year Bond (-47,552 contracts) and the 5-Year Bond (-888 contracts) also registering lower bets on the week.
Highlighting the COT bonds data this week is the bearishness of the 2-Year Bond market. Speculators added over -47,000 contracts this week to the overall bearish position. The decline in the 2-Year this week follows three straight weeks of lessening bearish levels. This bearish reboot pushed the overall bearish standing up to -353,686 total net contracts which is the most in five weeks and the second highest in past 79 weeks. The 2-Year is feeling the brunt of the US Federal Reserve’s interest rate hiking campaign (to subdue inflation) and will likely not get a reprieve any time soon with inflation coming in higher again this week. The 2-Year yield (as bond prices fall, yields rise) ended the week at just under 4.50 percent and significantly higher from a 2-Year yield of just 0.38 percent on October 15th of 2021, exactly one year ago today.
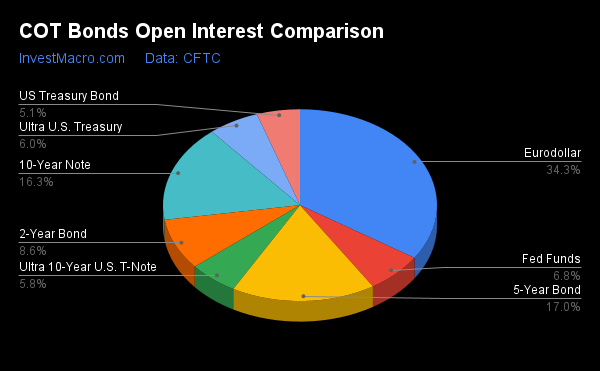
| Oct-11-2022 | OI | OI-Index | Spec-Net | Spec-Index | Com-Net | COM-Index | Smalls-Net | Smalls-Index |
|---|---|---|---|---|---|---|---|---|
| Eurodollar | 8,129,682 | 0 | -2,143,216 | 14 | 2,373,775 | 83 | -230,559 | 54 |
| FedFunds | 1,617,720 | 50 | 888 | 40 | 22,183 | 63 | -23,071 | 1 |
| 2-Year | 2,045,923 | 12 | -353,686 | 11 | 443,750 | 100 | -90,064 | 12 |
| Long T-Bond | 1,211,229 | 45 | -83,792 | 57 | 56,157 | 31 | 27,635 | 75 |
| 10-Year | 3,873,986 | 56 | -340,163 | 21 | 392,171 | 68 | -52,008 | 68 |
| 5-Year | 4,040,583 | 54 | -483,920 | 12 | 601,685 | 87 | -117,765 | 49 |
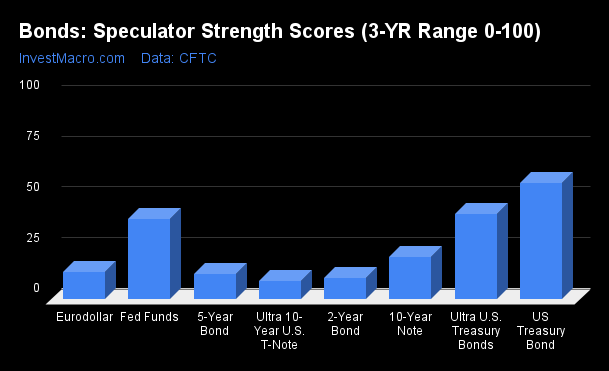
Strength Scores (a normalized measure of Speculator positions over a 3-Year range, from 0 to 100 where above 80 is extreme bullish and below 20 is extreme bearish) show that the US Treasury Bond (57.3 percent) lead the bonds category. This is the only market above 50 percent or the midpoint of its 3-year range. The Ultra US Treasury Bond (42.3 percent) comes in as the next highest bonds market in strength scores and its score this week has risen from 31.5 percent last week.
On the downside, the Ultra 10-Year Bond (9.1 percent), the 2-Year Bond (10.8 percent), the 5-Year Bond (12.3 percent) and the Eurodollar (13.7 percent) come in at the lowest strength level currently and are all in bearish extreme speculator levels (below 20 percent).
Strength Statistics:
Fed Funds (39.7 percent) vs Fed Funds previous week (38.8 percent)
2-Year Bond (10.8 percent) vs 2-Year Bond previous week (20.4 percent)
5-Year Bond (12.3 percent) vs 5-Year Bond previous week (12.5 percent)
10-Year Bond (20.7 percent) vs 10-Year Bond previous week (16.7 percent)
Ultra 10-Year Bond (9.1 percent) vs Ultra 10-Year Bond previous week (7.4 percent)
US Treasury Bond (57.3 percent) vs US Treasury Bond previous week (50.9 percent)
Ultra US Treasury Bond (42.3 percent) vs Ultra US Treasury Bond previous week (31.5 percent)
Eurodollar (13.7 percent) vs Eurodollar previous week (14.7 percent)
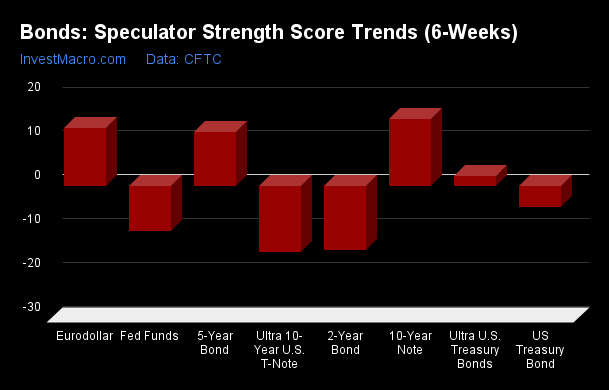
Strength Score Trends (or move index, calculates the 6-week changes in strength scores) show that the 10-Year Bond (15.2 percent) leads the past six weeks trends for bonds this week. The Eurodollar (13.2 percent), the 5-Year Bond (12.3 percent) and the Ultra US Treasury Bond (2.3 percent) fill out the rest of the positive movers in the latest trends data.
The Ultra 10-Year Bond (-15.0 percent) and the 2-Year Bond (-14.6 percent) lead the downside trend scores this week followed by the Fed Funds (-10.4 percent).
Strength Trend Statistics:
Fed Funds (-10.4 percent) vs Fed Funds previous week (-13.5 percent)
2-Year Bond (-14.6 percent) vs 2-Year Bond previous week (-13.1 percent)
5-Year Bond (12.3 percent) vs 5-Year Bond previous week (3.1 percent)
10-Year Bond (15.2 percent) vs 10-Year Bond previous week (2.2 percent)
Ultra 10-Year Bond (-15.0 percent) vs Ultra 10-Year Bond previous week (-14.8 percent)
US Treasury Bond (-4.9 percent) vs US Treasury Bond previous week (-17.0 percent)
Ultra US Treasury Bond (2.3 percent) vs Ultra US Treasury Bond previous week (-0.2 percent)
Eurodollar (13.2 percent) vs Eurodollar previous week (14.6 percent)
This week’s current strength score (the trader positioning range over the past three years, measured from 0 to 100) shows the speculators are currently Bearish-Extreme with a score of 13.7 percent. The commercials are Bullish-Extreme with a score of 83.5 percent and the small traders (not shown in chart) are Bullish with a score of 53.7 percent.
| 3-Month Eurodollars Statistics | SPECULATORS | COMMERCIALS | SMALL TRADERS |
| – Percent of Open Interest Longs: | 7.3 | 69.4 | 5.1 |
| – Percent of Open Interest Shorts: | 33.6 | 40.2 | 7.9 |
| – Net Position: | -2,143,216 | 2,373,775 | -230,559 |
| – Gross Longs: | 591,090 | 5,639,550 | 411,933 |
| – Gross Shorts: | 2,734,306 | 3,265,775 | 642,492 |
| – Long to Short Ratio: | 0.2 to 1 | 1.7 to 1 | 0.6 to 1 |
| NET POSITION TREND: | |||
| – Strength Index Score (3 Year Range Pct): | 13.7 | 83.5 | 53.7 |
| – Strength Index Reading (3 Year Range): | Bearish-Extreme | Bullish-Extreme | Bullish |
| NET POSITION MOVEMENT INDEX: | |||
| – 6-Week Change in Strength Index: | 13.2 | -12.1 | -7.6 |
This week’s current strength score (the trader positioning range over the past three years, measured from 0 to 100) shows the speculators are currently Bearish with a score of 39.7 percent. The commercials are Bullish with a score of 62.6 percent and the small traders (not shown in chart) are Bearish-Extreme with a score of 0.9 percent.
| 30-Day Federal Funds Statistics | SPECULATORS | COMMERCIALS | SMALL TRADERS |
| – Percent of Open Interest Longs: | 10.7 | 73.3 | 1.4 |
| – Percent of Open Interest Shorts: | 10.6 | 71.9 | 2.8 |
| – Net Position: | 888 | 22,183 | -23,071 |
| – Gross Longs: | 172,327 | 1,185,073 | 22,805 |
| – Gross Shorts: | 171,439 | 1,162,890 | 45,876 |
| – Long to Short Ratio: | 1.0 to 1 | 1.0 to 1 | 0.5 to 1 |
| NET POSITION TREND: | |||
| – Strength Index Score (3 Year Range Pct): | 39.7 | 62.6 | 0.9 |
| – Strength Index Reading (3 Year Range): | Bearish | Bullish | Bearish-Extreme |
| NET POSITION MOVEMENT INDEX: | |||
| – 6-Week Change in Strength Index: | -10.4 | 12.2 | -42.1 |
This week’s current strength score (the trader positioning range over the past three years, measured from 0 to 100) shows the speculators are currently Bearish-Extreme with a score of 10.8 percent. The commercials are Bullish-Extreme with a score of 100.0 percent and the small traders (not shown in chart) are Bearish-Extreme with a score of 11.8 percent.
| 2-Year Treasury Note Statistics | SPECULATORS | COMMERCIALS | SMALL TRADERS |
| – Percent of Open Interest Longs: | 7.0 | 82.7 | 7.9 |
| – Percent of Open Interest Shorts: | 24.3 | 61.1 | 12.3 |
| – Net Position: | -353,686 | 443,750 | -90,064 |
| – Gross Longs: | 143,277 | 1,692,889 | 160,698 |
| – Gross Shorts: | 496,963 | 1,249,139 | 250,762 |
| – Long to Short Ratio: | 0.3 to 1 | 1.4 to 1 | 0.6 to 1 |
| NET POSITION TREND: | |||
| – Strength Index Score (3 Year Range Pct): | 10.8 | 100.0 | 11.8 |
| – Strength Index Reading (3 Year Range): | Bearish-Extreme | Bullish-Extreme | Bearish-Extreme |
| NET POSITION MOVEMENT INDEX: | |||
| – 6-Week Change in Strength Index: | -14.6 | 18.5 | -10.4 |
This week’s current strength score (the trader positioning range over the past three years, measured from 0 to 100) shows the speculators are currently Bearish-Extreme with a score of 12.3 percent. The commercials are Bullish-Extreme with a score of 86.6 percent and the small traders (not shown in chart) are Bearish with a score of 48.6 percent.
| 5-Year Treasury Note Statistics | SPECULATORS | COMMERCIALS | SMALL TRADERS |
| – Percent of Open Interest Longs: | 6.0 | 85.5 | 7.5 |
| – Percent of Open Interest Shorts: | 18.0 | 70.6 | 10.4 |
| – Net Position: | -483,920 | 601,685 | -117,765 |
| – Gross Longs: | 243,772 | 3,456,189 | 303,741 |
| – Gross Shorts: | 727,692 | 2,854,504 | 421,506 |
| – Long to Short Ratio: | 0.3 to 1 | 1.2 to 1 | 0.7 to 1 |
| NET POSITION TREND: | |||
| – Strength Index Score (3 Year Range Pct): | 12.3 | 86.6 | 48.6 |
| – Strength Index Reading (3 Year Range): | Bearish-Extreme | Bullish-Extreme | Bearish |
| NET POSITION MOVEMENT INDEX: | |||
| – 6-Week Change in Strength Index: | 12.3 | -11.3 | 3.1 |
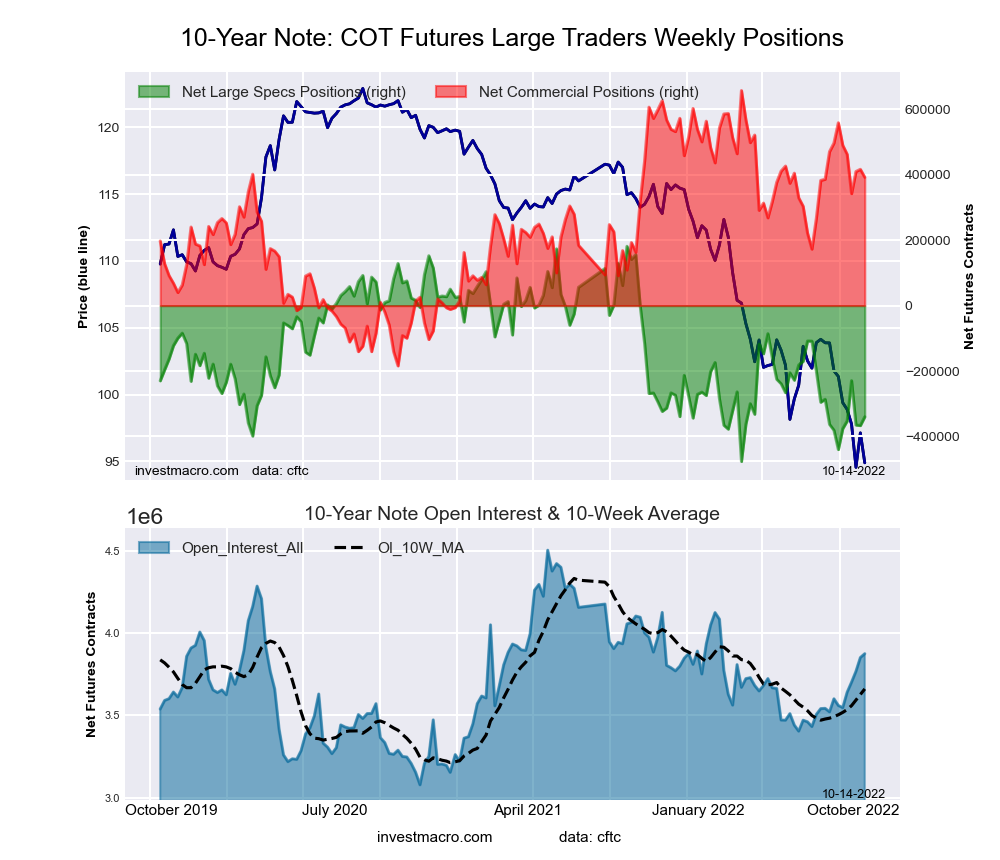
This week’s current strength score (the trader positioning range over the past three years, measured from 0 to 100) shows the speculators are currently Bearish with a score of 20.7 percent. The commercials are Bullish with a score of 68.5 percent and the small traders (not shown in chart) are Bullish with a score of 67.7 percent.
| 10-Year Treasury Note Statistics | SPECULATORS | COMMERCIALS | SMALL TRADERS |
| – Percent of Open Interest Longs: | 9.9 | 78.5 | 8.9 |
| – Percent of Open Interest Shorts: | 18.7 | 68.3 | 10.3 |
| – Net Position: | -340,163 | 392,171 | -52,008 |
| – Gross Longs: | 382,909 | 3,039,993 | 345,964 |
| – Gross Shorts: | 723,072 | 2,647,822 | 397,972 |
| – Long to Short Ratio: | 0.5 to 1 | 1.1 to 1 | 0.9 to 1 |
| NET POSITION TREND: | |||
| – Strength Index Score (3 Year Range Pct): | 20.7 | 68.5 | 67.7 |
| – Strength Index Reading (3 Year Range): | Bearish | Bullish | Bullish |
| NET POSITION MOVEMENT INDEX: | |||
| – 6-Week Change in Strength Index: | 15.2 | -19.8 | 15.8 |
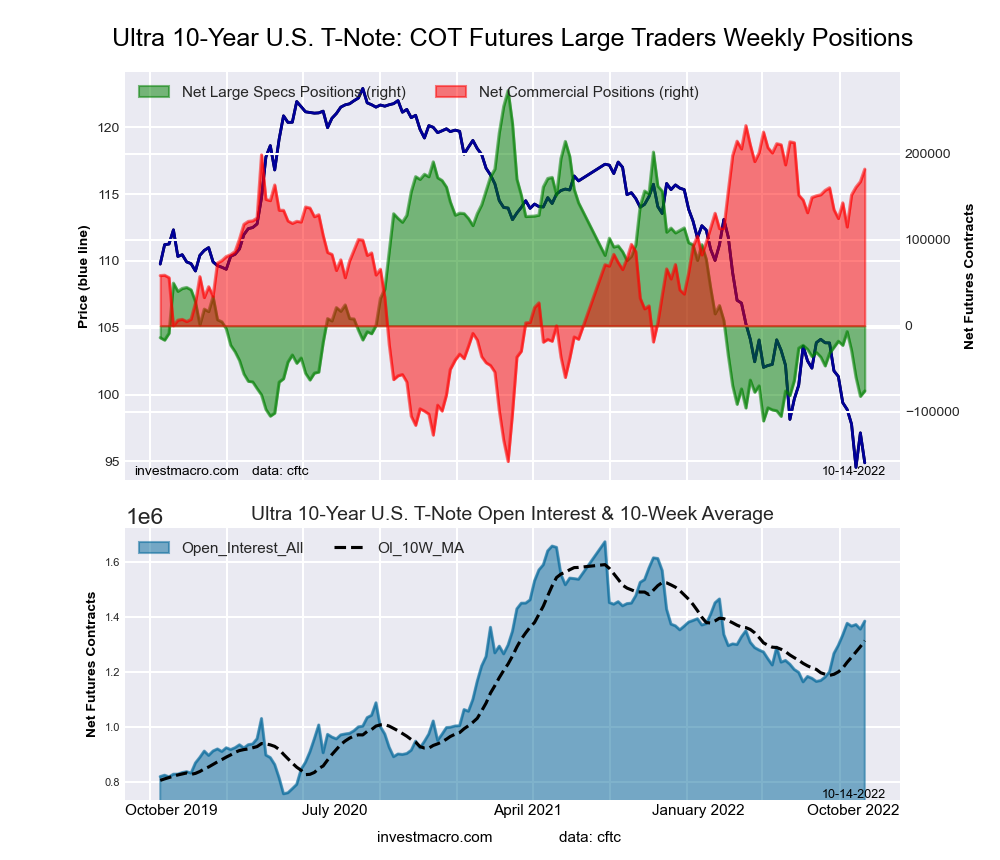
This week’s current strength score (the trader positioning range over the past three years, measured from 0 to 100) shows the speculators are currently Bearish-Extreme with a score of 9.1 percent. The commercials are Bullish-Extreme with a score of 87.0 percent and the small traders (not shown in chart) are Bullish with a score of 56.5 percent.
| Ultra 10-Year Notes Statistics | SPECULATORS | COMMERCIALS | SMALL TRADERS |
| – Percent of Open Interest Longs: | 7.9 | 81.4 | 10.0 |
| – Percent of Open Interest Shorts: | 13.3 | 68.3 | 17.7 |
| – Net Position: | -75,771 | 182,196 | -106,425 |
| – Gross Longs: | 109,093 | 1,127,822 | 138,379 |
| – Gross Shorts: | 184,864 | 945,626 | 244,804 |
| – Long to Short Ratio: | 0.6 to 1 | 1.2 to 1 | 0.6 to 1 |
| NET POSITION TREND: | |||
| – Strength Index Score (3 Year Range Pct): | 9.1 | 87.0 | 56.5 |
| – Strength Index Reading (3 Year Range): | Bearish-Extreme | Bullish-Extreme | Bullish |
| NET POSITION MOVEMENT INDEX: | |||
| – 6-Week Change in Strength Index: | -15.0 | 14.7 | 0.2 |
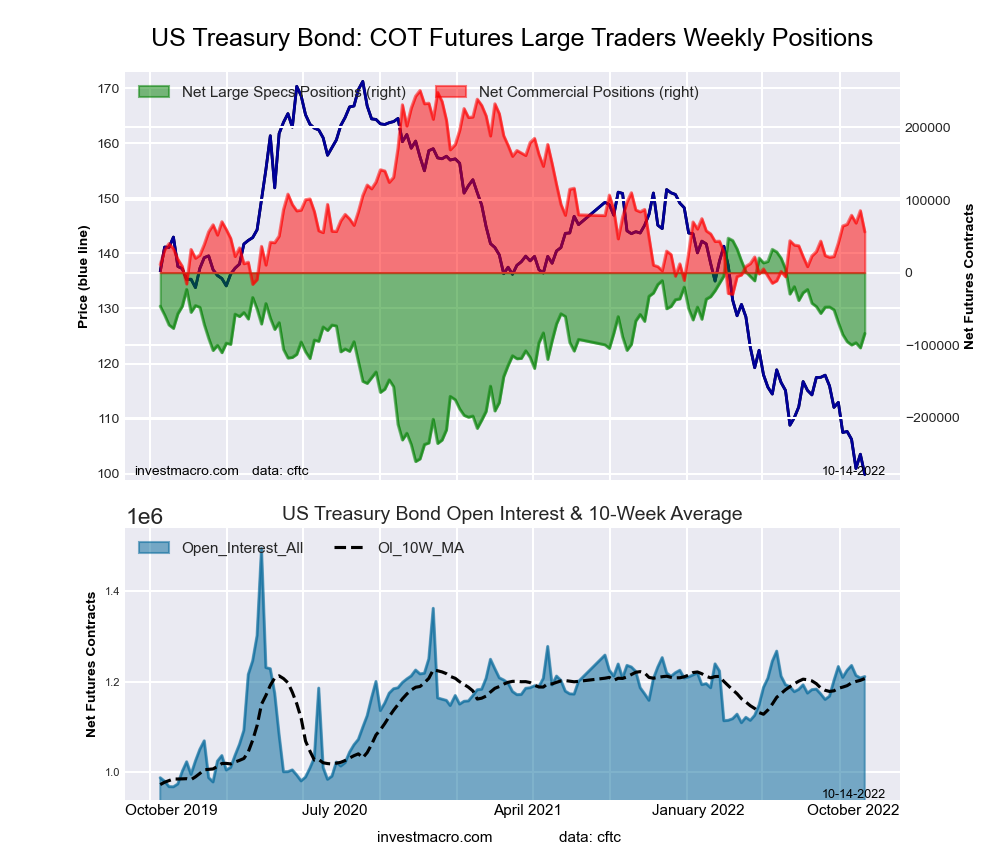
This week’s current strength score (the trader positioning range over the past three years, measured from 0 to 100) shows the speculators are currently Bullish with a score of 57.3 percent. The commercials are Bearish with a score of 30.6 percent and the small traders (not shown in chart) are Bullish with a score of 74.5 percent.
| US Treasury Bonds Statistics | SPECULATORS | COMMERCIALS | SMALL TRADERS |
| – Percent of Open Interest Longs: | 6.7 | 78.5 | 13.8 |
| – Percent of Open Interest Shorts: | 13.6 | 73.9 | 11.5 |
| – Net Position: | -83,792 | 56,157 | 27,635 |
| – Gross Longs: | 81,465 | 951,230 | 166,967 |
| – Gross Shorts: | 165,257 | 895,073 | 139,332 |
| – Long to Short Ratio: | 0.5 to 1 | 1.1 to 1 | 1.2 to 1 |
| NET POSITION TREND: | |||
| – Strength Index Score (3 Year Range Pct): | 57.3 | 30.6 | 74.5 |
| – Strength Index Reading (3 Year Range): | Bullish | Bearish | Bullish |
| NET POSITION MOVEMENT INDEX: | |||
| – 6-Week Change in Strength Index: | -4.9 | 5.5 | -0.3 |
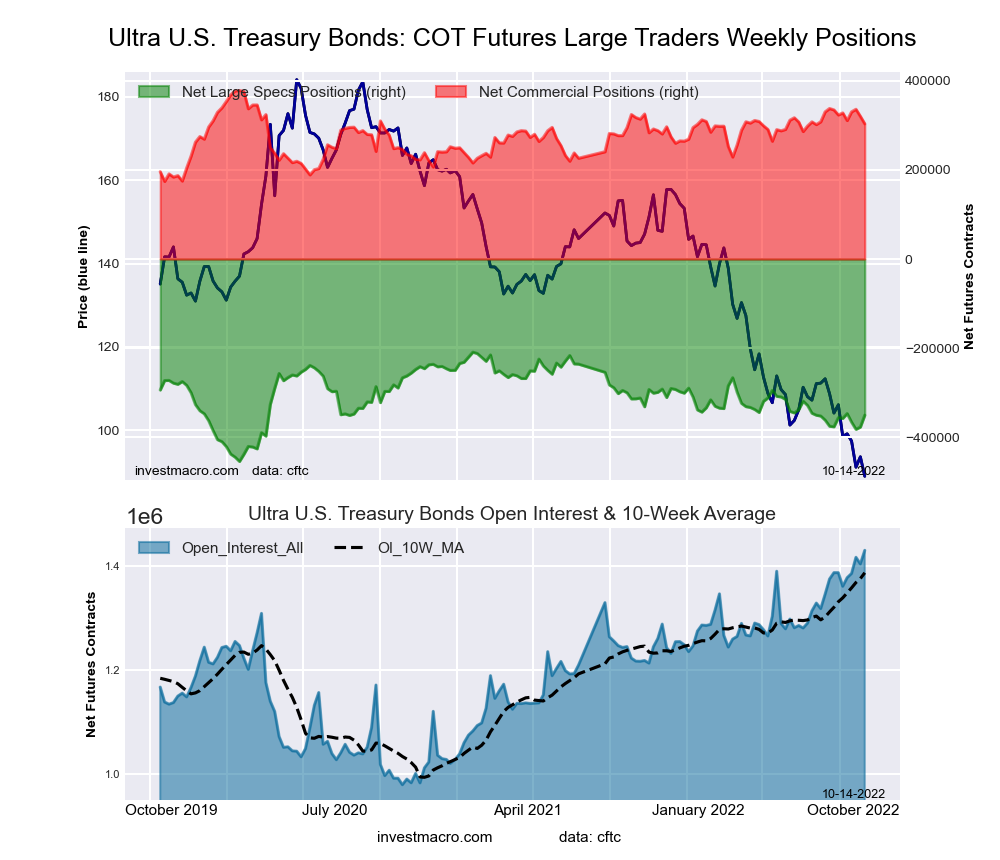
This week’s current strength score (the trader positioning range over the past three years, measured from 0 to 100) shows the speculators are currently Bearish with a score of 42.3 percent. The commercials are Bullish with a score of 63.2 percent and the small traders (not shown in chart) are Bullish with a score of 62.0 percent.
| Ultra US Treasury Bonds Statistics | SPECULATORS | COMMERCIALS | SMALL TRADERS |
| – Percent of Open Interest Longs: | 6.2 | 82.0 | 11.2 |
| – Percent of Open Interest Shorts: | 30.7 | 60.7 | 7.9 |
| – Net Position: | -350,232 | 303,283 | 46,949 |
| – Gross Longs: | 88,146 | 1,171,440 | 160,022 |
| – Gross Shorts: | 438,378 | 868,157 | 113,073 |
| – Long to Short Ratio: | 0.2 to 1 | 1.3 to 1 | 1.4 to 1 |
| NET POSITION TREND: | |||
| – Strength Index Score (3 Year Range Pct): | 42.3 | 63.2 | 62.0 |
| – Strength Index Reading (3 Year Range): | Bearish | Bullish | Bullish |
| NET POSITION MOVEMENT INDEX: | |||
| – 6-Week Change in Strength Index: | 2.3 | -9.8 | 10.3 |
Article By InvestMacro – Receive our weekly COT Newsletter
*COT Report: The COT data, released weekly to the public each Friday, is updated through the most recent Tuesday (data is 3 days old) and shows a quick view of how large speculators or non-commercials (for-profit traders) were positioned in the futures markets.
The CFTC categorizes trader positions according to commercial hedgers (traders who use futures contracts for hedging as part of the business), non-commercials (large traders who speculate to realize trading profits) and nonreportable traders (usually small traders/speculators) as well as their open interest (contracts open in the market at time of reporting). See CFTC criteria here.
By Jeffrey Young, Georgia Institute of Technology You’ve probably heard artificial intelligence models described as…
Source: Barry Dawes (7/23/26) Barry Dawes of Martin Place Securities shares his analysis of the…
By JustMarkets The US stock indices ended Thursday’s session with a notable decline amid a…
By Analytical Department RoboForex USD/JPY soared to 163.81 on Friday, marking a new 40-year high.…
By JustMarkets The US equities ended Wednesday’s session lower amid investor caution ahead of the…
By Analytical Department RoboForex EUR/USD rose to 1.1429 on Thursday, with the US dollar continuing…
This website uses cookies.