By InvestMacro | COT | Data Tables | COT Leaders | Downloads | COT Newsletter
Here are the latest charts and statistics for the Commitment of Traders (COT) data published by the Commodities Futures Trading Commission (CFTC).
The latest COT data is updated through Tuesday August 16th and shows a quick view of how large traders (for-profit speculators and commercial entities) were positioned in the futures markets.
COT bond market speculator bets were mixed on the week as four out of the eight bond markets we cover had higher positioning this week while the other four markets had lower contracts.
Leading the gains for the bond markets was the Fed Funds Futures (87,697 contracts) with the Eurodollar (16,102 contracts), the Ultra 10-Year (14,667 contracts) and the Long US Bond (261 contracts) also recording positive weeks.
Free Reports:
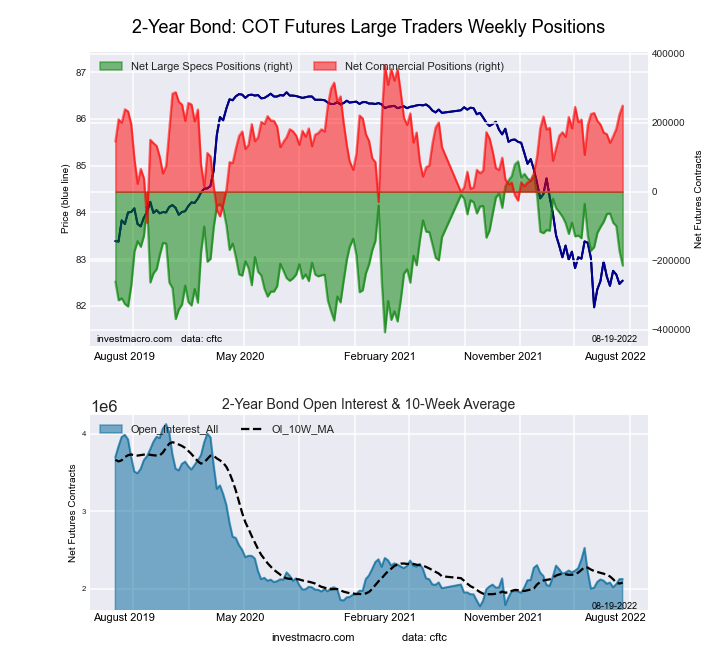
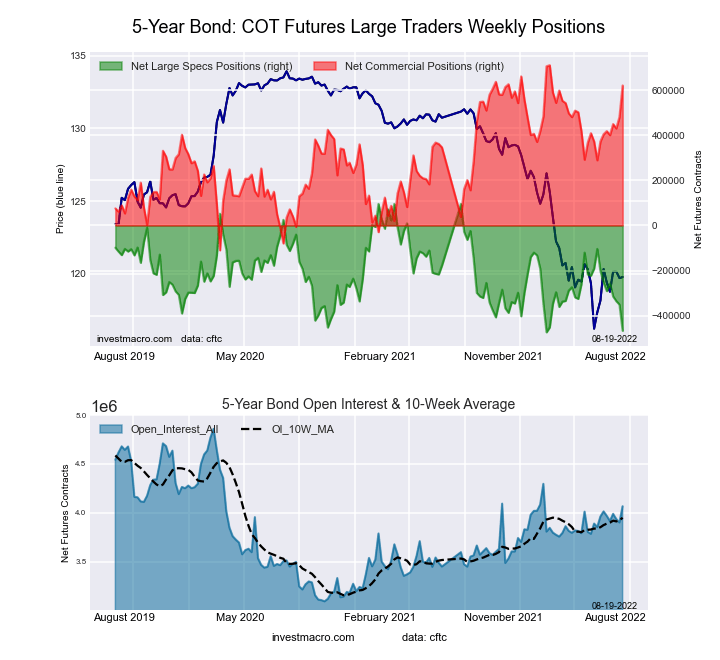
The bond markets leading the declines in speculator bets this week were the 5-Year Bond (-116,372 contracts) and the 10-Year Bond (-76,650 contracts) with the 2-Year Bond (-41,827 contracts) and the Ultra US Bond (-13,607 contracts) also registering lower bets on the week.
The 5-Year Treasury Bond Futures saw their speculator bets drop sharply again this week. The 5-Year fell for the fourth straight week and for the seventh time in the past eight weeks for an eight-week total decline by -363,294 contracts. This recent weakness has pushed the overall speculator standing to the lowest level since March 1st, a span of twenty-four weeks. Overall, the 5-Year market is now very close to the bottom of it’s 3-year speculator sentiment range (1.2 percent strength score on a scale of 0-100) and has seen that strength score fall by -37.4 percent over the past six weeks (6-week trend score).
The 5-Year Bond price has continued in a downtrend and it’s yield closed the week (yields rise when bond prices fall) higher around 3.09 percent. Currently, the 5-Year yield (3.09%) is inverted with the 10-Year yield (2.97%), meaning that the shorter bond pays more yield than the longer bond and overall, an unusual occurrence.
| Aug-16-2022 | OI | OI-Index | Spec-Net | Spec-Index | Com-Net | COM-Index | Smalls-Net | Smalls-Index |
|---|---|---|---|---|---|---|---|---|
| Eurodollar | 9,585,911 | 15 | -2,869,877 | 0 | 3,208,503 | 98 | -338,626 | 30 |
| FedFunds | 1,665,365 | 54 | 88,658 | 51 | -93,150 | 49 | 4,492 | 71 |
| 2-Year | 2,124,688 | 15 | -214,048 | 39 | 249,553 | 74 | -35,505 | 34 |
| Long T-Bond | 1,167,915 | 39 | -47,325 | 69 | 21,207 | 18 | 26,118 | 73 |
| 10-Year | 3,520,468 | 31 | -363,128 | 17 | 470,732 | 78 | -107,604 | 54 |
| 5-Year | 4,066,730 | 55 | -467,375 | 1 | 621,468 | 89 | -154,093 | 39 |
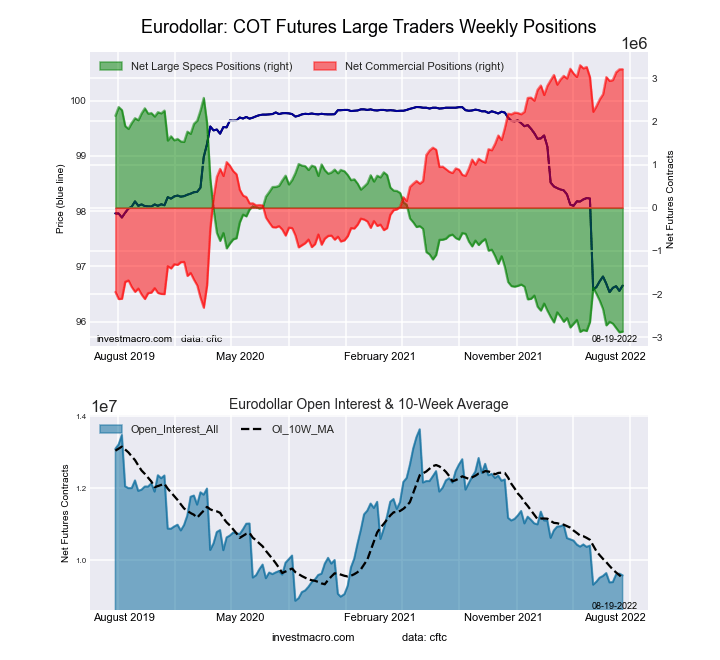
Strength Scores (a normalized measure of Speculator positions over a 3-Year range, from 0 to 100 where above 80 is extreme bullish and below 20 is extreme bearish) show that the US Treasury Bond (69.2 percent) continues to generate the highest spec strength score for bonds and just a edge up from last week’s score of 69.1 percent. The Fed Funds (50.6 percent) comes in as the next highest bonds market in strength scores and the only other one above its 3-year midpoint of 50 percent. On the downside, the Eurodollar (0.3 percent), the 5-Year Bond (1.2 percent) and the 10-Year Bond (17.2 percent) come in as the lowest strength scores currently and are all in a bearish extreme level (below 20 percent).
Strength Statistics:
Fed Funds (50.6 percent) vs Fed Funds previous week (39.7 percent)
2-Year Bond (39.0 percent) vs 2-Year Bond previous week (47.5 percent)
5-Year Bond (1.2 percent) vs 5-Year Bond previous week (21.6 percent)
10-Year Bond (17.2 percent) vs 10-Year Bond previous week (28.9 percent)
Ultra 10-Year Bond (20.5 percent) vs Ultra 10-Year Bond previous week (16.7 percent)
US Treasury Bond (69.2 percent) vs US Treasury Bond previous week (69.1 percent)
Ultra US Treasury Bond (32.3 percent) vs Ultra US Treasury Bond previous week (37.8 percent)
Eurodollar (0.3 percent) vs Eurodollar previous week (0.0 percent)
Strength Score Trends (or move index, calculates the 6-week changes in strength scores) showed that all of the bonds markets this week had negative trend scores. The Fed Funds (-0.9 percent) had the least negative trend score followed by the Ultra 10-Year Bond (-2.4 percent) and the US Treasury Bond (-6.4 percent). The most negative downside trend scores were led by the 5-Year Bond (-37.4 percent) followed by the 10-Year Bond (-29.3 percent), the 2-Year Bond (-25.6 percent) and the Ultra US Treasury Bond (-23.0 percent).
Strength Trend Statistics:
Fed Funds (-0.9 percent) vs Fed Funds previous week (-14.8 percent)
2-Year Bond (-25.6 percent) vs 2-Year Bond previous week (-14.2 percent)
5-Year Bond (-37.4 percent) vs 5-Year Bond previous week (-26.0 percent)
10-Year Bond (-29.3 percent) vs 10-Year Bond previous week (-15.9 percent)
Ultra 10-Year Bond (-2.4 percent) vs Ultra 10-Year Bond previous week (-5.4 percent)
US Treasury Bond (-6.4 percent) vs US Treasury Bond previous week (-3.0 percent)
Ultra US Treasury Bond (-23.0 percent) vs Ultra US Treasury Bond previous week (-9.5 percent)
Eurodollar (-9.6 percent) vs Eurodollar previous week (-13.4 percent)
This week’s current strength score (the trader positioning range over the past three years, measured from 0 to 100) shows the speculators are currently Bearish-Extreme with a score of 0.3 percent. The commercials are Bullish-Extreme with a score of 98.4 percent and the small traders (not shown in chart) are Bearish with a score of 29.9 percent.
| 3-Month Eurodollars Statistics | SPECULATORS | COMMERCIALS | SMALL TRADERS |
| – Percent of Open Interest Longs: | 4.5 | 71.3 | 4.5 |
| – Percent of Open Interest Shorts: | 34.4 | 37.8 | 8.1 |
| – Net Position: | -2,869,877 | 3,208,503 | -338,626 |
| – Gross Longs: | 429,027 | 6,835,497 | 434,367 |
| – Gross Shorts: | 3,298,904 | 3,626,994 | 772,993 |
| – Long to Short Ratio: | 0.1 to 1 | 1.9 to 1 | 0.6 to 1 |
| NET POSITION TREND: | |||
| – Strength Index Score (3 Year Range Pct): | 0.3 | 98.4 | 29.9 |
| – Strength Index Reading (3 Year Range): | Bearish-Extreme | Bullish-Extreme | Bearish |
| NET POSITION MOVEMENT INDEX: | |||
| – 6-Week Change in Strength Index: | -9.6 | 10.3 | -13.0 |
This week’s current strength score (the trader positioning range over the past three years, measured from 0 to 100) shows the speculators are currently Bullish with a score of 50.6 percent. The commercials are Bearish with a score of 48.6 percent and the small traders (not shown in chart) are Bullish with a score of 71.1 percent.
| 30-Day Federal Funds Statistics | SPECULATORS | COMMERCIALS | SMALL TRADERS |
| – Percent of Open Interest Longs: | 14.6 | 71.0 | 2.6 |
| – Percent of Open Interest Shorts: | 9.3 | 76.6 | 2.3 |
| – Net Position: | 88,658 | -93,150 | 4,492 |
| – Gross Longs: | 243,264 | 1,183,007 | 43,138 |
| – Gross Shorts: | 154,606 | 1,276,157 | 38,646 |
| – Long to Short Ratio: | 1.6 to 1 | 0.9 to 1 | 1.1 to 1 |
| NET POSITION TREND: | |||
| – Strength Index Score (3 Year Range Pct): | 50.6 | 48.6 | 71.1 |
| – Strength Index Reading (3 Year Range): | Bullish | Bearish | Bullish |
| NET POSITION MOVEMENT INDEX: | |||
| – 6-Week Change in Strength Index: | -0.9 | -0.6 | 30.8 |
This week’s current strength score (the trader positioning range over the past three years, measured from 0 to 100) shows the speculators are currently Bearish with a score of 39.0 percent. The commercials are Bullish with a score of 74.4 percent and the small traders (not shown in chart) are Bearish with a score of 33.8 percent.
| 2-Year Treasury Note Statistics | SPECULATORS | COMMERCIALS | SMALL TRADERS |
| – Percent of Open Interest Longs: | 8.5 | 80.9 | 7.4 |
| – Percent of Open Interest Shorts: | 18.6 | 69.2 | 9.1 |
| – Net Position: | -214,048 | 249,553 | -35,505 |
| – Gross Longs: | 180,858 | 1,718,780 | 158,017 |
| – Gross Shorts: | 394,906 | 1,469,227 | 193,522 |
| – Long to Short Ratio: | 0.5 to 1 | 1.2 to 1 | 0.8 to 1 |
| NET POSITION TREND: | |||
| – Strength Index Score (3 Year Range Pct): | 39.0 | 74.4 | 33.8 |
| – Strength Index Reading (3 Year Range): | Bearish | Bullish | Bearish |
| NET POSITION MOVEMENT INDEX: | |||
| – 6-Week Change in Strength Index: | -25.6 | 17.1 | 20.4 |
This week’s current strength score (the trader positioning range over the past three years, measured from 0 to 100) shows the speculators are currently Bearish-Extreme with a score of 1.2 percent. The commercials are Bullish-Extreme with a score of 89.0 percent and the small traders (not shown in chart) are Bearish with a score of 38.7 percent.
| 5-Year Treasury Note Statistics | SPECULATORS | COMMERCIALS | SMALL TRADERS |
| – Percent of Open Interest Longs: | 6.5 | 83.7 | 7.4 |
| – Percent of Open Interest Shorts: | 18.0 | 68.4 | 11.2 |
| – Net Position: | -467,375 | 621,468 | -154,093 |
| – Gross Longs: | 265,741 | 3,402,691 | 299,503 |
| – Gross Shorts: | 733,116 | 2,781,223 | 453,596 |
| – Long to Short Ratio: | 0.4 to 1 | 1.2 to 1 | 0.7 to 1 |
| NET POSITION TREND: | |||
| – Strength Index Score (3 Year Range Pct): | 1.2 | 89.0 | 38.7 |
| – Strength Index Reading (3 Year Range): | Bearish-Extreme | Bullish-Extreme | Bearish |
| NET POSITION MOVEMENT INDEX: | |||
| – 6-Week Change in Strength Index: | -37.4 | 26.4 | -1.0 |
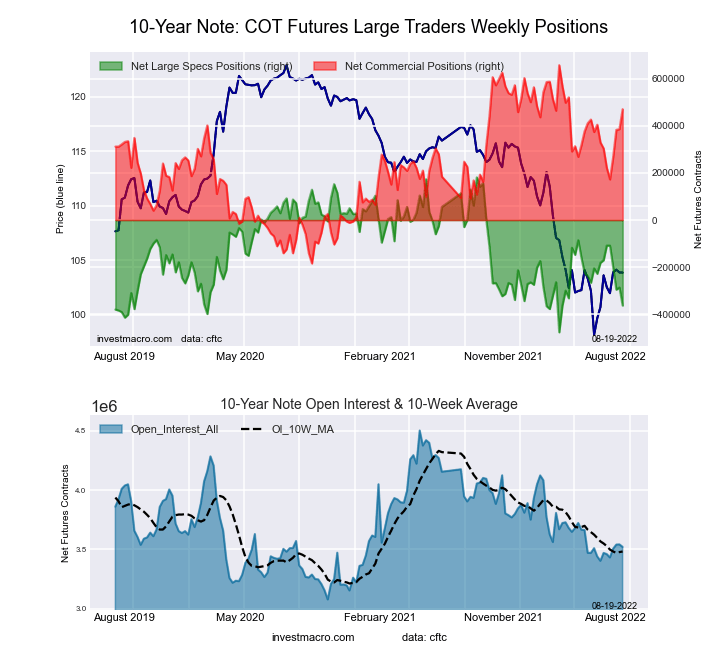
This week’s current strength score (the trader positioning range over the past three years, measured from 0 to 100) shows the speculators are currently Bearish-Extreme with a score of 17.2 percent. The commercials are Bullish with a score of 77.8 percent and the small traders (not shown in chart) are Bullish with a score of 54.1 percent.
| 10-Year Treasury Note Statistics | SPECULATORS | COMMERCIALS | SMALL TRADERS |
| – Percent of Open Interest Longs: | 6.0 | 81.5 | 9.4 |
| – Percent of Open Interest Shorts: | 16.3 | 68.2 | 12.5 |
| – Net Position: | -363,128 | 470,732 | -107,604 |
| – Gross Longs: | 209,821 | 2,870,103 | 332,003 |
| – Gross Shorts: | 572,949 | 2,399,371 | 439,607 |
| – Long to Short Ratio: | 0.4 to 1 | 1.2 to 1 | 0.8 to 1 |
| NET POSITION TREND: | |||
| – Strength Index Score (3 Year Range Pct): | 17.2 | 77.8 | 54.1 |
| – Strength Index Reading (3 Year Range): | Bearish-Extreme | Bullish | Bullish |
| NET POSITION MOVEMENT INDEX: | |||
| – 6-Week Change in Strength Index: | -29.3 | 19.8 | 6.0 |
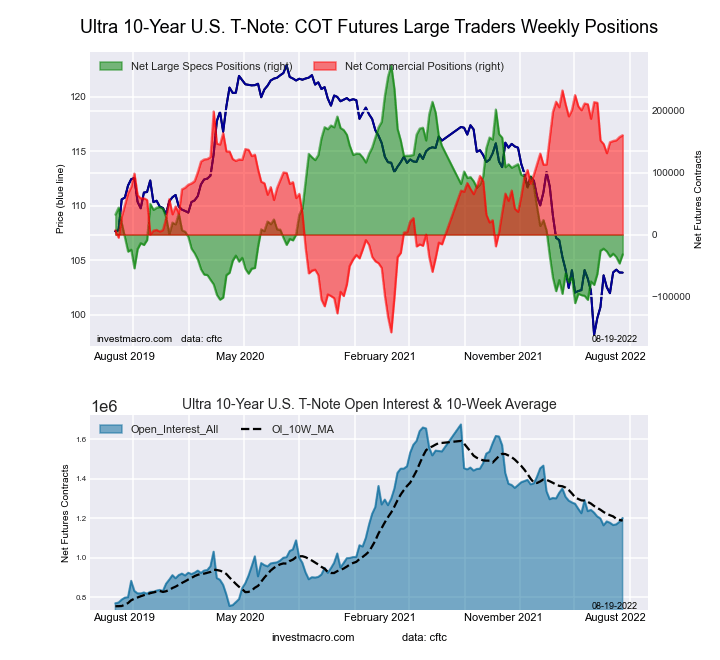
This week’s current strength score (the trader positioning range over the past three years, measured from 0 to 100) shows the speculators are currently Bearish with a score of 20.5 percent. The commercials are Bullish-Extreme with a score of 81.5 percent and the small traders (not shown in chart) are Bearish with a score of 41.8 percent.
| Ultra 10-Year Notes Statistics | SPECULATORS | COMMERCIALS | SMALL TRADERS |
| – Percent of Open Interest Longs: | 4.6 | 84.7 | 10.0 |
| – Percent of Open Interest Shorts: | 7.2 | 71.3 | 20.7 |
| – Net Position: | -32,000 | 160,566 | -128,566 |
| – Gross Longs: | 54,965 | 1,016,979 | 120,448 |
| – Gross Shorts: | 86,965 | 856,413 | 249,014 |
| – Long to Short Ratio: | 0.6 to 1 | 1.2 to 1 | 0.5 to 1 |
| NET POSITION TREND: | |||
| – Strength Index Score (3 Year Range Pct): | 20.5 | 81.5 | 41.8 |
| – Strength Index Reading (3 Year Range): | Bearish | Bullish-Extreme | Bearish |
| NET POSITION MOVEMENT INDEX: | |||
| – 6-Week Change in Strength Index: | -2.4 | 3.7 | -3.3 |
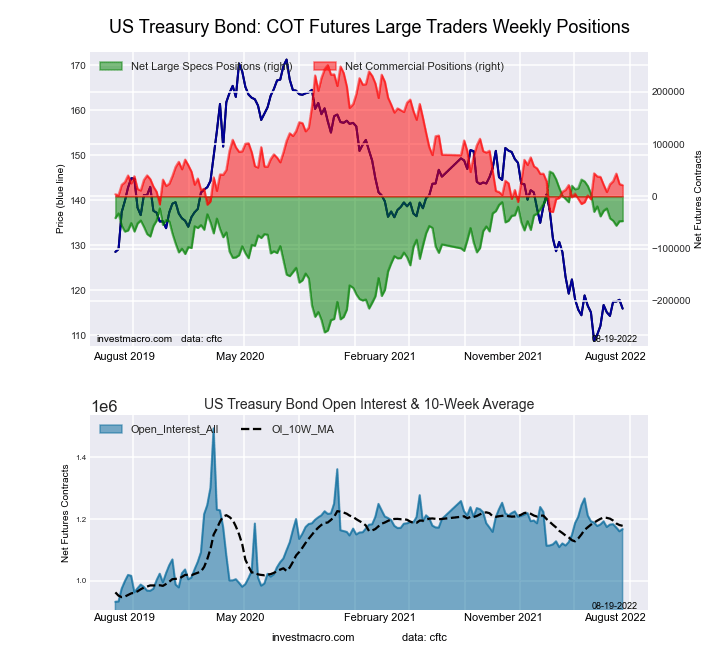
This week’s current strength score (the trader positioning range over the past three years, measured from 0 to 100) shows the speculators are currently Bullish with a score of 69.2 percent. The commercials are Bearish-Extreme with a score of 18.2 percent and the small traders (not shown in chart) are Bullish with a score of 73.3 percent.
| US Treasury Bonds Statistics | SPECULATORS | COMMERCIALS | SMALL TRADERS |
| – Percent of Open Interest Longs: | 7.6 | 76.8 | 14.4 |
| – Percent of Open Interest Shorts: | 11.7 | 74.9 | 12.2 |
| – Net Position: | -47,325 | 21,207 | 26,118 |
| – Gross Longs: | 88,791 | 896,481 | 168,447 |
| – Gross Shorts: | 136,116 | 875,274 | 142,329 |
| – Long to Short Ratio: | 0.7 to 1 | 1.0 to 1 | 1.2 to 1 |
| NET POSITION TREND: | |||
| – Strength Index Score (3 Year Range Pct): | 69.2 | 18.2 | 73.3 |
| – Strength Index Reading (3 Year Range): | Bullish | Bearish-Extreme | Bullish |
| NET POSITION MOVEMENT INDEX: | |||
| – 6-Week Change in Strength Index: | -6.4 | -0.3 | 16.2 |
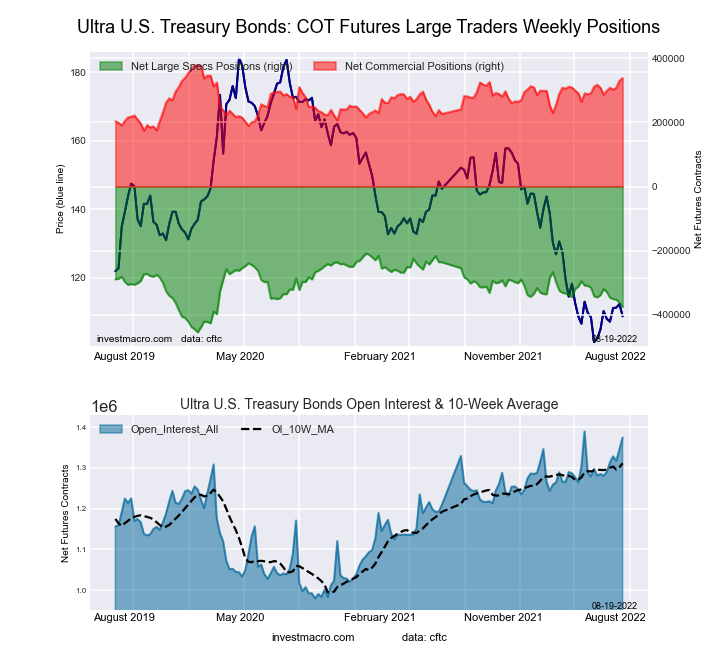
This week’s current strength score (the trader positioning range over the past three years, measured from 0 to 100) shows the speculators are currently Bearish with a score of 32.3 percent. The commercials are Bullish-Extreme with a score of 80.2 percent and the small traders (not shown in chart) are Bullish with a score of 55.1 percent.
| Ultra US Treasury Bonds Statistics | SPECULATORS | COMMERCIALS | SMALL TRADERS |
| – Percent of Open Interest Longs: | 4.0 | 82.5 | 11.0 |
| – Percent of Open Interest Shorts: | 31.3 | 57.9 | 8.3 |
| – Net Position: | -374,923 | 337,614 | 37,309 |
| – Gross Longs: | 55,063 | 1,133,222 | 150,925 |
| – Gross Shorts: | 429,986 | 795,608 | 113,616 |
| – Long to Short Ratio: | 0.1 to 1 | 1.4 to 1 | 1.3 to 1 |
| NET POSITION TREND: | |||
| – Strength Index Score (3 Year Range Pct): | 32.3 | 80.2 | 55.1 |
| – Strength Index Reading (3 Year Range): | Bearish | Bullish-Extreme | Bullish |
| NET POSITION MOVEMENT INDEX: | |||
| – 6-Week Change in Strength Index: | -23.0 | 25.3 | 3.3 |
Article By InvestMacro – Receive our weekly COT Reports by Email
*COT Report: The COT data, released weekly to the public each Friday, is updated through the most recent Tuesday (data is 3 days old) and shows a quick view of how large speculators or non-commercials (for-profit traders) were positioned in the futures markets.
The CFTC categorizes trader positions according to commercial hedgers (traders who use futures contracts for hedging as part of the business), non-commercials (large traders who speculate to realize trading profits) and nonreportable traders (usually small traders/speculators) as well as their open interest (contracts open in the market at time of reporting).
See CFTC criteria here.
By Jeffrey Young, Georgia Institute of Technology You’ve probably heard artificial intelligence models described as…
Source: Barry Dawes (7/23/26) Barry Dawes of Martin Place Securities shares his analysis of the…
By JustMarkets The US stock indices ended Thursday’s session with a notable decline amid a…
By Analytical Department RoboForex USD/JPY soared to 163.81 on Friday, marking a new 40-year high.…
By JustMarkets The US equities ended Wednesday’s session lower amid investor caution ahead of the…
By Analytical Department RoboForex EUR/USD rose to 1.1429 on Thursday, with the US dollar continuing…
This website uses cookies.