
By InvestMacro | COT | Data Tables | COT Leaders | Downloads | COT Newsletter

Here are the latest charts and statistics for the Commitment of Traders (COT) data published by the Commodities Futures Trading Commission (CFTC).
The latest COT data is updated through Tuesday July 19th and shows a quick view of how large traders (for-profit speculators and commercial entities) were positioned in the futures markets.
Weekly Speculator Changes
COT soft commodities speculator bets were mostly higher this week as six out of the eleven soft commodities markets we cover had higher positioning this week while the other five markets had lower contracts.
Leading the weekly gains for soft commodities markets was Sugar (21,293 contracts) with Lean Hogs (4,560 contracts), Cocoa (3,578 contracts), Wheat (1,883 contracts), Soybean Meal (277 contracts) and Live Cattle (57 contracts) also showing higher speculator bets on the week.
Free Reports:
 Get our Weekly Commitment of Traders Reports - See where the biggest traders (Hedge Funds and Commercial Hedgers) are positioned in the futures markets on a weekly basis.
 Download Our Metatrader 4 Indicators – Put Our Free MetaTrader 4 Custom Indicators on your charts when you join our Weekly Newsletter
The softs markets leading the declines in speculator bets this week were Corn (-37,216 contracts) and Soybeans (-12,526 contracts) with Coffee (-6,329 contracts), Cotton (-4,934 contracts) and Soybean Oil (-2,463 contracts) also registering lower bets on the week.

| Jul-19-2022 | OI | OI-Index | Spec-Net | Spec-Index | Com-Net | COM-Index | Smalls-Net | Smalls-Index |
|---|---|---|---|---|---|---|---|---|
| WTI Crude | 1,577,616 | 0 | 271,091 | 1 | -293,689 | 100 | 22,598 | 47 |
| Gold | 524,786 | 21 | 94,955 | 0 | -112,262 | 100 | 17,307 | 0 |
| Silver | 145,247 | 12 | 1,360 | 0 | -8,213 | 100 | 6,853 | 2 |
| Copper | 174,592 | 8 | -23,836 | 25 | 23,745 | 76 | 91 | 26 |
| Palladium | 6,915 | 3 | -3,751 | 2 | 4,302 | 99 | -551 | 12 |
| Platinum | 75,069 | 47 | -4,282 | 2 | -273 | 98 | 4,555 | 26 |
| Natural Gas | 953,325 | 0 | -120,323 | 42 | 86,699 | 58 | 33,624 | 60 |
| Brent | 177,889 | 22 | -41,302 | 42 | 40,843 | 61 | 459 | 15 |
| Heating Oil | 267,576 | 22 | 9,243 | 56 | -23,800 | 46 | 14,557 | 49 |
| Soybeans | 602,987 | 0 | 102,593 | 45 | -74,427 | 61 | -28,166 | 23 |
| Corn | 1,308,458 | 0 | 209,940 | 57 | -165,611 | 48 | -44,329 | 18 |
| Coffee | 196,041 | 3 | 27,979 | 63 | -28,026 | 44 | 47 | 0 |
| Sugar | 703,614 | 0 | 127,162 | 63 | -141,842 | 41 | 14,680 | 26 |
| Wheat | 292,700 | 2 | 6,522 | 28 | 3,173 | 64 | -9,695 | 60 |
Strength Scores
Strength Scores (a normalized measure of Speculator positions over a 3-Year range, from 0 to 100 where above 80 is extreme bullish and below 20 is extreme bearish) show that Soybean Meal (83.5 percent) leads the softs in scores and is currently in a bullish extreme state (above 80 percent). Coffee (63.0 percent) and Sugar (62.8 percent) round out the other soft commodity markets at the top of the strength list while Corn (56.8 percent) comes in next but has been falling steadily in the speculator sentiment for several weeks. On the downside, Live Cattle (6.9 percent) is the weakest in strength scores followed by Cocoa (17.0 percent) and both of these markets are in a bearish extreme level (below 20 percent). Soybean Oil (24.1 percent) and Wheat (27.5 percent) are the next two lowest in scoring.

Strength Statistics:
Corn (56.8 percent) vs Corn previous week (61.6 percent)
Sugar (62.8 percent) vs Sugar previous week (58.4 percent)
Coffee (63.0 percent) vs Coffee previous week (68.5 percent)
Soybeans (45.4 percent) vs Soybeans previous week (49.2 percent)
Soybean Oil (24.1 percent) vs Soybean Oil previous week (25.7 percent)
Soybean Meal (83.5 percent) vs Soybean Meal previous week (83.4 percent)
Live Cattle (6.9 percent) vs Live Cattle previous week (6.8 percent)
Lean Hogs (39.0 percent) vs Lean Hogs previous week (34.0 percent)
Cotton (46.7 percent) vs Cotton previous week (49.8 percent)
Cocoa (17.0 percent) vs Cocoa previous week (13.5 percent)
Wheat (27.5 percent) vs Wheat previous week (25.1 percent)
Strength Trends
Strength Score Trends (or move index, calculates the 6-week changes in strength scores) show that Lean Hogs (20.8 percent) is the far and away leader in the past six weeks trends for soft commodity markets. Soybean Meal (6.1 percent) is the only other positive mover in the latest trends data and reiterates the weakness of the overall softs markets currently. On the downside, Soybean Oil (-34.2 percent) leads the negative trend scores while the next markets with lower trend scores were Corn (-23.2 percent), Soybeans (-22.5 percent), Wheat (-22.6 percent) and Cotton (-21.0 percent).
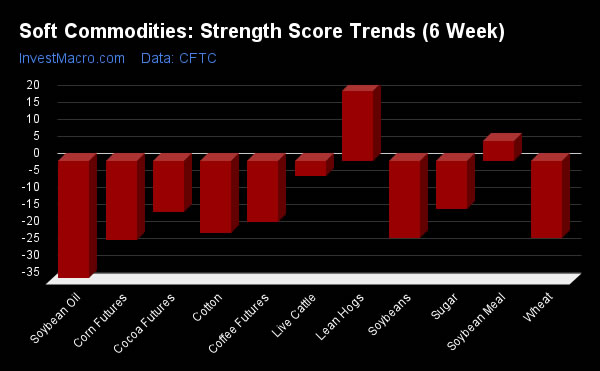
Strength Trend Statistics:
Corn (-23.2 percent) vs Corn previous week (-20.1 percent)
Sugar (-14.0 percent) vs Sugar previous week (-19.7 percent)
Coffee (-18.0 percent) vs Coffee previous week (-7.5 percent)
Soybeans (-22.5 percent) vs Soybeans previous week (-21.6 percent)
Soybean Oil (-34.2 percent) vs Soybean Oil previous week (-30.2 percent)
Soybean Meal (6.1 percent) vs Soybean Meal previous week (10.9 percent)
Live Cattle (-4.4 percent) vs Live Cattle previous week (3.0 percent)
Lean Hogs (20.8 percent) vs Lean Hogs previous week (17.3 percent)
Cotton (-21.0 percent) vs Cotton previous week (-17.9 percent)
Cocoa (-14.8 percent) vs Cocoa previous week (-14.0 percent)
Wheat (-22.6 percent) vs Wheat previous week (-23.0 percent)
Individual Markets:
CORN Futures:
 The CORN large speculator standing this week recorded a net position of 209,940 contracts in the data reported through Tuesday. This was a weekly decrease of -37,216 contracts from the previous week which had a total of 247,156 net contracts.
This week’s current strength score (the trader positioning range over the past three years, measured from 0 to 100) shows the speculators are currently Bullish with a score of 56.8 percent. The commercials are Bearish with a score of 48.3 percent and the small traders (not shown in chart) are Bearish-Extreme with a score of 17.5 percent.
| CORN Futures Statistics | SPECULATORS | COMMERCIALS | SMALL TRADERS |
| – Percent of Open Interest Longs: | 27.4 | 48.2 | 9.8 |
| – Percent of Open Interest Shorts: | 11.4 | 60.9 | 13.2 |
| – Net Position: | 209,940 | -165,611 | -44,329 |
| – Gross Longs: | 358,478 | 631,146 | 127,850 |
| – Gross Shorts: | 148,538 | 796,757 | 172,179 |
| – Long to Short Ratio: | 2.4 to 1 | 0.8 to 1 | 0.7 to 1 |
| NET POSITION TREND: | |||
| – Strength Index Score (3 Year Range Pct): | 56.8 | 48.3 | 17.5 |
| – Strength Index Reading (3 Year Range): | Bullish | Bearish | Bearish-Extreme |
| NET POSITION MOVEMENT INDEX: | |||
| – 6-Week Change in Strength Index: | -23.2 | 24.4 | 5.6 |
SUGAR Futures:
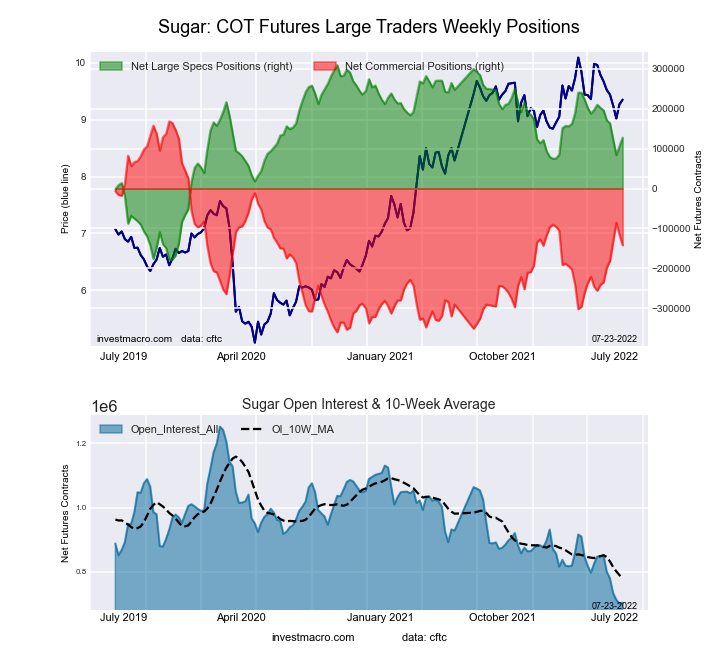 The SUGAR large speculator standing this week recorded a net position of 127,162 contracts in the data reported through Tuesday. This was a weekly gain of 21,293 contracts from the previous week which had a total of 105,869 net contracts.
This week’s current strength score (the trader positioning range over the past three years, measured from 0 to 100) shows the speculators are currently Bullish with a score of 62.8 percent. The commercials are Bearish with a score of 41.3 percent and the small traders (not shown in chart) are Bearish with a score of 26.0 percent.
| SUGAR Futures Statistics | SPECULATORS | COMMERCIALS | SMALL TRADERS |
| – Percent of Open Interest Longs: | 27.3 | 50.2 | 9.5 |
| – Percent of Open Interest Shorts: | 9.2 | 70.4 | 7.4 |
| – Net Position: | 127,162 | -141,842 | 14,680 |
| – Gross Longs: | 192,030 | 353,385 | 66,497 |
| – Gross Shorts: | 64,868 | 495,227 | 51,817 |
| – Long to Short Ratio: | 3.0 to 1 | 0.7 to 1 | 1.3 to 1 |
| NET POSITION TREND: | |||
| – Strength Index Score (3 Year Range Pct): | 62.8 | 41.3 | 26.0 |
| – Strength Index Reading (3 Year Range): | Bullish | Bearish | Bearish |
| NET POSITION MOVEMENT INDEX: | |||
| – 6-Week Change in Strength Index: | -14.0 | 17.6 | -30.2 |
COFFEE Futures:
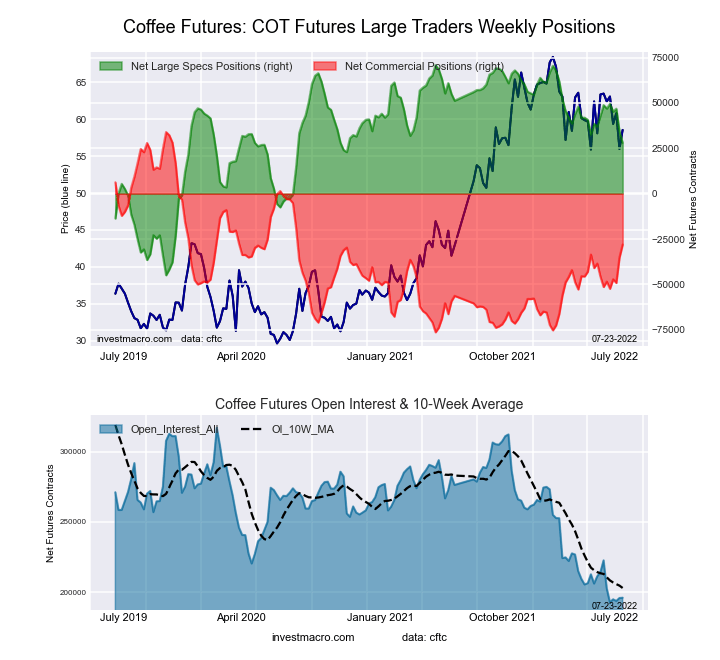 The COFFEE large speculator standing this week recorded a net position of 27,979 contracts in the data reported through Tuesday. This was a weekly decrease of -6,329 contracts from the previous week which had a total of 34,308 net contracts.
This week’s current strength score (the trader positioning range over the past three years, measured from 0 to 100) shows the speculators are currently Bullish with a score of 63.0 percent. The commercials are Bearish with a score of 43.8 percent and the small traders (not shown in chart) are Bearish-Extreme with a score of 0.0 percent.
| COFFEE Futures Statistics | SPECULATORS | COMMERCIALS | SMALL TRADERS |
| – Percent of Open Interest Longs: | 24.0 | 53.4 | 3.9 |
| – Percent of Open Interest Shorts: | 9.7 | 67.7 | 3.8 |
| – Net Position: | 27,979 | -28,026 | 47 |
| – Gross Longs: | 47,036 | 104,664 | 7,570 |
| – Gross Shorts: | 19,057 | 132,690 | 7,523 |
| – Long to Short Ratio: | 2.5 to 1 | 0.8 to 1 | 1.0 to 1 |
| NET POSITION TREND: | |||
| – Strength Index Score (3 Year Range Pct): | 63.0 | 43.8 | 0.0 |
| – Strength Index Reading (3 Year Range): | Bullish | Bearish | Bearish-Extreme |
| NET POSITION MOVEMENT INDEX: | |||
| – 6-Week Change in Strength Index: | -18.0 | 21.2 | -23.3 |
SOYBEANS Futures:
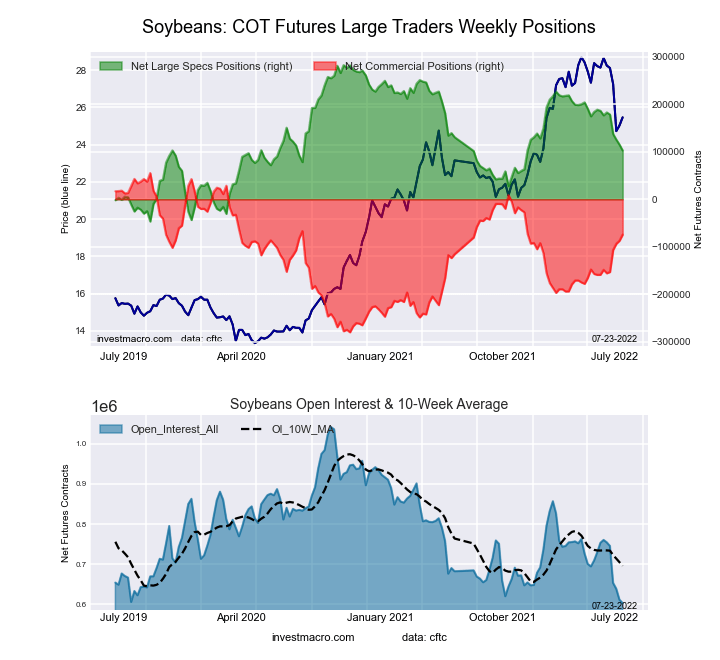
The SOYBEANS large speculator standing this week recorded a net position of 102,593 contracts in the data reported through Tuesday. This was a weekly decline of -12,526 contracts from the previous week which had a total of 115,119 net contracts.
This week’s current strength score (the trader positioning range over the past three years, measured from 0 to 100) shows the speculators are currently Bearish with a score of 45.4 percent. The commercials are Bullish with a score of 61.3 percent and the small traders (not shown in chart) are Bearish with a score of 23.4 percent.
| SOYBEANS Futures Statistics | SPECULATORS | COMMERCIALS | SMALL TRADERS |
| – Percent of Open Interest Longs: | 26.4 | 52.7 | 6.6 |
| – Percent of Open Interest Shorts: | 9.4 | 65.0 | 11.2 |
| – Net Position: | 102,593 | -74,427 | -28,166 |
| – Gross Longs: | 159,262 | 317,597 | 39,543 |
| – Gross Shorts: | 56,669 | 392,024 | 67,709 |
| – Long to Short Ratio: | 2.8 to 1 | 0.8 to 1 | 0.6 to 1 |
| NET POSITION TREND: | |||
| – Strength Index Score (3 Year Range Pct): | 45.4 | 61.3 | 23.4 |
| – Strength Index Reading (3 Year Range): | Bearish | Bullish | Bearish |
| NET POSITION MOVEMENT INDEX: | |||
| – 6-Week Change in Strength Index: | -22.5 | 22.1 | 0.1 |
SOYBEAN OIL Futures:
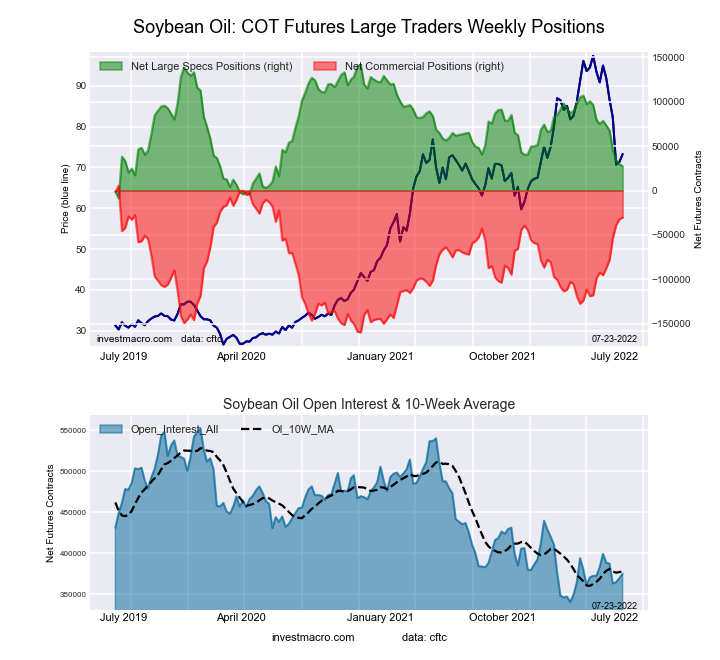 The SOYBEAN OIL large speculator standing this week recorded a net position of 27,325 contracts in the data reported through Tuesday. This was a weekly fall of -2,463 contracts from the previous week which had a total of 29,788 net contracts.
This week’s current strength score (the trader positioning range over the past three years, measured from 0 to 100) shows the speculators are currently Bearish with a score of 24.1 percent. The commercials are Bullish with a score of 78.2 percent and the small traders (not shown in chart) are Bearish with a score of 25.1 percent.
| SOYBEAN OIL Futures Statistics | SPECULATORS | COMMERCIALS | SMALL TRADERS |
| – Percent of Open Interest Longs: | 17.7 | 60.1 | 7.1 |
| – Percent of Open Interest Shorts: | 10.4 | 68.2 | 6.3 |
| – Net Position: | 27,325 | -30,449 | 3,124 |
| – Gross Longs: | 66,220 | 225,283 | 26,605 |
| – Gross Shorts: | 38,895 | 255,732 | 23,481 |
| – Long to Short Ratio: | 1.7 to 1 | 0.9 to 1 | 1.1 to 1 |
| NET POSITION TREND: | |||
| – Strength Index Score (3 Year Range Pct): | 24.1 | 78.2 | 25.1 |
| – Strength Index Reading (3 Year Range): | Bearish | Bullish | Bearish |
| NET POSITION MOVEMENT INDEX: | |||
| – 6-Week Change in Strength Index: | -34.2 | 39.3 | -50.3 |
SOYBEAN MEAL Futures:
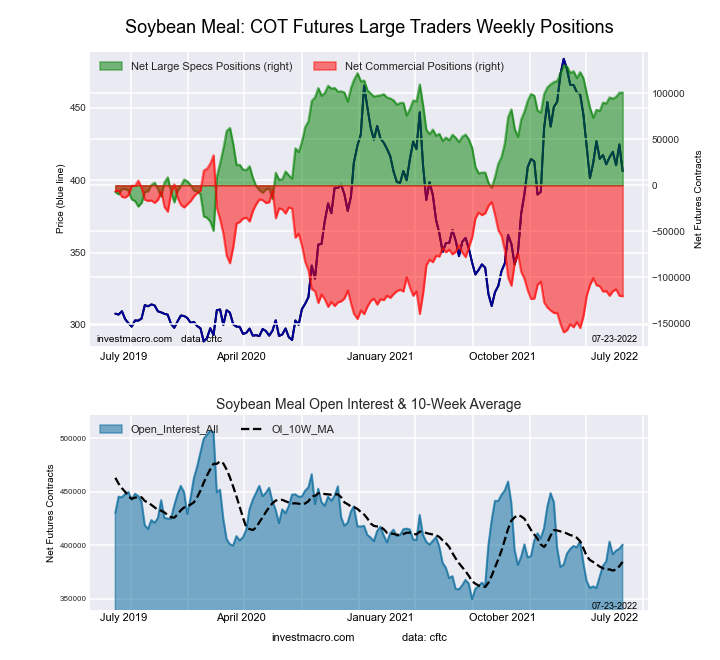 The SOYBEAN MEAL large speculator standing this week recorded a net position of 100,674 contracts in the data reported through Tuesday. This was a weekly rise of 277 contracts from the previous week which had a total of 100,397 net contracts.
This week’s current strength score (the trader positioning range over the past three years, measured from 0 to 100) shows the speculators are currently Bullish-Extreme with a score of 83.5 percent. The commercials are Bearish with a score of 20.4 percent and the small traders (not shown in chart) are Bearish with a score of 34.7 percent.
| SOYBEAN MEAL Futures Statistics | SPECULATORS | COMMERCIALS | SMALL TRADERS |
| – Percent of Open Interest Longs: | 28.3 | 42.1 | 10.9 |
| – Percent of Open Interest Shorts: | 3.1 | 72.1 | 6.0 |
| – Net Position: | 100,674 | -120,304 | 19,630 |
| – Gross Longs: | 113,190 | 168,512 | 43,743 |
| – Gross Shorts: | 12,516 | 288,816 | 24,113 |
| – Long to Short Ratio: | 9.0 to 1 | 0.6 to 1 | 1.8 to 1 |
| NET POSITION TREND: | |||
| – Strength Index Score (3 Year Range Pct): | 83.5 | 20.4 | 34.7 |
| – Strength Index Reading (3 Year Range): | Bullish-Extreme | Bearish | Bearish |
| NET POSITION MOVEMENT INDEX: | |||
| – 6-Week Change in Strength Index: | 6.1 | -2.6 | -30.7 |
LIVE CATTLE Futures:

The LIVE CATTLE large speculator standing this week recorded a net position of 21,956 contracts in the data reported through Tuesday. This was a weekly lift of 57 contracts from the previous week which had a total of 21,899 net contracts.
This week’s current strength score (the trader positioning range over the past three years, measured from 0 to 100) shows the speculators are currently Bearish-Extreme with a score of 6.9 percent. The commercials are Bullish-Extreme with a score of 82.5 percent and the small traders (not shown in chart) are Bullish-Extreme with a score of 83.8 percent.
| LIVE CATTLE Futures Statistics | SPECULATORS | COMMERCIALS | SMALL TRADERS |
| – Percent of Open Interest Longs: | 33.1 | 41.8 | 12.0 |
| – Percent of Open Interest Shorts: | 24.8 | 50.4 | 11.8 |
| – Net Position: | 21,956 | -22,536 | 580 |
| – Gross Longs: | 87,558 | 110,738 | 31,759 |
| – Gross Shorts: | 65,602 | 133,274 | 31,179 |
| – Long to Short Ratio: | 1.3 to 1 | 0.8 to 1 | 1.0 to 1 |
| NET POSITION TREND: | |||
| – Strength Index Score (3 Year Range Pct): | 6.9 | 82.5 | 83.8 |
| – Strength Index Reading (3 Year Range): | Bearish-Extreme | Bullish-Extreme | Bullish-Extreme |
| NET POSITION MOVEMENT INDEX: | |||
| – 6-Week Change in Strength Index: | -4.4 | 2.3 | 6.2 |
LEAN HOGS Futures:

The LEAN HOGS large speculator standing this week recorded a net position of 29,619 contracts in the data reported through Tuesday. This was a weekly advance of 4,560 contracts from the previous week which had a total of 25,059 net contracts.
This week’s current strength score (the trader positioning range over the past three years, measured from 0 to 100) shows the speculators are currently Bearish with a score of 39.0 percent. The commercials are Bullish with a score of 67.8 percent and the small traders (not shown in chart) are Bullish with a score of 55.3 percent.
| LEAN HOGS Futures Statistics | SPECULATORS | COMMERCIALS | SMALL TRADERS |
| – Percent of Open Interest Longs: | 35.7 | 37.7 | 10.6 |
| – Percent of Open Interest Shorts: | 20.9 | 48.5 | 14.5 |
| – Net Position: | 29,619 | -21,680 | -7,939 |
| – Gross Longs: | 71,395 | 75,386 | 21,122 |
| – Gross Shorts: | 41,776 | 97,066 | 29,061 |
| – Long to Short Ratio: | 1.7 to 1 | 0.8 to 1 | 0.7 to 1 |
| NET POSITION TREND: | |||
| – Strength Index Score (3 Year Range Pct): | 39.0 | 67.8 | 55.3 |
| – Strength Index Reading (3 Year Range): | Bearish | Bullish | Bullish |
| NET POSITION MOVEMENT INDEX: | |||
| – 6-Week Change in Strength Index: | 20.8 | -22.0 | -2.8 |
COTTON Futures:
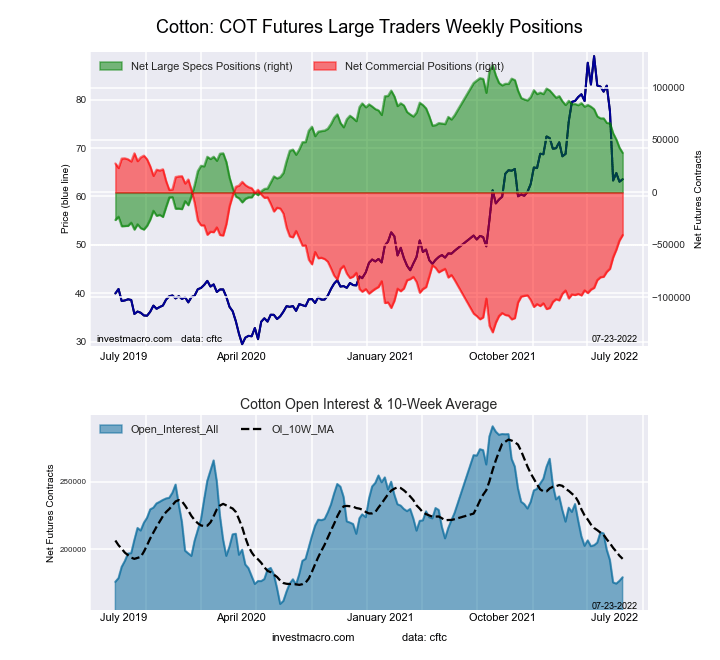 The COTTON large speculator standing this week recorded a net position of 37,751 contracts in the data reported through Tuesday. This was a weekly decline of -4,934 contracts from the previous week which had a total of 42,685 net contracts.
This week’s current strength score (the trader positioning range over the past three years, measured from 0 to 100) shows the speculators are currently Bearish with a score of 46.7 percent. The commercials are Bullish with a score of 54.3 percent and the small traders (not shown in chart) are Bearish with a score of 30.3 percent.
| COTTON Futures Statistics | SPECULATORS | COMMERCIALS | SMALL TRADERS |
| – Percent of Open Interest Longs: | 37.2 | 44.9 | 6.3 |
| – Percent of Open Interest Shorts: | 16.1 | 67.6 | 4.7 |
| – Net Position: | 37,751 | -40,631 | 2,880 |
| – Gross Longs: | 66,520 | 80,429 | 11,313 |
| – Gross Shorts: | 28,769 | 121,060 | 8,433 |
| – Long to Short Ratio: | 2.3 to 1 | 0.7 to 1 | 1.3 to 1 |
| NET POSITION TREND: | |||
| – Strength Index Score (3 Year Range Pct): | 46.7 | 54.3 | 30.3 |
| – Strength Index Reading (3 Year Range): | Bearish | Bullish | Bearish |
| NET POSITION MOVEMENT INDEX: | |||
| – 6-Week Change in Strength Index: | -21.0 | 23.3 | -43.1 |
COCOA Futures:

The COCOA large speculator standing this week recorded a net position of -602 contracts in the data reported through Tuesday. This was a weekly increase of 3,578 contracts from the previous week which had a total of -4,180 net contracts.
This week’s current strength score (the trader positioning range over the past three years, measured from 0 to 100) shows the speculators are currently Bearish-Extreme with a score of 17.0 percent. The commercials are Bullish-Extreme with a score of 84.9 percent and the small traders (not shown in chart) are Bearish-Extreme with a score of 12.8 percent.
| COCOA Futures Statistics | SPECULATORS | COMMERCIALS | SMALL TRADERS |
| – Percent of Open Interest Longs: | 30.4 | 45.4 | 4.2 |
| – Percent of Open Interest Shorts: | 30.6 | 45.7 | 3.7 |
| – Net Position: | -602 | -1,028 | 1,630 |
| – Gross Longs: | 94,072 | 140,649 | 13,132 |
| – Gross Shorts: | 94,674 | 141,677 | 11,502 |
| – Long to Short Ratio: | 1.0 to 1 | 1.0 to 1 | 1.1 to 1 |
| NET POSITION TREND: | |||
| – Strength Index Score (3 Year Range Pct): | 17.0 | 84.9 | 12.8 |
| – Strength Index Reading (3 Year Range): | Bearish-Extreme | Bullish-Extreme | Bearish-Extreme |
| NET POSITION MOVEMENT INDEX: | |||
| – 6-Week Change in Strength Index: | -14.8 | 16.3 | -17.0 |
WHEAT Futures:
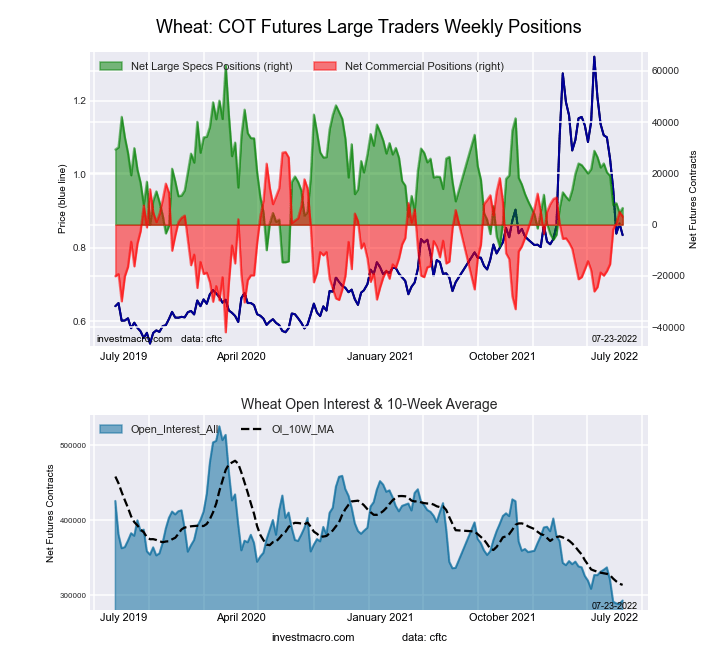 The WHEAT large speculator standing this week recorded a net position of 6,522 contracts in the data reported through Tuesday. This was a weekly advance of 1,883 contracts from the previous week which had a total of 4,639 net contracts.
This week’s current strength score (the trader positioning range over the past three years, measured from 0 to 100) shows the speculators are currently Bearish with a score of 27.5 percent. The commercials are Bullish with a score of 64.2 percent and the small traders (not shown in chart) are Bullish with a score of 60.1 percent.
| WHEAT Futures Statistics | SPECULATORS | COMMERCIALS | SMALL TRADERS |
| – Percent of Open Interest Longs: | 31.3 | 40.5 | 9.4 |
| – Percent of Open Interest Shorts: | 29.1 | 39.4 | 12.7 |
| – Net Position: | 6,522 | 3,173 | -9,695 |
| – Gross Longs: | 91,557 | 118,634 | 27,569 |
| – Gross Shorts: | 85,035 | 115,461 | 37,264 |
| – Long to Short Ratio: | 1.1 to 1 | 1.0 to 1 | 0.7 to 1 |
| NET POSITION TREND: | |||
| – Strength Index Score (3 Year Range Pct): | 27.5 | 64.2 | 60.1 |
| – Strength Index Reading (3 Year Range): | Bearish | Bullish | Bullish |
| NET POSITION MOVEMENT INDEX: | |||
| – 6-Week Change in Strength Index: | -22.6 | 32.8 | -29.5 |
Article By InvestMacro – Receive our weekly COT Reports by Email
*COT Report: The COT data, released weekly to the public each Friday, is updated through the most recent Tuesday (data is 3 days old) and shows a quick view of how large speculators or non-commercials (for-profit traders) were positioned in the futures markets.
The CFTC categorizes trader positions according to commercial hedgers (traders who use futures contracts for hedging as part of the business), non-commercials (large traders who speculate to realize trading profits) and nonreportable traders (usually small traders/speculators) as well as their open interest (contracts open in the market at time of reporting).See CFTC criteria here.

- Geopolitical and macroeconomic conditions continue to pressure market sentiment Jul 20, 2026
- USD/JPY Poised to Continue Gains as Expensive Oil and Lack of Support Weigh on Yen Jul 20, 2026
- COT Metals Charts: Weekly Speculator Bets led by Copper & Steel Jul 18, 2026
- COT Bonds Charts: Weekly Speculator Bets led by 2-Year, SOFR 3M & 5-Year Bonds Jul 18, 2026
- COT Energy Charts: Weekly Speculator Bets led by Brent Oil & Heating Oil Jul 18, 2026
- COT Soft Commodities Charts: Weekly Speculator Bets led by Wheat, Corn & Soybean Meal Jul 18, 2026
- The Bank of Canada kept its interest rate unchanged. Platinum prices reached a three‑week high Jul 16, 2026
- Stock indices rose after the release of US inflation data. China’s GDP slowed sharply Jul 15, 2026
- GBP/USD Awaits Political News: What Will Happen Next Jul 15, 2026
- USD/JPY Holds at Highs: Pressure Lingers on Yen Jul 14, 2026