
By InvestMacro | COT | Data Tables | COT Leaders | Downloads | COT Newsletter

Here are the latest charts and statistics for the Commitment of Traders (COT) data published by the Commodities Futures Trading Commission (CFTC).
The latest COT data is updated through Tuesday July 19th and shows a quick view of how large traders (for-profit speculators and commercial entities) were positioned in the futures markets.
Weekly Speculator Changes
COT bond market speculator bets were mixed evenly this week as four out of the eight bond markets we cover had higher positioning this week while the other four markets had lower speculator contracts.
Leading the weekly gains for the bond markets was the Eurodollar (80,661 contracts) with the 5-Year Bond (33,108 contracts), the Fed Funds Futures (32,523 contracts) and the 2-Year Bond (1,516 contracts) also showing positive changes for the week.
Free Reports:
 Sign Up for Our Stock Market Newsletter – Get updated on News, Charts & Rankings of Public Companies when you join our Stocks Newsletter
 Get our Weekly Commitment of Traders Reports - See where the biggest traders (Hedge Funds and Commercial Hedgers) are positioned in the futures markets on a weekly basis.
The bond markets leading the declines in speculator bets this week were the Long US Bond (-18,884 contracts) with the Ultra US Bond (-17,487 contracts) coming in a close second while the Ultra 10-Year (-8,368 contracts) and the 10-Year Bond (-333 contracts) also saw lower speculator bets on the week.

| Jul-19-2022 | OI | OI-Index | Spec-Net | Spec-Index | Com-Net | COM-Index | Smalls-Net | Smalls-Index |
|---|---|---|---|---|---|---|---|---|
| Eurodollar | 9,390,825 | 11 | -2,643,905 | 4 | 2,937,912 | 94 | -294,007 | 40 |
| FedFunds | 1,769,139 | 59 | 113,578 | 54 | -105,032 | 47 | -8,546 | 38 |
| 2-Year | 2,079,265 | 13 | -63,053 | 70 | 141,849 | 51 | -78,796 | 16 |
| Long T-Bond | 1,182,312 | 44 | -42,102 | 71 | 23,004 | 19 | 19,098 | 68 |
| 10-Year | 3,431,246 | 25 | -108,704 | 56 | 172,612 | 42 | -63,908 | 64 |
| 5-Year | 3,916,097 | 47 | -258,015 | 38 | 400,930 | 62 | -142,915 | 42 |
Strength Scores
Strength Scores (a normalized measure of Speculator positions over a 3-Year range, from 0 to 100 where above 80 is extreme bullish and below 20 is extreme bearish) show that the US Treasury Bond (70.9 percent) continues to lead the bonds category in sentiment. The 2-Year Bond (69.5 percent) comes in as the next highest bonds market in strength scores followed by the 10-Year Bond (55.9 percent) and the Fed Funds (53.6 percent). On the downside, the Eurodollar (4.3 percent) and the Ultra 10-Year Bond (19.5 percent) come in at the lowest strength levels currently and are both in bearish extreme standings this week (below 20 percent). The next lowest strength scores are seen in the 5-Year Bond (37.9 percent) and the Ultra US Treasury Bond (44.1 percent).

Strength Statistics:
Fed Funds (53.6 percent) vs Fed Funds previous week (49.6 percent)
2-Year Bond (69.5 percent) vs 2-Year Bond previous week (69.2 percent)
5-Year Bond (37.9 percent) vs 5-Year Bond previous week (32.1 percent)
10-Year Bond (55.9 percent) vs 10-Year Bond previous week (56.0 percent)
Ultra 10-Year Bond (19.5 percent) vs Ultra 10-Year Bond previous week (21.7 percent)
US Treasury Bond (70.9 percent) vs US Treasury Bond previous week (77.0 percent)
Ultra US Treasury Bond (44.1 percent) vs Ultra US Treasury Bond previous week (51.3 percent)
Eurodollar (4.3 percent) vs Eurodollar previous week (2.8 percent)
Strength Trends
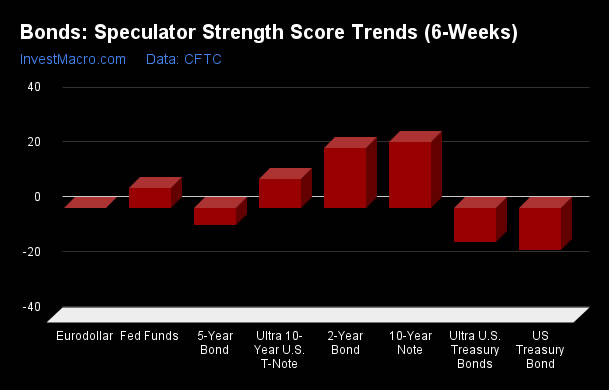
Strength Score Trends (or move index, calculates the 6-week changes in strength scores) show that the 10-Year Bond (23.9 percent) leads the past six weeks trends for bonds currently. The 2-Year Bond (21.7 percent), the Ultra 10-Year Bond (10.4 percent) and the Fed Funds (7.3 percent) fill out the rest of the positive movers in the latest trends data. The US Treasury Bond (-15.3 percent) leads the downside trend scores currently while the next markets with negative trend scores were the Ultra US Treasury Bond (-12.6 percent) and the 5-Year Bond (-6.2 percent).
Strength Trend Statistics:
Fed Funds (7.3 percent) vs Fed Funds previous week (6.9 percent)
2-Year Bond (21.7 percent) vs 2-Year Bond previous week (12.8 percent)
5-Year Bond (-6.2 percent) vs 5-Year Bond previous week (-12.9 percent)
10-Year Bond (23.9 percent) vs 10-Year Bond previous week (19.8 percent)
Ultra 10-Year Bond (10.4 percent) vs Ultra 10-Year Bond previous week (20.3 percent)
US Treasury Bond (-15.3 percent) vs US Treasury Bond previous week (-14.0 percent)
Ultra US Treasury Bond (-12.6 percent) vs Ultra US Treasury Bond previous week (-7.8 percent)
Eurodollar (0.0 percent) vs Eurodollar (2.4 percent)
3-Month Eurodollars Futures:
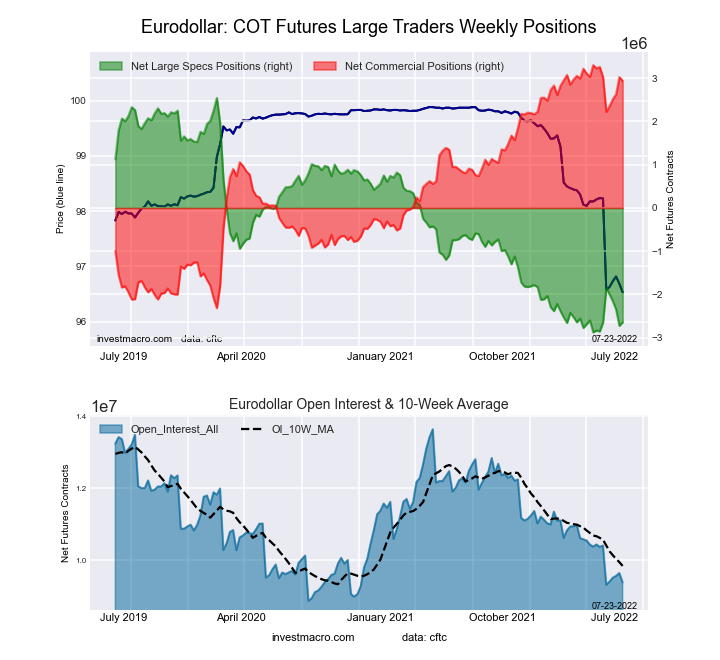 The 3-Month Eurodollars large speculator standing this week resulted in a net position of -2,643,905 contracts in the data reported through Tuesday. This was a weekly lift of 80,661 contracts from the previous week which had a total of -2,724,566 net contracts.
This week’s current strength score (the trader positioning range over the past three years, measured from 0 to 100) shows the speculators are currently Bearish-Extreme with a score of 4.3 percent. The commercials are Bullish-Extreme with a score of 93.5 percent and the small traders (not shown in chart) are Bearish with a score of 39.7 percent.
| 3-Month Eurodollars Statistics | SPECULATORS | COMMERCIALS | SMALL TRADERS |
| – Percent of Open Interest Longs: | 4.9 | 71.7 | 4.4 |
| – Percent of Open Interest Shorts: | 33.0 | 40.4 | 7.5 |
| – Net Position: | -2,643,905 | 2,937,912 | -294,007 |
| – Gross Longs: | 455,567 | 6,735,605 | 413,100 |
| – Gross Shorts: | 3,099,472 | 3,797,693 | 707,107 |
| – Long to Short Ratio: | 0.1 to 1 | 1.8 to 1 | 0.6 to 1 |
| NET POSITION TREND: | |||
| – Strength Index Score (3 Year Range Pct): | 4.3 | 93.5 | 39.7 |
| – Strength Index Reading (3 Year Range): | Bearish-Extreme | Bullish-Extreme | Bearish |
| NET POSITION MOVEMENT INDEX: | |||
| – 6-Week Change in Strength Index: | 0.0 | -1.5 | 18.3 |
Individual Markets:
30-Day Federal Funds Futures:
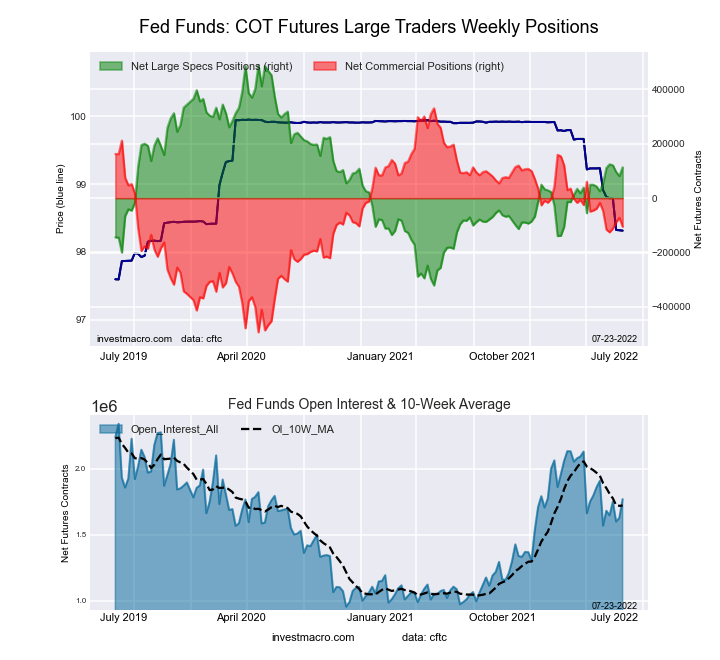 The 30-Day Federal Funds large speculator standing this week resulted in a net position of 113,578 contracts in the data reported through Tuesday. This was a weekly lift of 32,523 contracts from the previous week which had a total of 81,055 net contracts.
This week’s current strength score (the trader positioning range over the past three years, measured from 0 to 100) shows the speculators are currently Bullish with a score of 53.6 percent. The commercials are Bearish with a score of 47.1 percent and the small traders (not shown in chart) are Bearish with a score of 38.0 percent.
| 30-Day Federal Funds Statistics | SPECULATORS | COMMERCIALS | SMALL TRADERS |
| – Percent of Open Interest Longs: | 14.0 | 72.9 | 1.8 |
| – Percent of Open Interest Shorts: | 7.6 | 78.9 | 2.3 |
| – Net Position: | 113,578 | -105,032 | -8,546 |
| – Gross Longs: | 248,072 | 1,290,344 | 31,928 |
| – Gross Shorts: | 134,494 | 1,395,376 | 40,474 |
| – Long to Short Ratio: | 1.8 to 1 | 0.9 to 1 | 0.8 to 1 |
| NET POSITION TREND: | |||
| – Strength Index Score (3 Year Range Pct): | 53.6 | 47.1 | 38.0 |
| – Strength Index Reading (3 Year Range): | Bullish | Bearish | Bearish |
| NET POSITION MOVEMENT INDEX: | |||
| – 6-Week Change in Strength Index: | 7.3 | -6.9 | -5.7 |
2-Year Treasury Note Futures:
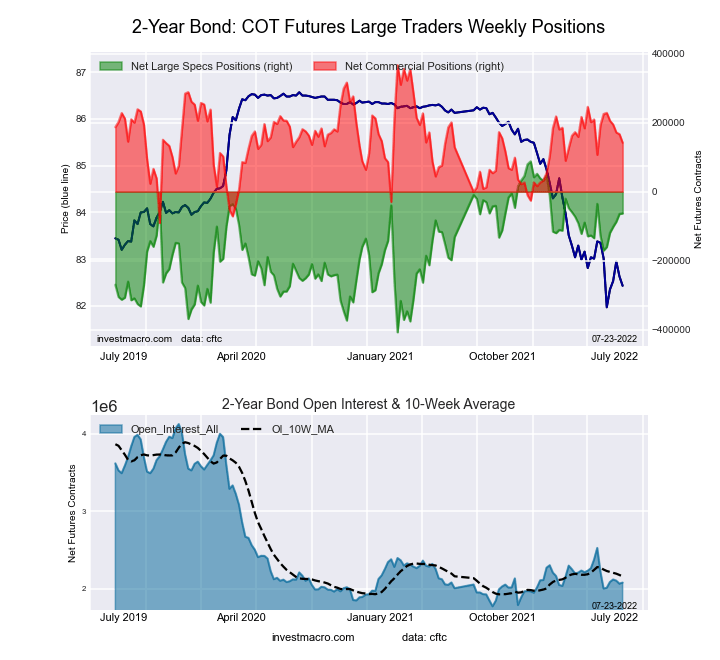
The 2-Year Treasury Note large speculator standing this week resulted in a net position of -63,053 contracts in the data reported through Tuesday. This was a weekly increase of 1,516 contracts from the previous week which had a total of -64,569 net contracts.
This week’s current strength score (the trader positioning range over the past three years, measured from 0 to 100) shows the speculators are currently Bullish with a score of 69.5 percent. The commercials are Bullish with a score of 50.9 percent and the small traders (not shown in chart) are Bearish-Extreme with a score of 15.7 percent.
| 2-Year Treasury Note Statistics | SPECULATORS | COMMERCIALS | SMALL TRADERS |
| – Percent of Open Interest Longs: | 13.4 | 78.1 | 6.6 |
| – Percent of Open Interest Shorts: | 16.5 | 71.3 | 10.4 |
| – Net Position: | -63,053 | 141,849 | -78,796 |
| – Gross Longs: | 279,480 | 1,623,897 | 137,606 |
| – Gross Shorts: | 342,533 | 1,482,048 | 216,402 |
| – Long to Short Ratio: | 0.8 to 1 | 1.1 to 1 | 0.6 to 1 |
| NET POSITION TREND: | |||
| – Strength Index Score (3 Year Range Pct): | 69.5 | 50.9 | 15.7 |
| – Strength Index Reading (3 Year Range): | Bullish | Bullish | Bearish-Extreme |
| NET POSITION MOVEMENT INDEX: | |||
| – 6-Week Change in Strength Index: | 21.7 | -18.2 | -10.1 |
5-Year Treasury Note Futures:
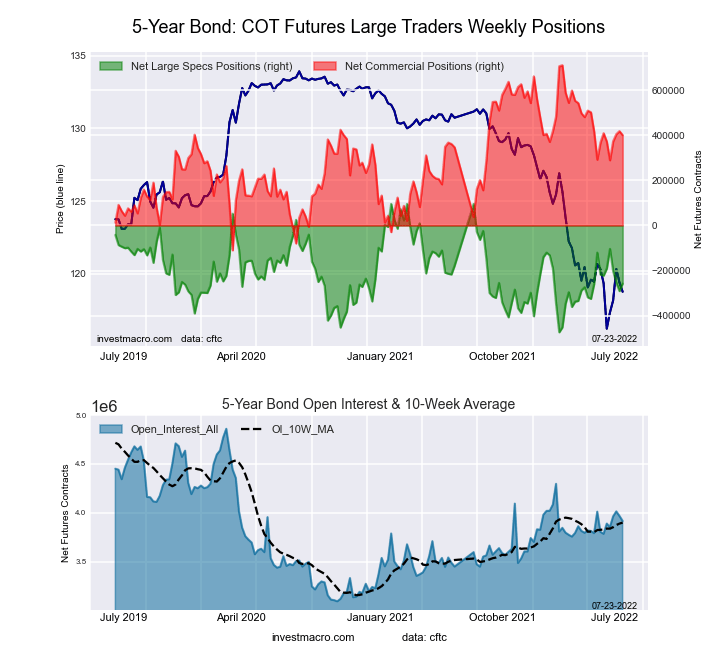
The 5-Year Treasury Note large speculator standing this week resulted in a net position of -258,015 contracts in the data reported through Tuesday. This was a weekly increase of 33,108 contracts from the previous week which had a total of -291,123 net contracts.
This week’s current strength score (the trader positioning range over the past three years, measured from 0 to 100) shows the speculators are currently Bearish with a score of 37.9 percent. The commercials are Bullish with a score of 62.2 percent and the small traders (not shown in chart) are Bearish with a score of 41.7 percent.
| 5-Year Treasury Note Statistics | SPECULATORS | COMMERCIALS | SMALL TRADERS |
| – Percent of Open Interest Longs: | 7.3 | 84.3 | 7.4 |
| – Percent of Open Interest Shorts: | 13.9 | 74.1 | 11.0 |
| – Net Position: | -258,015 | 400,930 | -142,915 |
| – Gross Longs: | 284,416 | 3,302,273 | 289,136 |
| – Gross Shorts: | 542,431 | 2,901,343 | 432,051 |
| – Long to Short Ratio: | 0.5 to 1 | 1.1 to 1 | 0.7 to 1 |
| NET POSITION TREND: | |||
| – Strength Index Score (3 Year Range Pct): | 37.9 | 62.2 | 41.7 |
| – Strength Index Reading (3 Year Range): | Bearish | Bullish | Bearish |
| NET POSITION MOVEMENT INDEX: | |||
| – 6-Week Change in Strength Index: | -6.2 | -1.0 | 12.0 |
10-Year Treasury Note Futures:
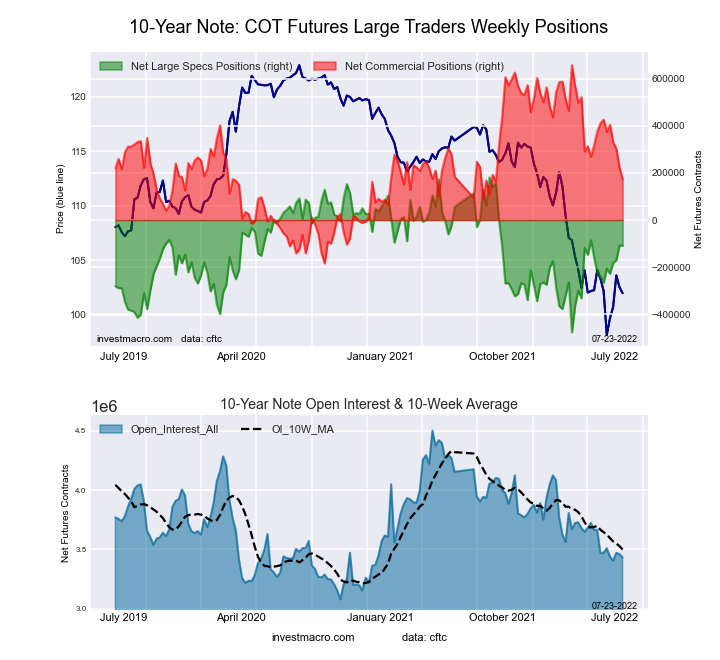 The 10-Year Treasury Note large speculator standing this week resulted in a net position of -108,704 contracts in the data reported through Tuesday. This was a weekly lowering of -333 contracts from the previous week which had a total of -108,371 net contracts.
This week’s current strength score (the trader positioning range over the past three years, measured from 0 to 100) shows the speculators are currently Bullish with a score of 55.9 percent. The commercials are Bearish with a score of 42.4 percent and the small traders (not shown in chart) are Bullish with a score of 64.3 percent.
| 10-Year Treasury Note Statistics | SPECULATORS | COMMERCIALS | SMALL TRADERS |
| – Percent of Open Interest Longs: | 10.2 | 77.4 | 9.8 |
| – Percent of Open Interest Shorts: | 13.4 | 72.4 | 11.6 |
| – Net Position: | -108,704 | 172,612 | -63,908 |
| – Gross Longs: | 351,679 | 2,655,676 | 335,131 |
| – Gross Shorts: | 460,383 | 2,483,064 | 399,039 |
| – Long to Short Ratio: | 0.8 to 1 | 1.1 to 1 | 0.8 to 1 |
| NET POSITION TREND: | |||
| – Strength Index Score (3 Year Range Pct): | 55.9 | 42.4 | 64.3 |
| – Strength Index Reading (3 Year Range): | Bullish | Bearish | Bullish |
| NET POSITION MOVEMENT INDEX: | |||
| – 6-Week Change in Strength Index: | 23.9 | -30.2 | 22.6 |
Ultra 10-Year Notes Futures:
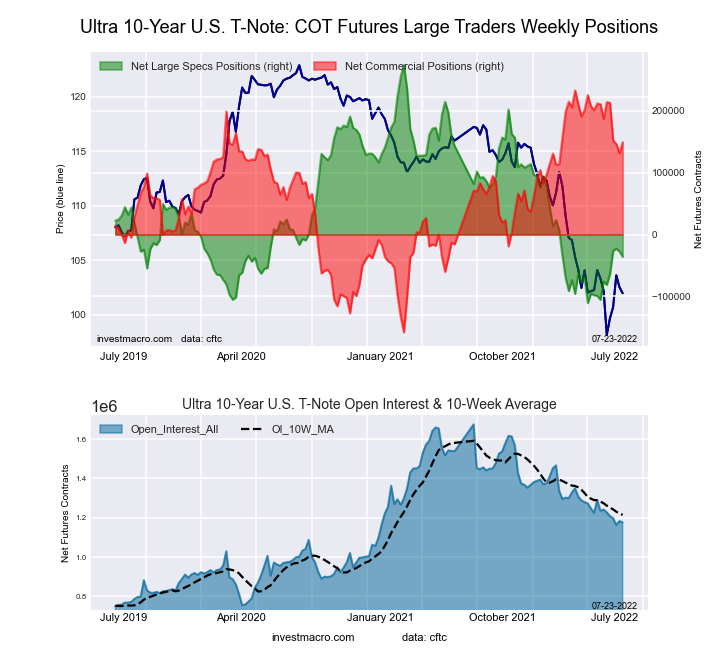 The Ultra 10-Year Notes large speculator standing this week resulted in a net position of -35,707 contracts in the data reported through Tuesday. This was a weekly fall of -8,368 contracts from the previous week which had a total of -27,339 net contracts.
This week’s current strength score (the trader positioning range over the past three years, measured from 0 to 100) shows the speculators are currently Bearish-Extreme with a score of 19.5 percent. The commercials are Bullish with a score of 78.6 percent and the small traders (not shown in chart) are Bullish with a score of 51.1 percent.
| Ultra 10-Year Notes Statistics | SPECULATORS | COMMERCIALS | SMALL TRADERS |
| – Percent of Open Interest Longs: | 5.2 | 82.8 | 11.6 |
| – Percent of Open Interest Shorts: | 8.2 | 70.1 | 21.2 |
| – Net Position: | -35,707 | 149,258 | -113,551 |
| – Gross Longs: | 61,232 | 974,246 | 136,055 |
| – Gross Shorts: | 96,939 | 824,988 | 249,606 |
| – Long to Short Ratio: | 0.6 to 1 | 1.2 to 1 | 0.5 to 1 |
| NET POSITION TREND: | |||
| – Strength Index Score (3 Year Range Pct): | 19.5 | 78.6 | 51.1 |
| – Strength Index Reading (3 Year Range): | Bearish-Extreme | Bullish | Bullish |
| NET POSITION MOVEMENT INDEX: | |||
| – 6-Week Change in Strength Index: | 10.4 | -9.7 | -1.5 |
US Treasury Bonds Futures:
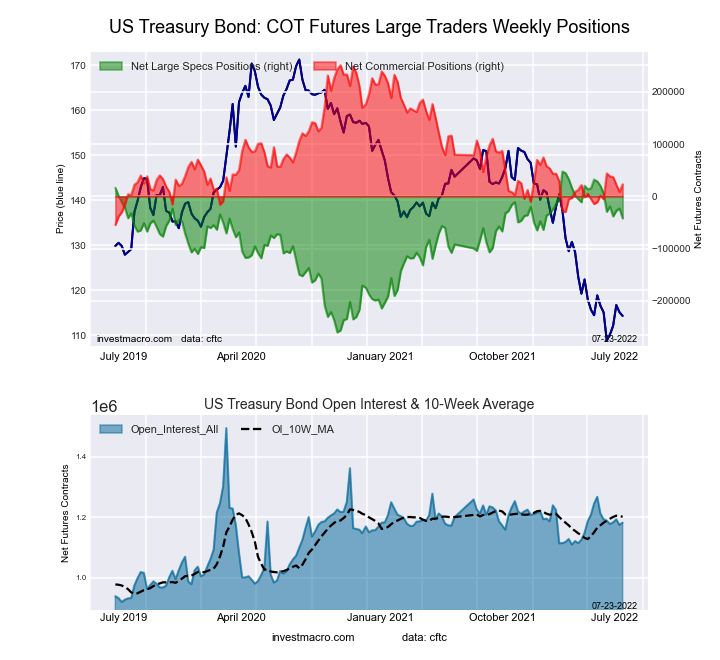 The US Treasury Bonds large speculator standing this week resulted in a net position of -42,102 contracts in the data reported through Tuesday. This was a weekly decline of -18,884 contracts from the previous week which had a total of -23,218 net contracts.
This week’s current strength score (the trader positioning range over the past three years, measured from 0 to 100) shows the speculators are currently Bullish with a score of 70.9 percent. The commercials are Bearish-Extreme with a score of 18.8 percent and the small traders (not shown in chart) are Bullish with a score of 67.7 percent.
| US Treasury Bonds Statistics | SPECULATORS | COMMERCIALS | SMALL TRADERS |
| – Percent of Open Interest Longs: | 7.6 | 77.9 | 13.9 |
| – Percent of Open Interest Shorts: | 11.2 | 75.9 | 12.3 |
| – Net Position: | -42,102 | 23,004 | 19,098 |
| – Gross Longs: | 90,183 | 920,782 | 164,348 |
| – Gross Shorts: | 132,285 | 897,778 | 145,250 |
| – Long to Short Ratio: | 0.7 to 1 | 1.0 to 1 | 1.1 to 1 |
| NET POSITION TREND: | |||
| – Strength Index Score (3 Year Range Pct): | 70.9 | 18.8 | 67.7 |
| – Strength Index Reading (3 Year Range): | Bullish | Bearish-Extreme | Bullish |
| NET POSITION MOVEMENT INDEX: | |||
| – 6-Week Change in Strength Index: | -15.3 | 10.2 | 14.6 |
Ultra US Treasury Bonds Futures:
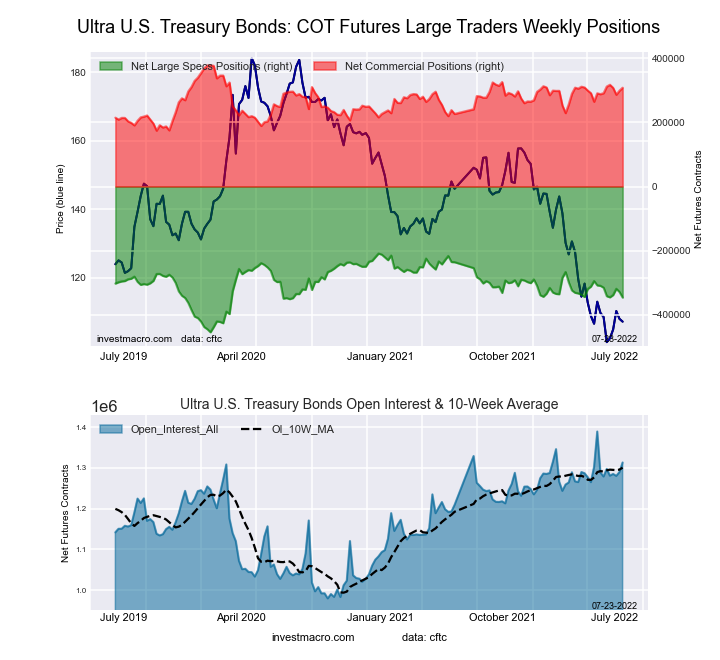 The Ultra US Treasury Bonds large speculator standing this week resulted in a net position of -345,782 contracts in the data reported through Tuesday. This was a weekly fall of -17,487 contracts from the previous week which had a total of -328,295 net contracts.
This week’s current strength score (the trader positioning range over the past three years, measured from 0 to 100) shows the speculators are currently Bearish with a score of 44.1 percent. The commercials are Bullish with a score of 65.5 percent and the small traders (not shown in chart) are Bullish with a score of 55.6 percent.
| Ultra US Treasury Bonds Statistics | SPECULATORS | COMMERCIALS | SMALL TRADERS |
| – Percent of Open Interest Longs: | 3.8 | 84.8 | 11.3 |
| – Percent of Open Interest Shorts: | 30.1 | 61.4 | 8.4 |
| – Net Position: | -345,782 | 307,679 | 38,103 |
| – Gross Longs: | 49,387 | 1,113,613 | 147,987 |
| – Gross Shorts: | 395,169 | 805,934 | 109,884 |
| – Long to Short Ratio: | 0.1 to 1 | 1.4 to 1 | 1.3 to 1 |
| NET POSITION TREND: | |||
| – Strength Index Score (3 Year Range Pct): | 44.1 | 65.5 | 55.6 |
| – Strength Index Reading (3 Year Range): | Bearish | Bullish | Bullish |
| NET POSITION MOVEMENT INDEX: | |||
| – 6-Week Change in Strength Index: | -12.6 | 8.3 | 10.0 |
Article By InvestMacro – Receive our weekly COT Reports by Email
*COT Report: The COT data, released weekly to the public each Friday, is updated through the most recent Tuesday (data is 3 days old) and shows a quick view of how large speculators or non-commercials (for-profit traders) were positioned in the futures markets.
The CFTC categorizes trader positions according to commercial hedgers (traders who use futures contracts for hedging as part of the business), non-commercials (large traders who speculate to realize trading profits) and nonreportable traders (usually small traders/speculators) as well as their open interest (contracts open in the market at time of reporting).See CFTC criteria here.

- Geopolitical and macroeconomic conditions continue to pressure market sentiment Jul 20, 2026
- USD/JPY Poised to Continue Gains as Expensive Oil and Lack of Support Weigh on Yen Jul 20, 2026
- COT Metals Charts: Weekly Speculator Bets led by Copper & Steel Jul 18, 2026
- COT Bonds Charts: Weekly Speculator Bets led by 2-Year, SOFR 3M & 5-Year Bonds Jul 18, 2026
- COT Energy Charts: Weekly Speculator Bets led by Brent Oil & Heating Oil Jul 18, 2026
- COT Soft Commodities Charts: Weekly Speculator Bets led by Wheat, Corn & Soybean Meal Jul 18, 2026
- The Bank of Canada kept its interest rate unchanged. Platinum prices reached a three‑week high Jul 16, 2026
- Stock indices rose after the release of US inflation data. China’s GDP slowed sharply Jul 15, 2026
- GBP/USD Awaits Political News: What Will Happen Next Jul 15, 2026
- USD/JPY Holds at Highs: Pressure Lingers on Yen Jul 14, 2026