By InvestMacro | COT | Data Tables | COT Leaders | Downloads | COT Newsletter
Here are the latest charts and statistics for the Commitment of Traders (COT) data published by the Commodities Futures Trading Commission (CFTC).
The latest COT data is updated through Tuesday May 24th and shows a quick view of how large traders (for-profit speculators and commercial entities) were positioned in the futures markets.
Free Reports:
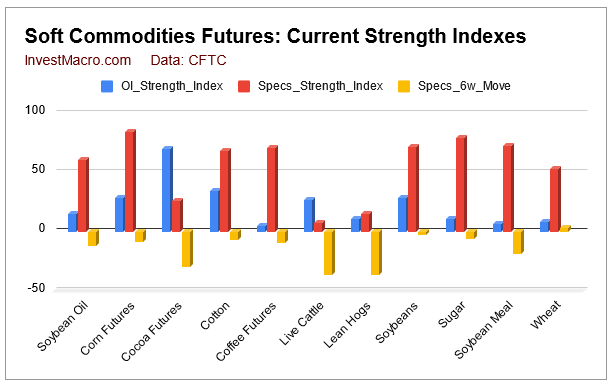
Speculator strength standings for each Commodity where strength index is current net position compared to past three years, above 80 is bullish extreme, below 20 is bearish extreme
| May-24-2022 | OI | OI-Index | Spec-Net | Spec-Index | Com-Net | COM-Index | Smalls-Net | Smalls-Index |
|---|---|---|---|---|---|---|---|---|
| WTI Crude | 1,711,863 | 0 | 334,761 | 11 | -374,627 | 91 | 39,866 | 71 |
| Gold | 530,098 | 22 | 183,813 | 14 | -211,947 | 82 | 28,134 | 37 |
| Silver | 146,456 | 13 | 14,103 | 26 | -23,297 | 88 | 9,194 | 3 |
| Copper | 186,433 | 17 | -19,633 | 28 | 19,288 | 73 | 345 | 27 |
| Palladium | 7,919 | 7 | -3,472 | 2 | 3,800 | 98 | -328 | 25 |
| Platinum | 65,824 | 32 | 1,485 | 5 | -6,683 | 96 | 5,198 | 34 |
| Natural Gas | 1,107,496 | 6 | -111,570 | 45 | 63,847 | 51 | 47,723 | 93 |
| Brent | 183,629 | 27 | -39,289 | 45 | 37,488 | 56 | 1,801 | 34 |
| Heating Oil | 349,618 | 31 | 6,455 | 52 | -32,434 | 37 | 25,979 | 88 |
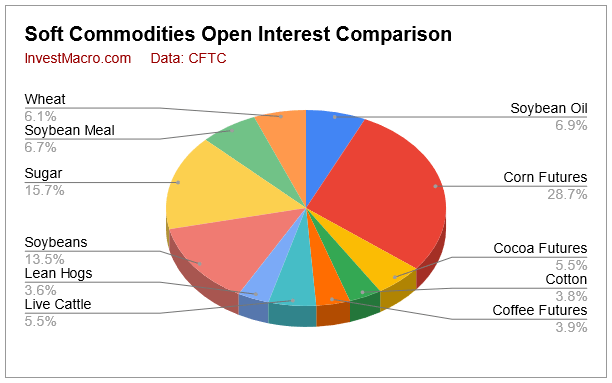
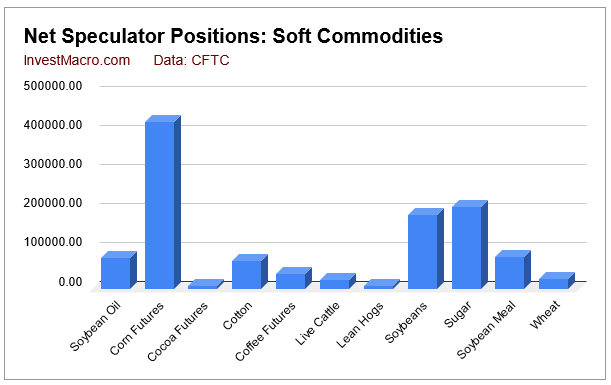
| Soybeans | 729,900 | 28 | 188,368 | 72 | -159,047 | 34 | -29,321 | 21 |
| Corn | 1,544,885 | 29 | 427,848 | 85 | -372,522 | 19 | -55,326 | 11 |
| Coffee | 211,266 | 5 | 37,072 | 71 | -38,484 | 34 | 1,412 | 4 |
| Sugar | 847,420 | 11 | 209,487 | 80 | -255,450 | 20 | 45,963 | 65 |
| Wheat | 326,607 | 8 | 26,344 | 53 | -24,339 | 25 | -2,005 | 100 |
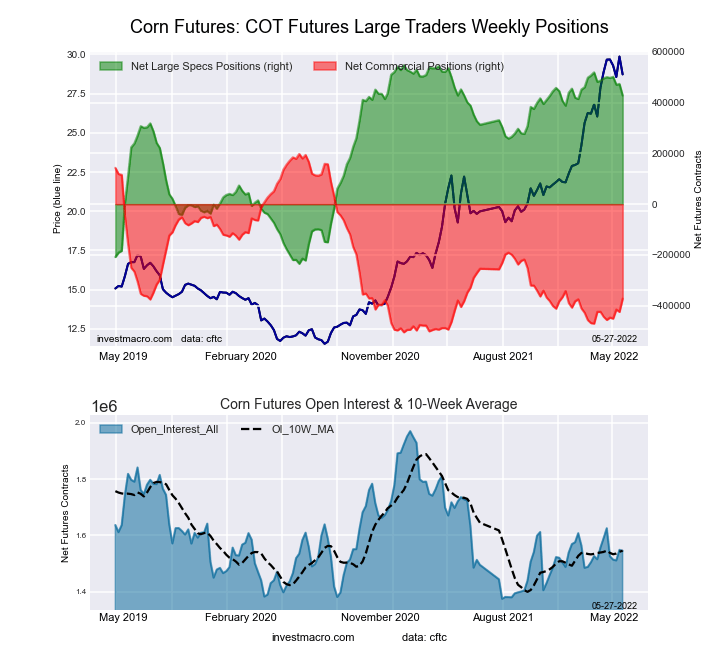
This week’s current strength score (the trader positioning range over the past three years, measured from 0 to 100) shows the speculators are currently Bullish-Extreme with a score of 84.7 percent. The commercials are Bearish-Extreme with a score of 18.9 percent and the small traders (not shown in chart) are Bearish-Extreme with a score of 11.2 percent.
| CORN Futures Statistics | SPECULATORS | COMMERCIALS | SMALL TRADERS |
| – Percent of Open Interest Longs: | 36.5 | 42.5 | 9.1 |
| – Percent of Open Interest Shorts: | 8.8 | 66.7 | 12.7 |
| – Net Position: | 427,848 | -372,522 | -55,326 |
| – Gross Longs: | 563,850 | 657,258 | 140,433 |
| – Gross Shorts: | 136,002 | 1,029,780 | 195,759 |
| – Long to Short Ratio: | 4.1 to 1 | 0.6 to 1 | 0.7 to 1 |
| NET POSITION TREND: | |||
| – Strength Index Score (3 Year Range Pct): | 84.7 | 18.9 | 11.2 |
| – Strength Index Reading (3 Year Range): | Bullish-Extreme | Bearish-Extreme | Bearish-Extreme |
| NET POSITION MOVEMENT INDEX: | |||
| – 6-Week Change in Strength Index: | -8.7 | 10.1 | -2.0 |
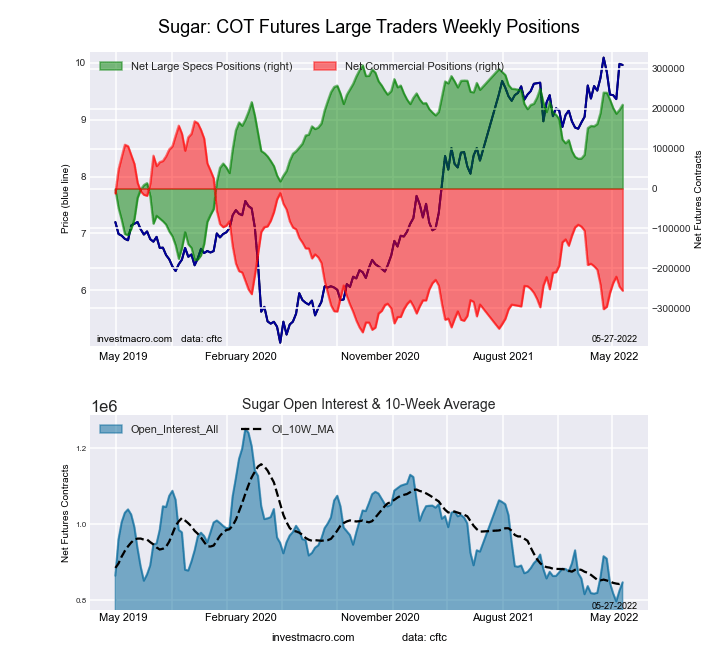
This week’s current strength score (the trader positioning range over the past three years, measured from 0 to 100) shows the speculators are currently Bullish with a score of 79.7 percent. The commercials are Bearish-Extreme with a score of 19.7 percent and the small traders (not shown in chart) are Bullish with a score of 64.7 percent.
| SUGAR Futures Statistics | SPECULATORS | COMMERCIALS | SMALL TRADERS |
| – Percent of Open Interest Longs: | 31.0 | 44.9 | 10.7 |
| – Percent of Open Interest Shorts: | 6.3 | 75.0 | 5.3 |
| – Net Position: | 209,487 | -255,450 | 45,963 |
| – Gross Longs: | 262,661 | 380,523 | 90,969 |
| – Gross Shorts: | 53,174 | 635,973 | 45,006 |
| – Long to Short Ratio: | 4.9 to 1 | 0.6 to 1 | 2.0 to 1 |
| NET POSITION TREND: | |||
| – Strength Index Score (3 Year Range Pct): | 79.7 | 19.7 | 64.7 |
| – Strength Index Reading (3 Year Range): | Bullish | Bearish-Extreme | Bullish |
| NET POSITION MOVEMENT INDEX: | |||
| – 6-Week Change in Strength Index: | -6.2 | 8.8 | -19.5 |
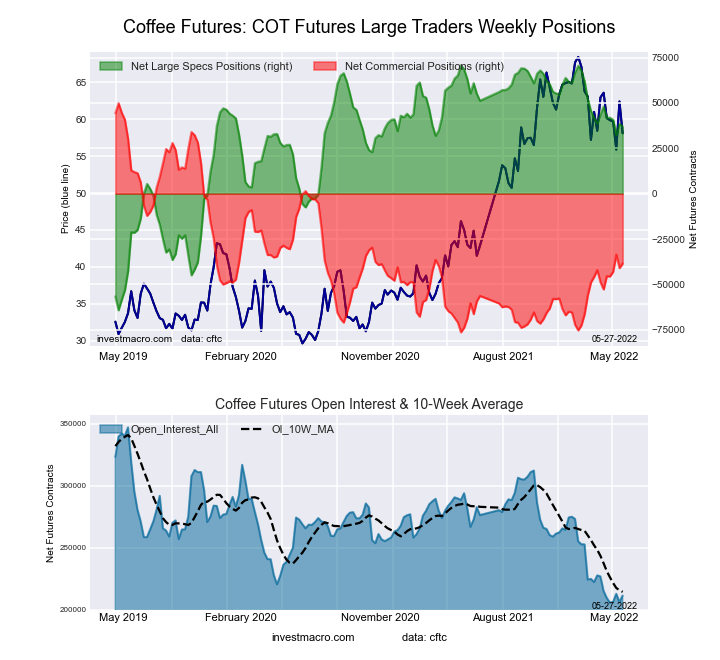
This week’s current strength score (the trader positioning range over the past three years, measured from 0 to 100) shows the speculators are currently Bullish with a score of 70.9 percent. The commercials are Bearish with a score of 34.3 percent and the small traders (not shown in chart) are Bearish-Extreme with a score of 4.1 percent.
| COFFEE Futures Statistics | SPECULATORS | COMMERCIALS | SMALL TRADERS |
| – Percent of Open Interest Longs: | 22.0 | 54.1 | 3.9 |
| – Percent of Open Interest Shorts: | 4.5 | 72.3 | 3.2 |
| – Net Position: | 37,072 | -38,484 | 1,412 |
| – Gross Longs: | 46,580 | 114,208 | 8,167 |
| – Gross Shorts: | 9,508 | 152,692 | 6,755 |
| – Long to Short Ratio: | 4.9 to 1 | 0.7 to 1 | 1.2 to 1 |
| NET POSITION TREND: | |||
| – Strength Index Score (3 Year Range Pct): | 70.9 | 34.3 | 4.1 |
| – Strength Index Reading (3 Year Range): | Bullish | Bearish | Bearish-Extreme |
| NET POSITION MOVEMENT INDEX: | |||
| – 6-Week Change in Strength Index: | -9.4 | 12.9 | -33.9 |
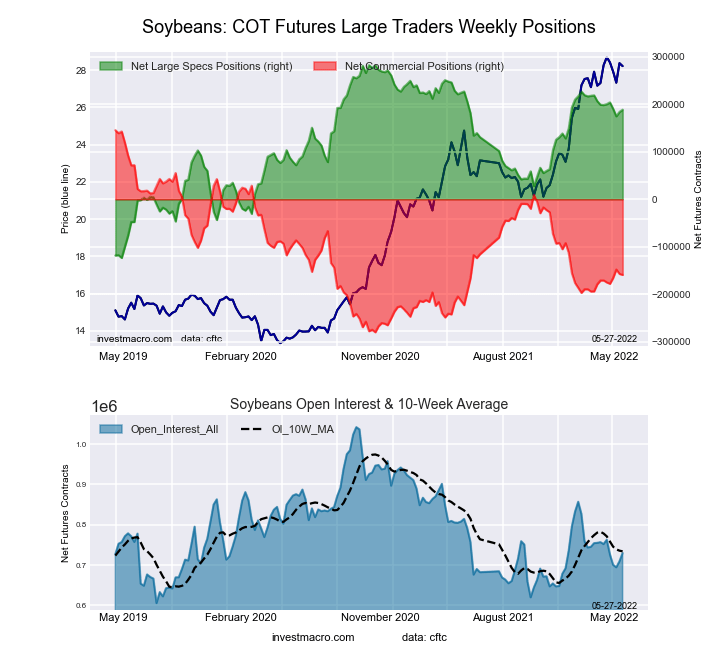
This week’s current strength score (the trader positioning range over the past three years, measured from 0 to 100) shows the speculators are currently Bullish with a score of 71.6 percent. The commercials are Bearish with a score of 34.3 percent and the small traders (not shown in chart) are Bearish with a score of 21.5 percent.
| SOYBEANS Futures Statistics | SPECULATORS | COMMERCIALS | SMALL TRADERS |
| – Percent of Open Interest Longs: | 32.4 | 47.3 | 6.8 |
| – Percent of Open Interest Shorts: | 6.5 | 69.1 | 10.8 |
| – Net Position: | 188,368 | -159,047 | -29,321 |
| – Gross Longs: | 236,164 | 345,076 | 49,551 |
| – Gross Shorts: | 47,796 | 504,123 | 78,872 |
| – Long to Short Ratio: | 4.9 to 1 | 0.7 to 1 | 0.6 to 1 |
| NET POSITION TREND: | |||
| – Strength Index Score (3 Year Range Pct): | 71.6 | 34.3 | 21.5 |
| – Strength Index Reading (3 Year Range): | Bullish | Bearish | Bearish |
| NET POSITION MOVEMENT INDEX: | |||
| – 6-Week Change in Strength Index: | -3.0 | 3.3 | -2.9 |
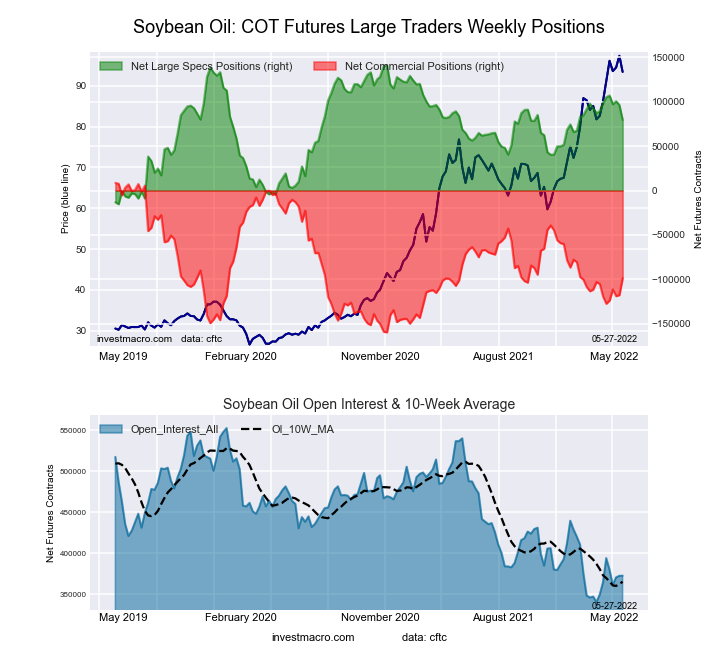
This week’s current strength score (the trader positioning range over the past three years, measured from 0 to 100) shows the speculators are currently Bullish with a score of 60.6 percent. The commercials are Bearish with a score of 36.2 percent and the small traders (not shown in chart) are Bullish-Extreme with a score of 85.1 percent.
| SOYBEAN OIL Futures Statistics | SPECULATORS | COMMERCIALS | SMALL TRADERS |
| – Percent of Open Interest Longs: | 28.6 | 47.5 | 9.6 |
| – Percent of Open Interest Shorts: | 7.3 | 74.0 | 4.5 |
| – Net Position: | 79,496 | -98,691 | 19,195 |
| – Gross Longs: | 106,705 | 177,213 | 35,857 |
| – Gross Shorts: | 27,209 | 275,904 | 16,662 |
| – Long to Short Ratio: | 3.9 to 1 | 0.6 to 1 | 2.2 to 1 |
| NET POSITION TREND: | |||
| – Strength Index Score (3 Year Range Pct): | 60.6 | 36.2 | 85.1 |
| – Strength Index Reading (3 Year Range): | Bullish | Bearish | Bullish-Extreme |
| NET POSITION MOVEMENT INDEX: | |||
| – 6-Week Change in Strength Index: | -12.0 | 12.2 | -6.0 |
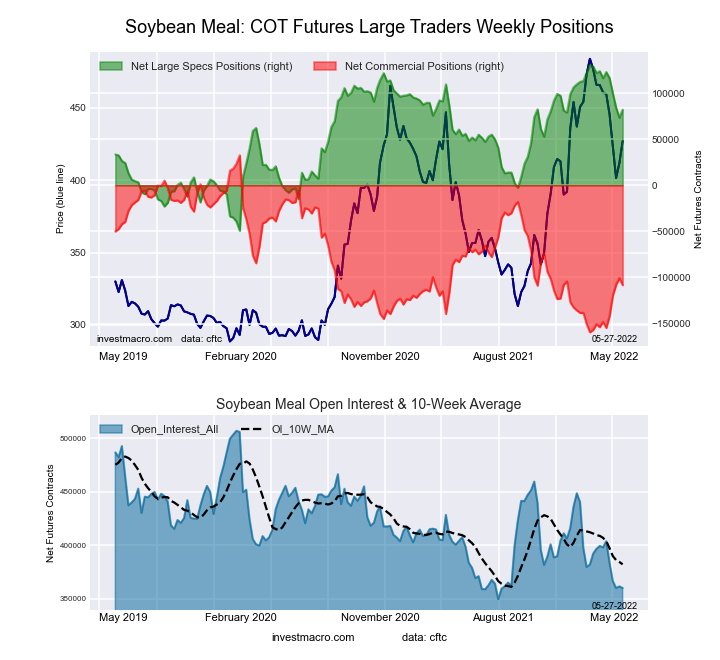
This week’s current strength score (the trader positioning range over the past three years, measured from 0 to 100) shows the speculators are currently Bullish with a score of 73.1 percent. The commercials are Bearish with a score of 26.6 percent and the small traders (not shown in chart) are Bullish with a score of 70.5 percent.
| SOYBEAN MEAL Futures Statistics | SPECULATORS | COMMERCIALS | SMALL TRADERS |
| – Percent of Open Interest Longs: | 28.5 | 46.5 | 13.6 |
| – Percent of Open Interest Shorts: | 5.7 | 76.6 | 6.2 |
| – Net Position: | 81,907 | -108,388 | 26,481 |
| – Gross Longs: | 102,564 | 167,414 | 48,827 |
| – Gross Shorts: | 20,657 | 275,802 | 22,346 |
| – Long to Short Ratio: | 5.0 to 1 | 0.6 to 1 | 2.2 to 1 |
| NET POSITION TREND: | |||
| – Strength Index Score (3 Year Range Pct): | 73.1 | 26.6 | 70.5 |
| – Strength Index Reading (3 Year Range): | Bullish | Bearish | Bullish |
| NET POSITION MOVEMENT INDEX: | |||
| – 6-Week Change in Strength Index: | -19.1 | 20.7 | -27.9 |
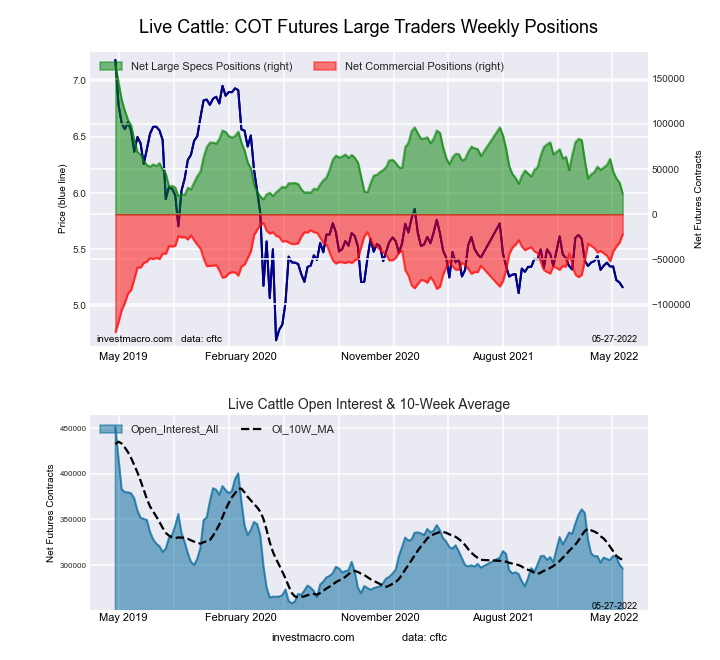
This week’s current strength score (the trader positioning range over the past three years, measured from 0 to 100) shows the speculators are currently Bearish-Extreme with a score of 7.9 percent. The commercials are Bullish-Extreme with a score of 83.0 percent and the small traders (not shown in chart) are Bullish with a score of 79.7 percent.
| LIVE CATTLE Futures Statistics | SPECULATORS | COMMERCIALS | SMALL TRADERS |
| – Percent of Open Interest Longs: | 33.7 | 41.3 | 11.5 |
| – Percent of Open Interest Shorts: | 26.1 | 48.8 | 11.7 |
| – Net Position: | 22,747 | -22,153 | -594 |
| – Gross Longs: | 99,928 | 122,357 | 34,015 |
| – Gross Shorts: | 77,181 | 144,510 | 34,609 |
| – Long to Short Ratio: | 1.3 to 1 | 0.8 to 1 | 1.0 to 1 |
| NET POSITION TREND: | |||
| – Strength Index Score (3 Year Range Pct): | 7.9 | 83.0 | 79.7 |
| – Strength Index Reading (3 Year Range): | Bearish-Extreme | Bullish-Extreme | Bullish |
| NET POSITION MOVEMENT INDEX: | |||
| – 6-Week Change in Strength Index: | -36.5 | 29.0 | 27.5 |
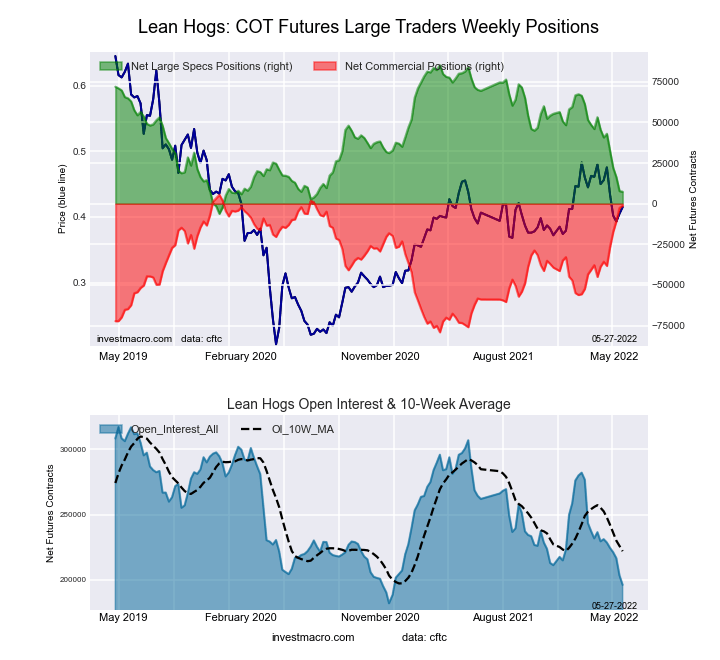
This week’s current strength score (the trader positioning range over the past three years, measured from 0 to 100) shows the speculators are currently Bearish-Extreme with a score of 14.8 percent. The commercials are Bullish-Extreme with a score of 92.0 percent and the small traders (not shown in chart) are Bullish with a score of 64.8 percent.
| LEAN HOGS Futures Statistics | SPECULATORS | COMMERCIALS | SMALL TRADERS |
| – Percent of Open Interest Longs: | 28.3 | 41.7 | 10.2 |
| – Percent of Open Interest Shorts: | 24.6 | 42.3 | 13.3 |
| – Net Position: | 7,358 | -1,239 | -6,119 |
| – Gross Longs: | 55,555 | 81,805 | 19,958 |
| – Gross Shorts: | 48,197 | 83,044 | 26,077 |
| – Long to Short Ratio: | 1.2 to 1 | 1.0 to 1 | 0.8 to 1 |
| NET POSITION TREND: | |||
| – Strength Index Score (3 Year Range Pct): | 14.8 | 92.0 | 64.8 |
| – Strength Index Reading (3 Year Range): | Bearish-Extreme | Bullish-Extreme | Bullish |
| NET POSITION MOVEMENT INDEX: | |||
| – 6-Week Change in Strength Index: | -36.4 | 40.7 | -5.5 |
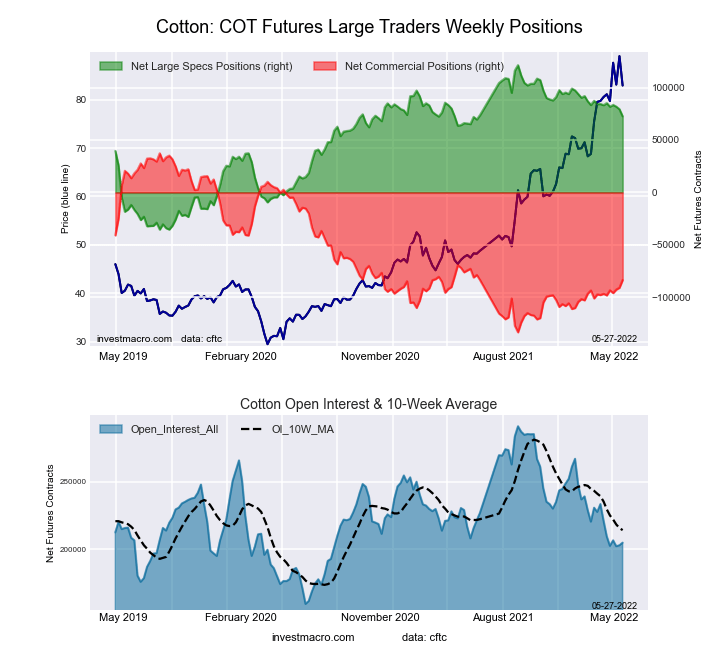
This week’s current strength score (the trader positioning range over the past three years, measured from 0 to 100) shows the speculators are currently Bullish with a score of 68.9 percent. The commercials are Bearish with a score of 29.2 percent and the small traders (not shown in chart) are Bullish-Extreme with a score of 82.0 percent.
| COTTON Futures Statistics | SPECULATORS | COMMERCIALS | SMALL TRADERS |
| – Percent of Open Interest Longs: | 42.5 | 36.7 | 8.6 |
| – Percent of Open Interest Shorts: | 7.0 | 77.5 | 3.2 |
| – Net Position: | 72,520 | -83,537 | 11,017 |
| – Gross Longs: | 86,947 | 75,106 | 17,532 |
| – Gross Shorts: | 14,427 | 158,643 | 6,515 |
| – Long to Short Ratio: | 6.0 to 1 | 0.5 to 1 | 2.7 to 1 |
| NET POSITION TREND: | |||
| – Strength Index Score (3 Year Range Pct): | 68.9 | 29.2 | 82.0 |
| – Strength Index Reading (3 Year Range): | Bullish | Bearish | Bullish-Extreme |
| NET POSITION MOVEMENT INDEX: | |||
| – 6-Week Change in Strength Index: | -6.8 | 7.7 | -15.5 |
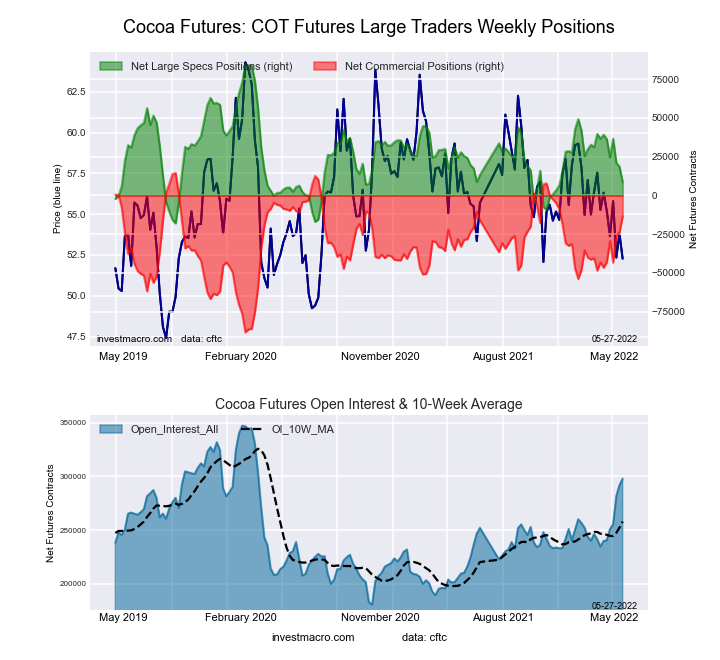
This week’s current strength score (the trader positioning range over the past three years, measured from 0 to 100) shows the speculators are currently Bearish with a score of 26.0 percent. The commercials are Bullish with a score of 72.7 percent and the small traders (not shown in chart) are Bearish with a score of 46.1 percent.
| COCOA Futures Statistics | SPECULATORS | COMMERCIALS | SMALL TRADERS |
| – Percent of Open Interest Longs: | 29.9 | 44.5 | 5.6 |
| – Percent of Open Interest Shorts: | 27.0 | 49.0 | 4.0 |
| – Net Position: | 8,583 | -13,540 | 4,957 |
| – Gross Longs: | 89,159 | 132,424 | 16,784 |
| – Gross Shorts: | 80,576 | 145,964 | 11,827 |
| – Long to Short Ratio: | 1.1 to 1 | 0.9 to 1 | 1.4 to 1 |
| NET POSITION TREND: | |||
| – Strength Index Score (3 Year Range Pct): | 26.0 | 72.7 | 46.1 |
| – Strength Index Reading (3 Year Range): | Bearish | Bullish | Bearish |
| NET POSITION MOVEMENT INDEX: | |||
| – 6-Week Change in Strength Index: | -30.0 | 32.2 | -25.0 |
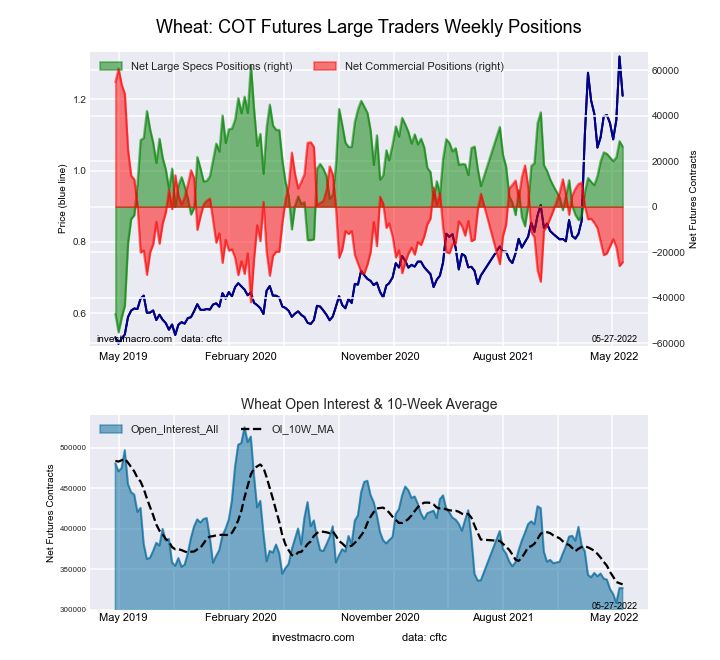
This week’s current strength score (the trader positioning range over the past three years, measured from 0 to 100) shows the speculators are currently Bullish with a score of 53.3 percent. The commercials are Bearish with a score of 25.1 percent and the small traders (not shown in chart) are Bullish-Extreme with a score of 100.0 percent.
| WHEAT Futures Statistics | SPECULATORS | COMMERCIALS | SMALL TRADERS |
| – Percent of Open Interest Longs: | 36.2 | 35.4 | 10.3 |
| – Percent of Open Interest Shorts: | 28.1 | 42.9 | 10.9 |
| – Net Position: | 26,344 | -24,339 | -2,005 |
| – Gross Longs: | 118,170 | 115,722 | 33,634 |
| – Gross Shorts: | 91,826 | 140,061 | 35,639 |
| – Long to Short Ratio: | 1.3 to 1 | 0.8 to 1 | 0.9 to 1 |
| NET POSITION TREND: | |||
| – Strength Index Score (3 Year Range Pct): | 53.3 | 25.1 | 100.0 |
| – Strength Index Reading (3 Year Range): | Bullish | Bearish | Bullish-Extreme |
| NET POSITION MOVEMENT INDEX: | |||
| – 6-Week Change in Strength Index: | 3.2 | -4.4 | 3.2 |
Article By InvestMacro – Receive our weekly COT Reports by Email
*COT Report: The COT data, released weekly to the public each Friday, is updated through the most recent Tuesday (data is 3 days old) and shows a quick view of how large speculators or non-commercials (for-profit traders) were positioned in the futures markets.
The CFTC categorizes trader positions according to commercial hedgers (traders who use futures contracts for hedging as part of the business), non-commercials (large traders who speculate to realize trading profits) and nonreportable traders (usually small traders/speculators) as well as their open interest (contracts open in the market at time of reporting).See CFTC criteria here.
By Analytical Department RoboForex GBP/USD fell to 1.3437 on Tuesday as investors assessed the appointment…
By JustMarkets The US stock indices ended Friday’s session in the red. By the end…
By Analytical Department RoboForex USD/JPY opens the week at 162.36 on Monday. The Japanese yen…
By InvestMacro Here are the latest charts and statistics for the Commitment of Traders (COT)…
By InvestMacro The latest update for the weekly Commitment of Traders (COT) report was released…
By InvestMacro Here are the latest charts and statistics for the Commitment of Traders (COT)…
This website uses cookies.