By InvestMacro | COT | Data Tables | COT Leaders | Downloads | COT Newsletter
Here are the latest charts and statistics for the Commitment of Traders (COT) data published by the Commodities Futures Trading Commission (CFTC).
The latest COT data is updated through Tuesday March 15th and shows a quick view of how large traders (for-profit speculators and commercial entities) were positioned in the futures markets.
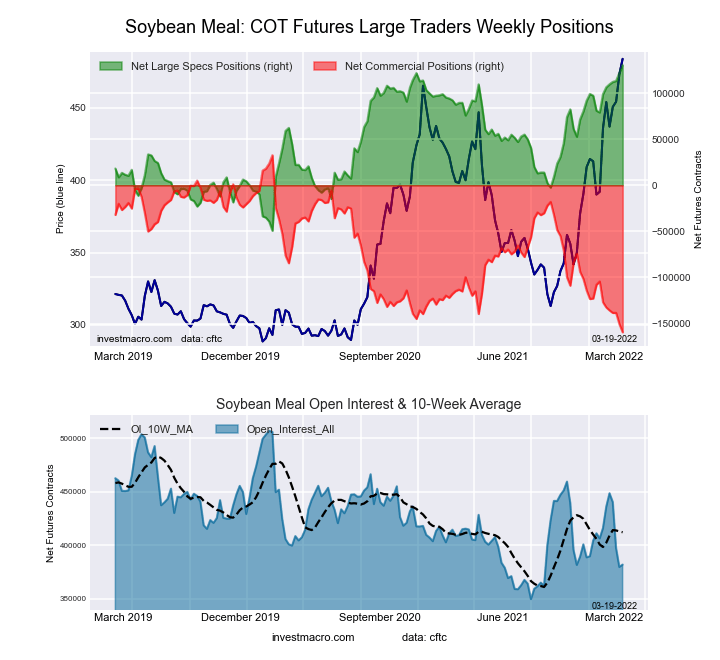
Highlighting the COT soft commodities data is the continued surge in Soybean Meal futures bets. The speculative net position in the Soybean Meal futures has gained for seven consecutive weeks with a total rise of +51,237 contracts over that time-frame. This has pushed the current net standing to over +130,000 net contracts and to the most bullish level in the past one hundred and ninety-seven weeks, dating all the way back to June 5th of 2018. The positive speculator sentiment has now boosted the speculator strength index to the top of its range with a 100 percent score and a bullish-extreme reading (strength index is current speculator standing compared to past three years, above 80 is bullish extreme, below 20 is bearish extreme).
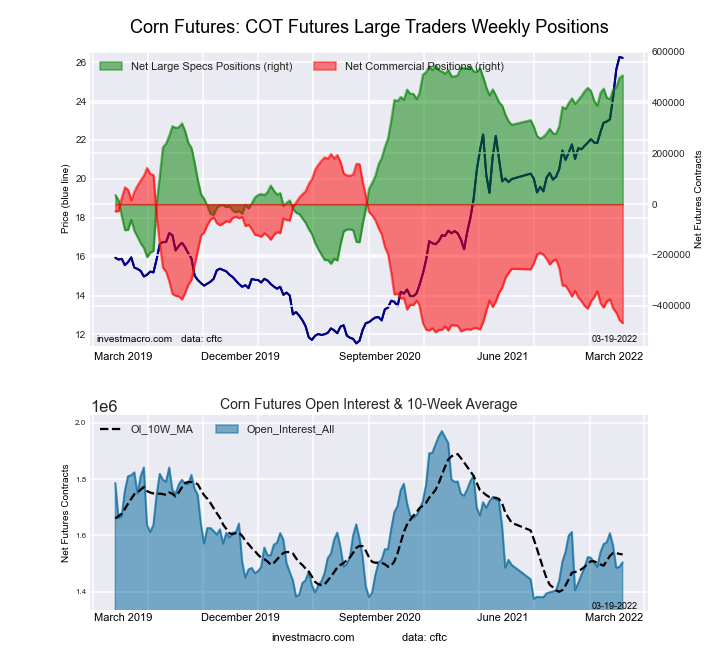
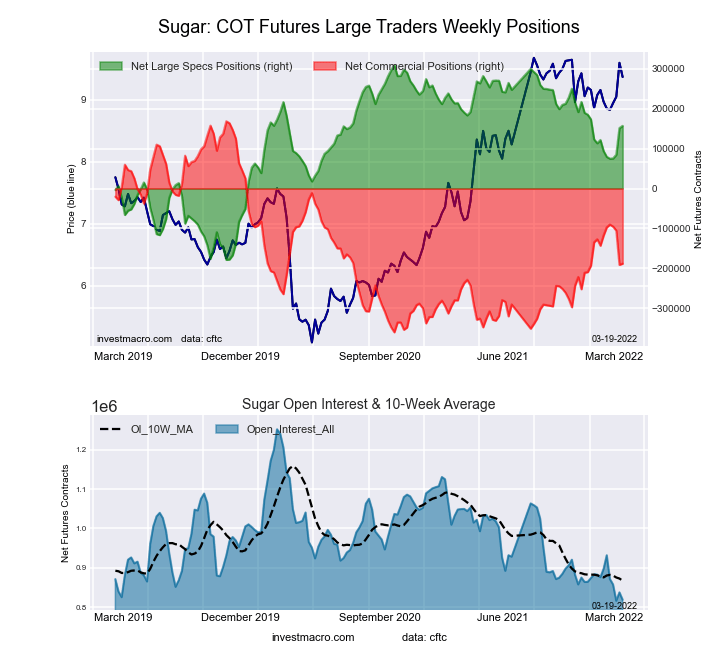
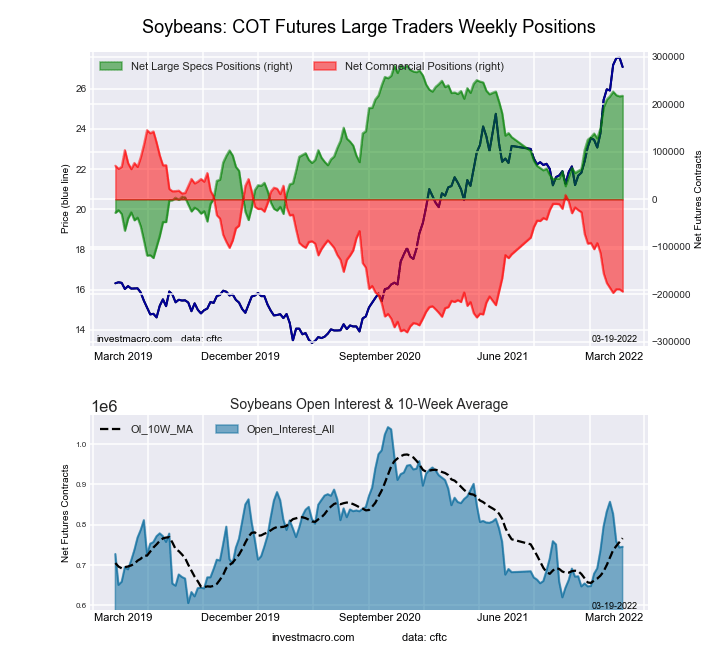
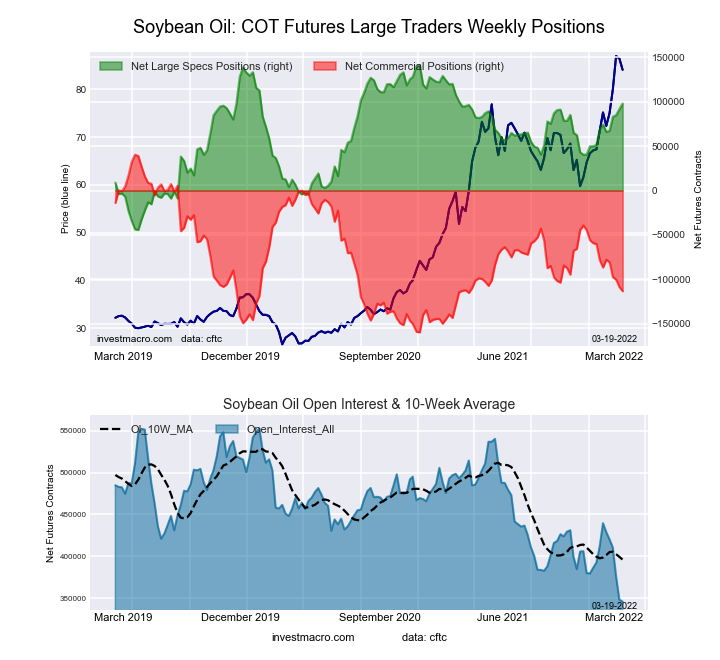
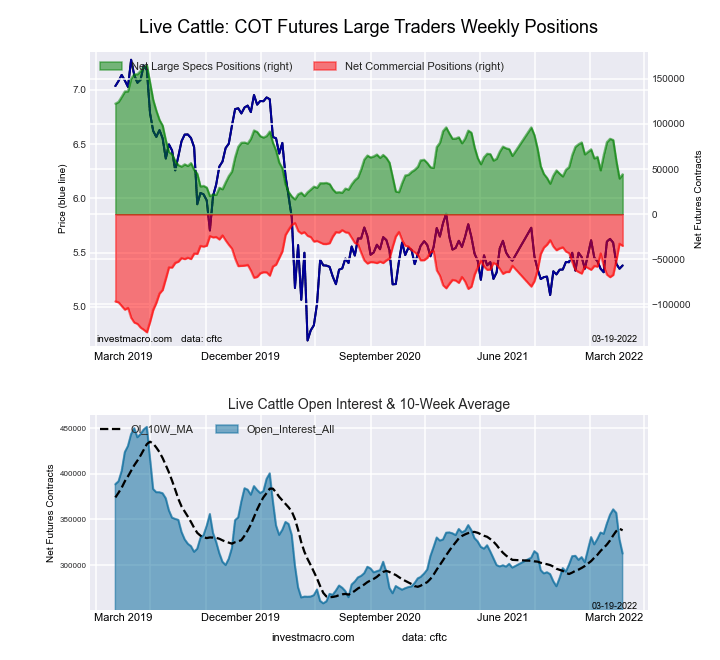
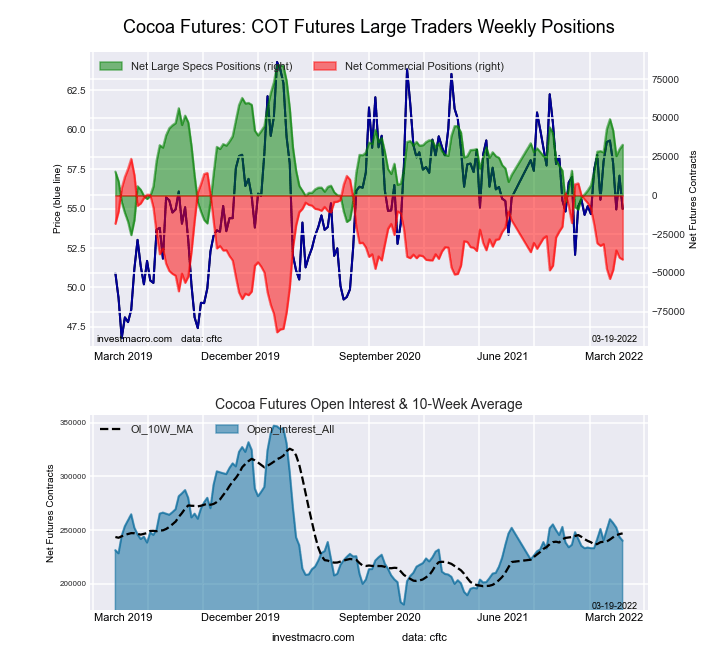
The soft commodities that saw higher bets this week were Corn (9,173 contracts), Sugar (5,504 contracts), Soybeans (1,022 contracts), Soybean Oil (6,245 contracts), Soybean Meal (8,651 contracts), Live Cattle (4,689 contracts) and Cocoa (2,929 contracts).
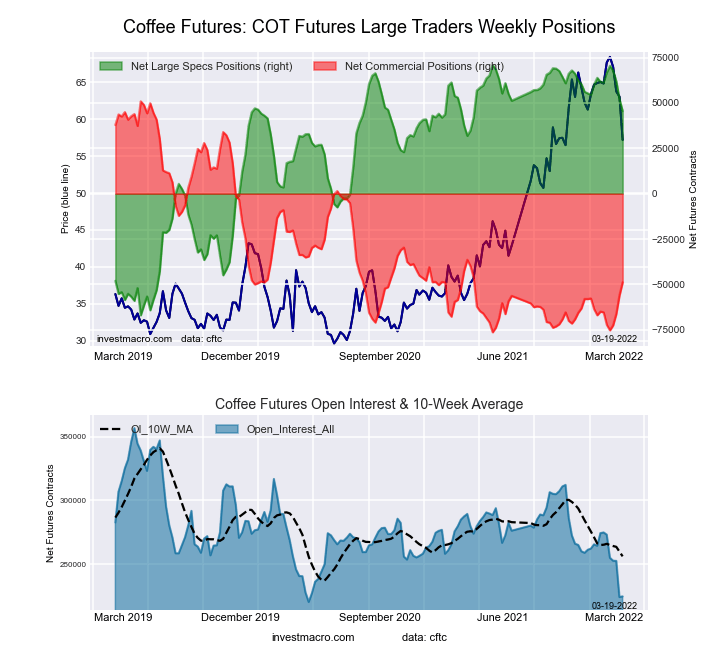
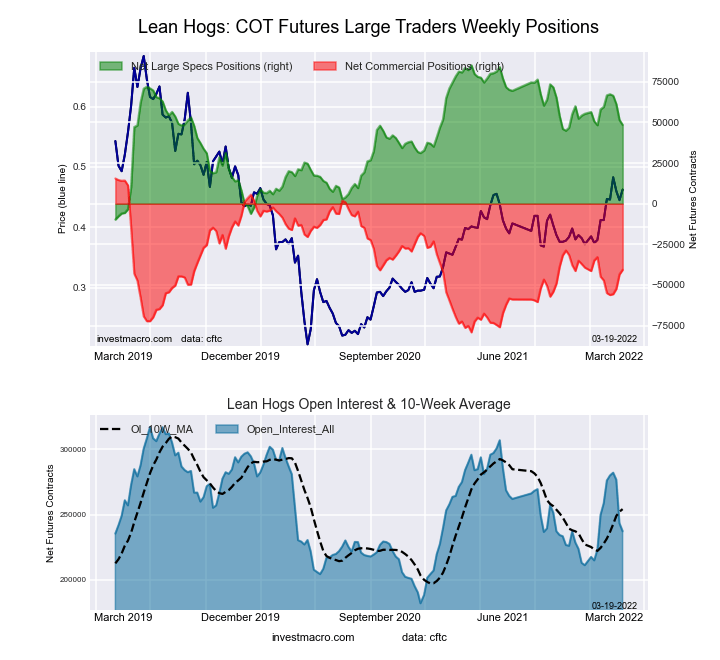
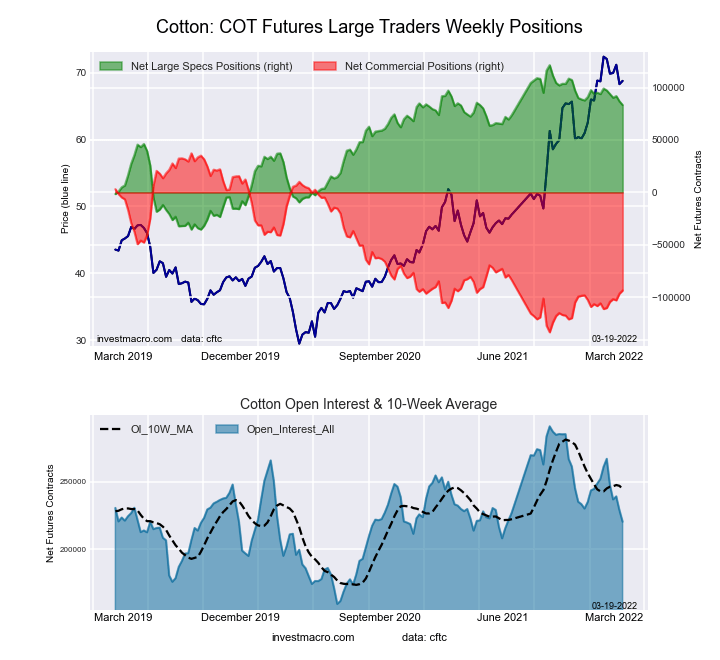
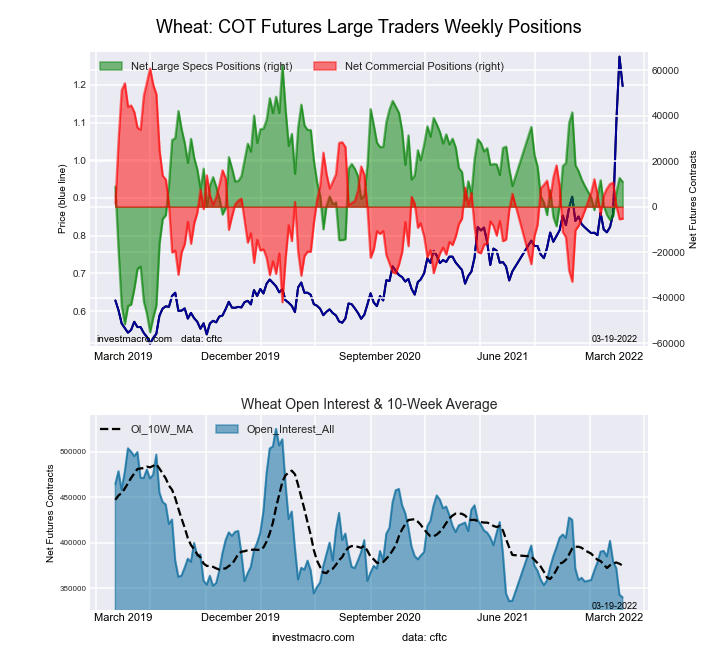
The soft commodities that saw lower bets this week were Coffee (-6,613 contracts), Lean Hogs (-3,035 contracts), Cotton (-3,510 contracts) and Wheat (-1,695 contracts).
Free Reports:
| Mar-15-2022 | OI | OI-Index | Spec-Net | Spec-Index | Com-Net | COM-Index | Smalls-Net | Smalls-Index |
|---|---|---|---|---|---|---|---|---|
| WTI Crude | 1,850,794 | 0 | 341,815 | 4 | -382,602 | 90 | 40,787 | 72 |
| Gold | 617,605 | 51 | 261,788 | 71 | -297,441 | 27 | 35,653 | 65 |
| Silver | 159,571 | 25 | 51,554 | 74 | -67,579 | 33 | 16,025 | 36 |
| Copper | 183,170 | 14 | 19,030 | 56 | -26,717 | 41 | 7,687 | 70 |
| Palladium | 6,992 | 2 | -1,009 | 16 | 220 | 78 | 789 | 91 |
| Platinum | 67,727 | 35 | 17,932 | 28 | -25,692 | 72 | 7,760 | 70 |
| Natural Gas | 1,082,746 | 0 | -146,560 | 35 | 105,856 | 64 | 40,704 | 82 |
| Brent | 192,679 | 34 | -18,961 | 79 | 17,343 | 22 | 1,618 | 31 |
| Heating Oil | 349,618 | 31 | 6,455 | 52 | -32,434 | 37 | 25,979 | 88 |
| Soybeans | 745,345 | 32 | 217,599 | 84 | -193,958 | 20 | -23,641 | 31 |
| Corn | 1,504,159 | 22 | 507,206 | 95 | -468,758 | 5 | -38,448 | 21 |
| Coffee | 224,693 | 3 | 45,500 | 82 | -48,838 | 22 | 3,338 | 11 |
| Sugar | 818,877 | 1 | 156,580 | 69 | -188,036 | 33 | 31,456 | 47 |
| Wheat | 339,904 | 2 | 10,930 | 56 | -5,252 | 36 | -5,678 | 91 |
This week’s current strength score (the trader positioning range over the past three years, measured from 0 to 100) shows the speculators are currently Bullish-Extreme with a score of 94.8 percent. The commercials are Bearish-Extreme with a score of 5.2 percent and the small traders (not shown in chart) are Bearish with a score of 20.9 percent.
| CORN Futures Statistics | SPECULATORS | COMMERCIALS | SMALL TRADERS |
| – Percent of Open Interest Longs: | 38.0 | 44.8 | 8.8 |
| – Percent of Open Interest Shorts: | 4.3 | 76.0 | 11.3 |
| – Net Position: | 507,206 | -468,758 | -38,448 |
| – Gross Longs: | 571,419 | 673,921 | 132,114 |
| – Gross Shorts: | 64,213 | 1,142,679 | 170,562 |
| – Long to Short Ratio: | 8.9 to 1 | 0.6 to 1 | 0.8 to 1 |
| NET POSITION TREND: | |||
| – Strength Index Score (3 Year Range Pct): | 94.8 | 5.2 | 20.9 |
| – Strength Index Reading (3 Year Range): | Bullish-Extreme | Bearish-Extreme | Bearish |
| NET POSITION MOVEMENT INDEX: | |||
| – 6-Week Change in Strength Index: | 6.6 | -8.7 | 5.2 |
This week’s current strength score (the trader positioning range over the past three years, measured from 0 to 100) shows the speculators are currently Bullish with a score of 68.8 percent. The commercials are Bearish with a score of 32.5 percent and the small traders (not shown in chart) are Bearish with a score of 46.7 percent.
| SUGAR Futures Statistics | SPECULATORS | COMMERCIALS | SMALL TRADERS |
| – Percent of Open Interest Longs: | 25.6 | 51.5 | 10.7 |
| – Percent of Open Interest Shorts: | 6.5 | 74.5 | 6.9 |
| – Net Position: | 156,580 | -188,036 | 31,456 |
| – Gross Longs: | 209,848 | 422,056 | 87,859 |
| – Gross Shorts: | 53,268 | 610,092 | 56,403 |
| – Long to Short Ratio: | 3.9 to 1 | 0.7 to 1 | 1.6 to 1 |
| NET POSITION TREND: | |||
| – Strength Index Score (3 Year Range Pct): | 68.8 | 32.5 | 46.7 |
| – Strength Index Reading (3 Year Range): | Bullish | Bearish | Bearish |
| NET POSITION MOVEMENT INDEX: | |||
| – 6-Week Change in Strength Index: | 12.9 | -13.4 | 9.3 |
This week’s current strength score (the trader positioning range over the past three years, measured from 0 to 100) shows the speculators are currently Bullish-Extreme with a score of 81.7 percent. The commercials are Bearish with a score of 21.6 percent and the small traders (not shown in chart) are Bearish-Extreme with a score of 11.4 percent.
| COFFEE Futures Statistics | SPECULATORS | COMMERCIALS | SMALL TRADERS |
| – Percent of Open Interest Longs: | 25.8 | 51.9 | 4.6 |
| – Percent of Open Interest Shorts: | 5.6 | 73.6 | 3.1 |
| – Net Position: | 45,500 | -48,838 | 3,338 |
| – Gross Longs: | 58,040 | 116,559 | 10,359 |
| – Gross Shorts: | 12,540 | 165,397 | 7,021 |
| – Long to Short Ratio: | 4.6 to 1 | 0.7 to 1 | 1.5 to 1 |
| NET POSITION TREND: | |||
| – Strength Index Score (3 Year Range Pct): | 81.7 | 21.6 | 11.4 |
| – Strength Index Reading (3 Year Range): | Bullish-Extreme | Bearish | Bearish-Extreme |
| NET POSITION MOVEMENT INDEX: | |||
| – 6-Week Change in Strength Index: | -11.5 | 13.0 | -4.5 |
This week’s current strength score (the trader positioning range over the past three years, measured from 0 to 100) shows the speculators are currently Bullish-Extreme with a score of 84.1 percent. The commercials are Bearish with a score of 20.2 percent and the small traders (not shown in chart) are Bearish with a score of 31.1 percent.
| SOYBEANS Futures Statistics | SPECULATORS | COMMERCIALS | SMALL TRADERS |
| – Percent of Open Interest Longs: | 35.7 | 44.1 | 6.9 |
| – Percent of Open Interest Shorts: | 6.5 | 70.1 | 10.1 |
| – Net Position: | 217,599 | -193,958 | -23,641 |
| – Gross Longs: | 265,949 | 328,524 | 51,470 |
| – Gross Shorts: | 48,350 | 522,482 | 75,111 |
| – Long to Short Ratio: | 5.5 to 1 | 0.6 to 1 | 0.7 to 1 |
| NET POSITION TREND: | |||
| – Strength Index Score (3 Year Range Pct): | 84.1 | 20.2 | 31.1 |
| – Strength Index Reading (3 Year Range): | Bullish-Extreme | Bearish | Bearish |
| NET POSITION MOVEMENT INDEX: | |||
| – 6-Week Change in Strength Index: | 6.0 | -9.0 | 24.0 |
This week’s current strength score (the trader positioning range over the past three years, measured from 0 to 100) shows the speculators are currently Bullish with a score of 76.7 percent. The commercials are Bearish with a score of 23.1 percent and the small traders (not shown in chart) are Bullish with a score of 70.8 percent.
| SOYBEAN OIL Futures Statistics | SPECULATORS | COMMERCIALS | SMALL TRADERS |
| – Percent of Open Interest Longs: | 33.0 | 49.0 | 9.6 |
| – Percent of Open Interest Shorts: | 4.7 | 81.7 | 5.2 |
| – Net Position: | 97,927 | -113,307 | 15,380 |
| – Gross Longs: | 114,193 | 169,475 | 33,229 |
| – Gross Shorts: | 16,266 | 282,782 | 17,849 |
| – Long to Short Ratio: | 7.0 to 1 | 0.6 to 1 | 1.9 to 1 |
| NET POSITION TREND: | |||
| – Strength Index Score (3 Year Range Pct): | 76.7 | 23.1 | 70.8 |
| – Strength Index Reading (3 Year Range): | Bullish | Bearish | Bullish |
| NET POSITION MOVEMENT INDEX: | |||
| – 6-Week Change in Strength Index: | 12.7 | -13.4 | 11.9 |
This week’s current strength score (the trader positioning range over the past three years, measured from 0 to 100) shows the speculators are currently Bullish-Extreme with a score of 100.0 percent. The commercials are Bearish-Extreme with a score of 0.0 percent and the small traders (not shown in chart) are Bullish-Extreme with a score of 87.2 percent.
| SOYBEAN MEAL Futures Statistics | SPECULATORS | COMMERCIALS | SMALL TRADERS |
| – Percent of Open Interest Longs: | 36.7 | 42.2 | 12.4 |
| – Percent of Open Interest Shorts: | 2.6 | 83.9 | 4.8 |
| – Net Position: | 130,255 | -159,488 | 29,233 |
| – Gross Longs: | 140,002 | 161,042 | 47,423 |
| – Gross Shorts: | 9,747 | 320,530 | 18,190 |
| – Long to Short Ratio: | 14.4 to 1 | 0.5 to 1 | 2.6 to 1 |
| NET POSITION TREND: | |||
| – Strength Index Score (3 Year Range Pct): | 100.0 | 0.0 | 87.2 |
| – Strength Index Reading (3 Year Range): | Bullish-Extreme | Bearish-Extreme | Bullish-Extreme |
| NET POSITION MOVEMENT INDEX: | |||
| – 6-Week Change in Strength Index: | 17.5 | -16.9 | 4.7 |
This week’s current strength score (the trader positioning range over the past three years, measured from 0 to 100) shows the speculators are currently Bearish-Extreme with a score of 18.7 percent. The commercials are Bullish with a score of 79.1 percent and the small traders (not shown in chart) are Bullish with a score of 64.7 percent.
| LIVE CATTLE Futures Statistics | SPECULATORS | COMMERCIALS | SMALL TRADERS |
| – Percent of Open Interest Longs: | 34.7 | 42.5 | 9.8 |
| – Percent of Open Interest Shorts: | 20.6 | 53.7 | 12.8 |
| – Net Position: | 44,256 | -35,043 | -9,213 |
| – Gross Longs: | 108,642 | 132,992 | 30,710 |
| – Gross Shorts: | 64,386 | 168,035 | 39,923 |
| – Long to Short Ratio: | 1.7 to 1 | 0.8 to 1 | 0.8 to 1 |
| NET POSITION TREND: | |||
| – Strength Index Score (3 Year Range Pct): | 18.7 | 79.1 | 64.7 |
| – Strength Index Reading (3 Year Range): | Bearish-Extreme | Bullish | Bullish |
| NET POSITION MOVEMENT INDEX: | |||
| – 6-Week Change in Strength Index: | -14.3 | 18.6 | -3.0 |
This week’s current strength score (the trader positioning range over the past three years, measured from 0 to 100) shows the speculators are currently Bullish with a score of 59.6 percent. The commercials are Bearish with a score of 45.4 percent and the small traders (not shown in chart) are Bullish with a score of 54.4 percent.
| LEAN HOGS Futures Statistics | SPECULATORS | COMMERCIALS | SMALL TRADERS |
| – Percent of Open Interest Longs: | 36.9 | 35.7 | 9.2 |
| – Percent of Open Interest Shorts: | 16.5 | 52.9 | 12.5 |
| – Net Position: | 48,490 | -40,705 | -7,785 |
| – Gross Longs: | 87,555 | 84,755 | 21,909 |
| – Gross Shorts: | 39,065 | 125,460 | 29,694 |
| – Long to Short Ratio: | 2.2 to 1 | 0.7 to 1 | 0.7 to 1 |
| NET POSITION TREND: | |||
| – Strength Index Score (3 Year Range Pct): | 59.6 | 45.4 | 54.4 |
| – Strength Index Reading (3 Year Range): | Bullish | Bearish | Bullish |
| NET POSITION MOVEMENT INDEX: | |||
| – 6-Week Change in Strength Index: | -12.0 | 7.6 | 23.1 |
This week’s current strength score (the trader positioning range over the past three years, measured from 0 to 100) shows the speculators are currently Bullish with a score of 75.8 percent. The commercials are Bearish with a score of 23.4 percent and the small traders (not shown in chart) are Bullish with a score of 76.8 percent.
| COTTON Futures Statistics | SPECULATORS | COMMERCIALS | SMALL TRADERS |
| – Percent of Open Interest Longs: | 43.6 | 40.4 | 7.9 |
| – Percent of Open Interest Shorts: | 5.8 | 82.9 | 3.3 |
| – Net Position: | 83,321 | -93,450 | 10,129 |
| – Gross Longs: | 96,108 | 89,048 | 17,343 |
| – Gross Shorts: | 12,787 | 182,498 | 7,214 |
| – Long to Short Ratio: | 7.5 to 1 | 0.5 to 1 | 2.4 to 1 |
| NET POSITION TREND: | |||
| – Strength Index Score (3 Year Range Pct): | 75.8 | 23.4 | 76.8 |
| – Strength Index Reading (3 Year Range): | Bullish | Bearish | Bullish |
| NET POSITION MOVEMENT INDEX: | |||
| – 6-Week Change in Strength Index: | -10.0 | 10.3 | -12.3 |
This week’s current strength score (the trader positioning range over the past three years, measured from 0 to 100) shows the speculators are currently Bullish with a score of 53.1 percent. The commercials are Bearish with a score of 42.0 percent and the small traders (not shown in chart) are Bullish-Extreme with a score of 83.6 percent.
| COCOA Futures Statistics | SPECULATORS | COMMERCIALS | SMALL TRADERS |
| – Percent of Open Interest Longs: | 29.9 | 49.1 | 6.9 |
| – Percent of Open Interest Shorts: | 16.3 | 66.3 | 3.3 |
| – Net Position: | 32,691 | -41,335 | 8,644 |
| – Gross Longs: | 71,870 | 117,753 | 16,620 |
| – Gross Shorts: | 39,179 | 159,088 | 7,976 |
| – Long to Short Ratio: | 1.8 to 1 | 0.7 to 1 | 2.1 to 1 |
| NET POSITION TREND: | |||
| – Strength Index Score (3 Year Range Pct): | 53.1 | 42.0 | 83.6 |
| – Strength Index Reading (3 Year Range): | Bullish | Bearish | Bullish-Extreme |
| NET POSITION MOVEMENT INDEX: | |||
| – 6-Week Change in Strength Index: | 4.5 | -8.9 | 49.2 |
This week’s current strength score (the trader positioning range over the past three years, measured from 0 to 100) shows the speculators are currently Bullish with a score of 56.3 percent. The commercials are Bearish with a score of 35.7 percent and the small traders (not shown in chart) are Bullish-Extreme with a score of 91.2 percent.
| WHEAT Futures Statistics | SPECULATORS | COMMERCIALS | SMALL TRADERS |
| – Percent of Open Interest Longs: | 32.5 | 43.4 | 9.0 |
| – Percent of Open Interest Shorts: | 29.3 | 44.9 | 10.7 |
| – Net Position: | 10,930 | -5,252 | -5,678 |
| – Gross Longs: | 110,614 | 147,417 | 30,713 |
| – Gross Shorts: | 99,684 | 152,669 | 36,391 |
| – Long to Short Ratio: | 1.1 to 1 | 1.0 to 1 | 0.8 to 1 |
| NET POSITION TREND: | |||
| – Strength Index Score (3 Year Range Pct): | 56.3 | 35.7 | 91.2 |
| – Strength Index Reading (3 Year Range): | Bullish | Bearish | Bullish-Extreme |
| NET POSITION MOVEMENT INDEX: | |||
| – 6-Week Change in Strength Index: | 9.0 | -10.1 | -1.3 |
Article By InvestMacro – Receive our weekly COT Reports by Email
*COT Report: The COT data, released weekly to the public each Friday, is updated through the most recent Tuesday (data is 3 days old) and shows a quick view of how large speculators or non-commercials (for-profit traders) were positioned in the futures markets.
The CFTC categorizes trader positions according to commercial hedgers (traders who use futures contracts for hedging as part of the business), non-commercials (large traders who speculate to realize trading profits) and nonreportable traders (usually small traders/speculators) as well as their open interest (contracts open in the market at time of reporting).See CFTC criteria here.
By Jeffrey Young, Georgia Institute of Technology You’ve probably heard artificial intelligence models described as…
Source: Barry Dawes (7/23/26) Barry Dawes of Martin Place Securities shares his analysis of the…
By JustMarkets The US stock indices ended Thursday’s session with a notable decline amid a…
By Analytical Department RoboForex USD/JPY soared to 163.81 on Friday, marking a new 40-year high.…
By JustMarkets The US equities ended Wednesday’s session lower amid investor caution ahead of the…
By Analytical Department RoboForex EUR/USD rose to 1.1429 on Thursday, with the US dollar continuing…
This website uses cookies.