By InvestMacro | COT | Data Tables | COT Leaders | Downloads | COT Newsletter
Here are the latest charts and statistics for the Commitment of Traders (COT) data published by the Commodities Futures Trading Commission (CFTC).
The latest COT data is updated through Tuesday March 8th and shows a quick view of how large traders (for-profit speculators and commercial entities) were positioned in the futures markets.
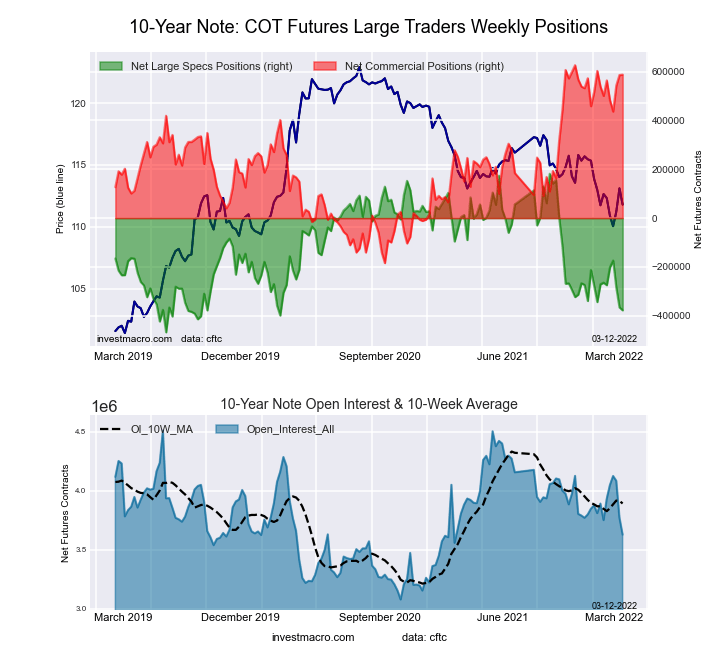
Highlighting the COT bonds data is the continued bearishness in the 10-Year Bond futures. The speculative position in the 10-Year has seen bearish bets increase for three straight weeks and by a total of -203,657 contracts over this period. This rising bearishness has pushed the 10-Year speculator standing to the most bearish level in the past one hundred and eight weeks, dating back to February 11th of 2020 when the speculator position totaled -398,919 net contracts. The current 10-Year speculator strength index score underscores the weak speculator sentiment and shows an extreme-bearish reading with a 13.9 percent score this week. (The speculator strength index measures the current speculator standing compared to past three years, where above 80 is extreme-bullish , below 20 is extreme-bearish).
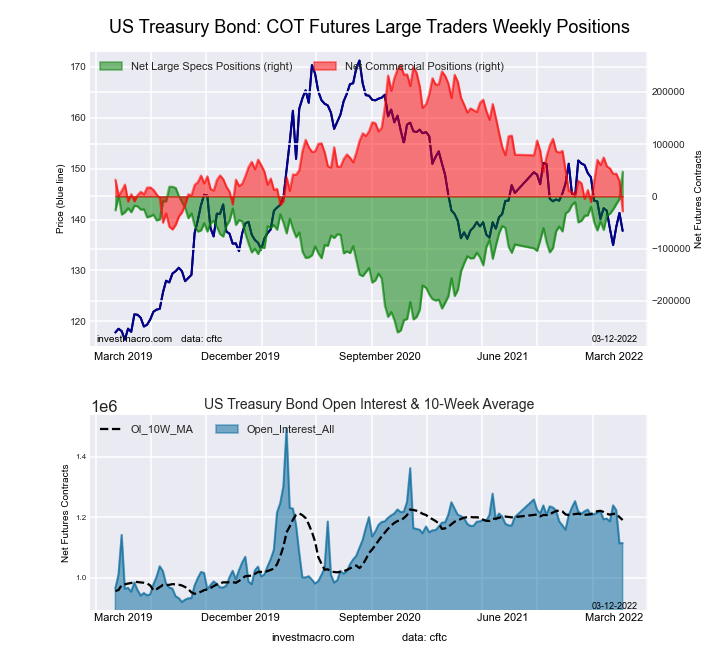
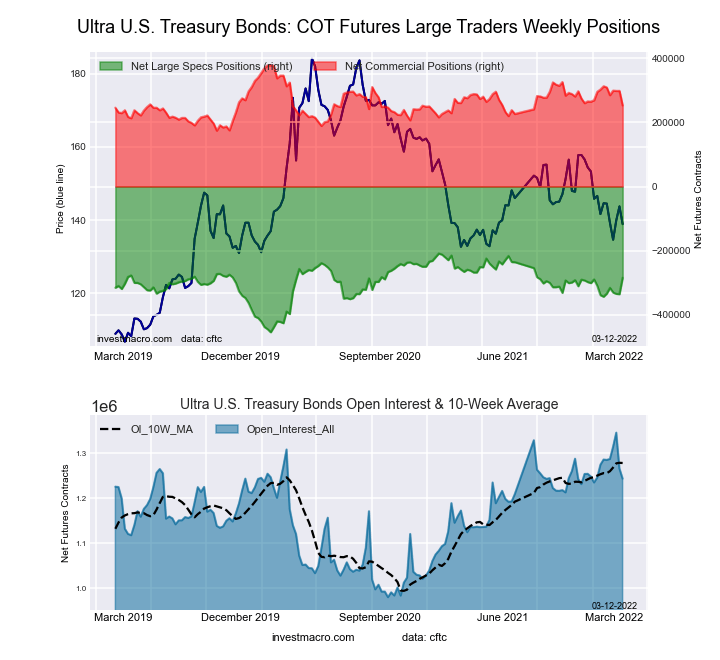
The bond markets with higher speculator bets were Long US Bond (51,897 contracts), Fed Funds (1,134 contracts), 5-Year (21,898 contracts) and the Ultra US Bond (50,843 contracts).
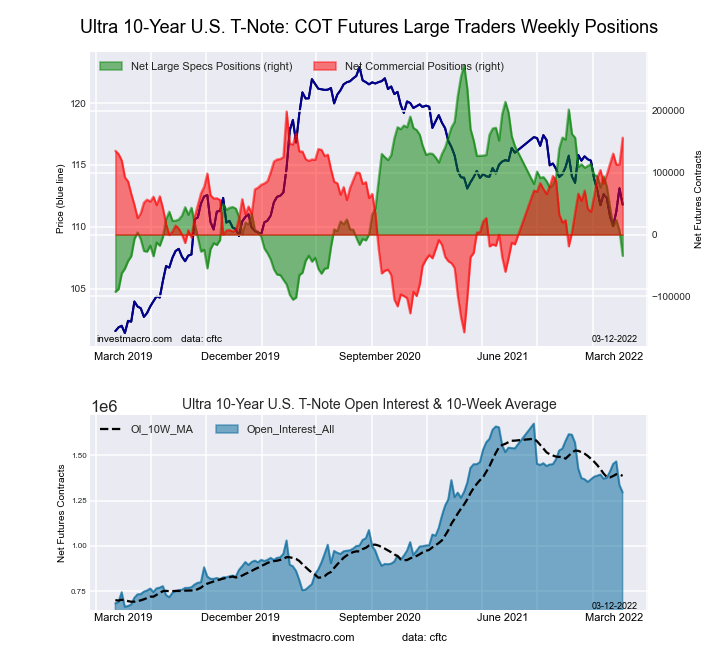
The markets with lower speculator bets were the 2-Year Bond (-1,919 contracts), Eurodollar (-164,965 contracts), 10-Year Bond (-11,937 contracts) and the Ultra 10-Year (-40,563 contracts).
Free Reports:
| Mar-08-2022 | OI | OI-Index | Spec-Net | Spec-Index | Com-Net | COM-Index | Smalls-Net | Smalls-Index |
|---|---|---|---|---|---|---|---|---|
| Eurodollar | 11,104,557 | 47 | -2,384,696 | 0 | 2,824,449 | 100 | -439,753 | 8 |
| FedFunds | 1,956,224 | 69 | -138,138 | 23 | 154,041 | 79 | -15,903 | 21 |
| 2-Year | 2,035,833 | 10 | -112,746 | 59 | 185,172 | 60 | -72,426 | 13 |
| Long T-Bond | 1,114,679 | 34 | 47,368 | 100 | -28,607 | 11 | -18,761 | 38 |
| 10-Year | 3,627,534 | 38 | -377,720 | 14 | 587,471 | 95 | -209,751 | 30 |
| 5-Year | 3,845,499 | 39 | -452,141 | 4 | 711,489 | 100 | -259,348 | 10 |
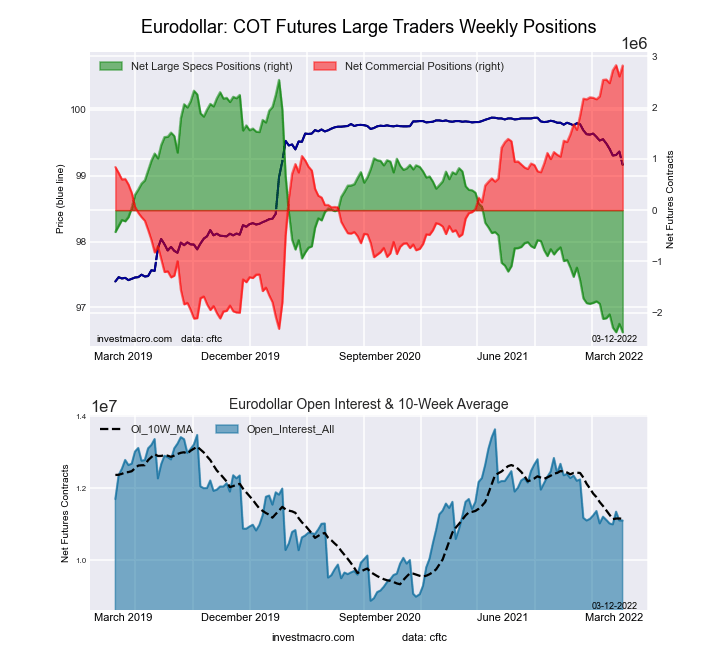
This week’s current strength score (the trader positioning range over the past three years, measured from 0 to 100) shows the speculators are currently Bearish-Extreme with a score of 0.0 percent. The commercials are Bullish-Extreme with a score of 99.9 percent and the small traders (not shown in chart) are Bearish-Extreme with a score of 7.7 percent.
| 3-Month Eurodollars Statistics | SPECULATORS | COMMERCIALS | SMALL TRADERS |
| – Percent of Open Interest Longs: | 4.6 | 75.8 | 3.7 |
| – Percent of Open Interest Shorts: | 26.1 | 50.3 | 7.6 |
| – Net Position: | -2,384,696 | 2,824,449 | -439,753 |
| – Gross Longs: | 514,260 | 8,413,589 | 405,813 |
| – Gross Shorts: | 2,898,956 | 5,589,140 | 845,566 |
| – Long to Short Ratio: | 0.2 to 1 | 1.5 to 1 | 0.5 to 1 |
| NET POSITION TREND: | |||
| – Strength Index Score (3 Year Range Pct): | 0.0 | 99.9 | 7.7 |
| – Strength Index Reading (3 Year Range): | Bearish-Extreme | Bullish-Extreme | Bearish-Extreme |
| NET POSITION MOVEMENT INDEX: | |||
| – 6-Week Change in Strength Index: | -5.3 | 5.5 | -4.0 |
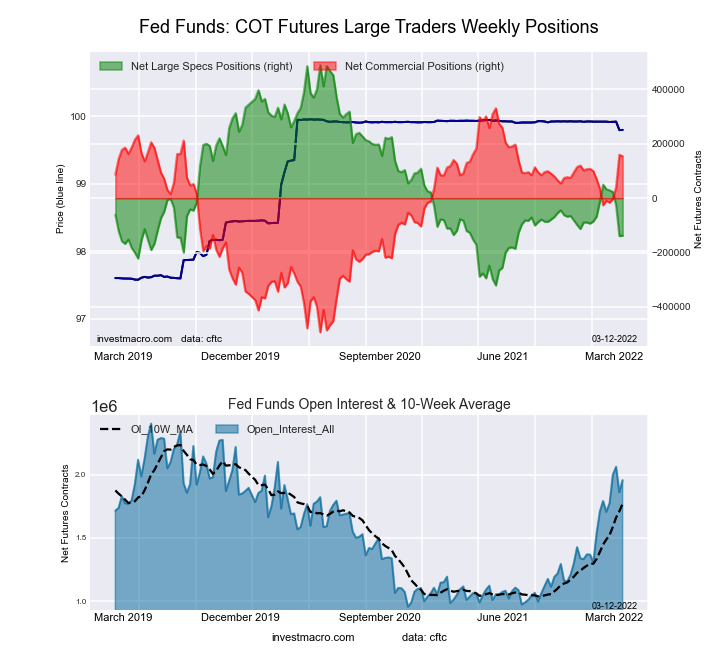
This week’s current strength score (the trader positioning range over the past three years, measured from 0 to 100) shows the speculators are currently Bearish with a score of 22.6 percent. The commercials are Bullish with a score of 78.6 percent and the small traders (not shown in chart) are Bearish with a score of 21.1 percent.
| 30-Day Federal Funds Statistics | SPECULATORS | COMMERCIALS | SMALL TRADERS |
| – Percent of Open Interest Longs: | 2.4 | 79.8 | 1.3 |
| – Percent of Open Interest Shorts: | 9.4 | 71.9 | 2.2 |
| – Net Position: | -138,138 | 154,041 | -15,903 |
| – Gross Longs: | 46,020 | 1,561,469 | 26,372 |
| – Gross Shorts: | 184,158 | 1,407,428 | 42,275 |
| – Long to Short Ratio: | 0.2 to 1 | 1.1 to 1 | 0.6 to 1 |
| NET POSITION TREND: | |||
| – Strength Index Score (3 Year Range Pct): | 22.6 | 78.6 | 21.1 |
| – Strength Index Reading (3 Year Range): | Bearish | Bullish | Bearish |
| NET POSITION MOVEMENT INDEX: | |||
| – 6-Week Change in Strength Index: | -23.2 | 21.9 | 18.3 |
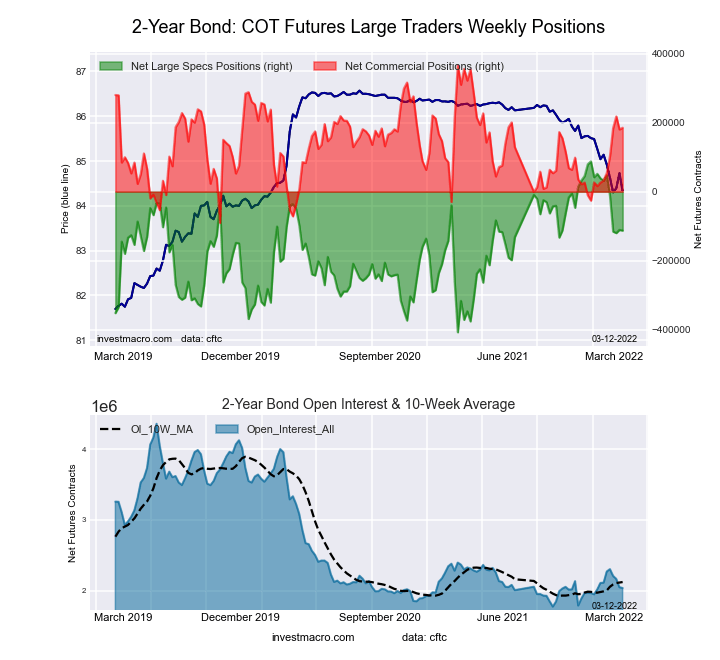
This week’s current strength score (the trader positioning range over the past three years, measured from 0 to 100) shows the speculators are currently Bullish with a score of 59.5 percent. The commercials are Bullish with a score of 60.3 percent and the small traders (not shown in chart) are Bearish-Extreme with a score of 12.9 percent.
| 2-Year Treasury Note Statistics | SPECULATORS | COMMERCIALS | SMALL TRADERS |
| – Percent of Open Interest Longs: | 12.4 | 78.6 | 6.7 |
| – Percent of Open Interest Shorts: | 18.0 | 69.5 | 10.3 |
| – Net Position: | -112,746 | 185,172 | -72,426 |
| – Gross Longs: | 253,295 | 1,600,373 | 136,835 |
| – Gross Shorts: | 366,041 | 1,415,201 | 209,261 |
| – Long to Short Ratio: | 0.7 to 1 | 1.1 to 1 | 0.7 to 1 |
| NET POSITION TREND: | |||
| – Strength Index Score (3 Year Range Pct): | 59.5 | 60.3 | 12.9 |
| – Strength Index Reading (3 Year Range): | Bullish | Bullish | Bearish-Extreme |
| NET POSITION MOVEMENT INDEX: | |||
| – 6-Week Change in Strength Index: | -29.2 | 33.3 | -3.4 |
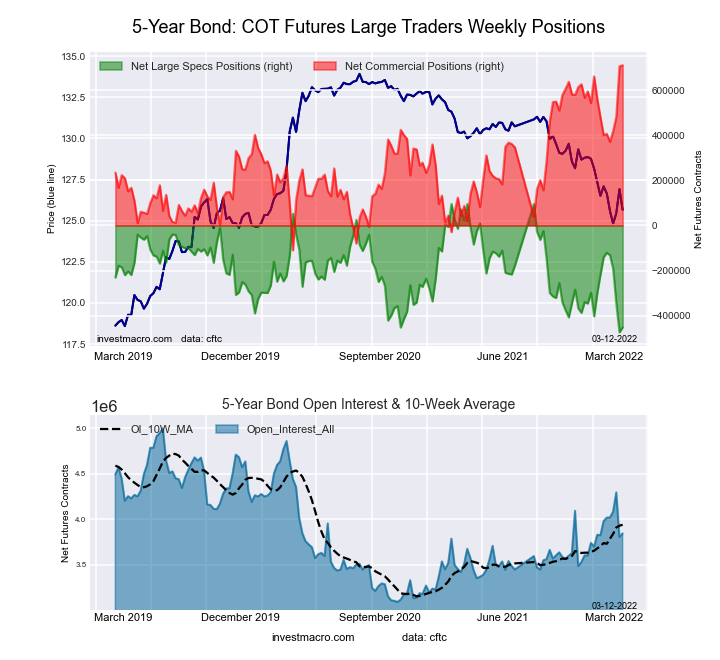
This week’s current strength score (the trader positioning range over the past three years, measured from 0 to 100) shows the speculators are currently Bearish-Extreme with a score of 3.8 percent. The commercials are Bullish-Extreme with a score of 100.0 percent and the small traders (not shown in chart) are Bearish-Extreme with a score of 9.9 percent.
| 5-Year Treasury Note Statistics | SPECULATORS | COMMERCIALS | SMALL TRADERS |
| – Percent of Open Interest Longs: | 8.0 | 83.1 | 6.8 |
| – Percent of Open Interest Shorts: | 19.8 | 64.6 | 13.6 |
| – Net Position: | -452,141 | 711,489 | -259,348 |
| – Gross Longs: | 308,793 | 3,194,985 | 261,858 |
| – Gross Shorts: | 760,934 | 2,483,496 | 521,206 |
| – Long to Short Ratio: | 0.4 to 1 | 1.3 to 1 | 0.5 to 1 |
| NET POSITION TREND: | |||
| – Strength Index Score (3 Year Range Pct): | 3.8 | 100.0 | 9.9 |
| – Strength Index Reading (3 Year Range): | Bearish-Extreme | Bullish-Extreme | Bearish-Extreme |
| NET POSITION MOVEMENT INDEX: | |||
| – 6-Week Change in Strength Index: | -54.7 | 37.7 | 0.4 |
This week’s current strength score (the trader positioning range over the past three years, measured from 0 to 100) shows the speculators are currently Bearish-Extreme with a score of 13.9 percent. The commercials are Bullish-Extreme with a score of 95.2 percent and the small traders (not shown in chart) are Bearish with a score of 29.8 percent.
| 10-Year Treasury Note Statistics | SPECULATORS | COMMERCIALS | SMALL TRADERS |
| – Percent of Open Interest Longs: | 8.4 | 80.1 | 8.3 |
| – Percent of Open Interest Shorts: | 18.8 | 63.9 | 14.1 |
| – Net Position: | -377,720 | 587,471 | -209,751 |
| – Gross Longs: | 305,324 | 2,904,848 | 301,231 |
| – Gross Shorts: | 683,044 | 2,317,377 | 510,982 |
| – Long to Short Ratio: | 0.4 to 1 | 1.3 to 1 | 0.6 to 1 |
| NET POSITION TREND: | |||
| – Strength Index Score (3 Year Range Pct): | 13.9 | 95.2 | 29.8 |
| – Strength Index Reading (3 Year Range): | Bearish-Extreme | Bullish-Extreme | Bearish |
| NET POSITION MOVEMENT INDEX: | |||
| – 6-Week Change in Strength Index: | -17.4 | 10.7 | 6.1 |
This week’s current strength score (the trader positioning range over the past three years, measured from 0 to 100) shows the speculators are currently Bearish-Extreme with a score of 18.7 percent. The commercials are Bullish-Extreme with a score of 88.2 percent and the small traders (not shown in chart) are Bearish with a score of 41.9 percent.
| Ultra 10-Year Notes Statistics | SPECULATORS | COMMERCIALS | SMALL TRADERS |
| – Percent of Open Interest Longs: | 11.9 | 77.6 | 9.3 |
| – Percent of Open Interest Shorts: | 14.6 | 65.5 | 18.7 |
| – Net Position: | -34,380 | 156,564 | -122,184 |
| – Gross Longs: | 154,635 | 1,006,050 | 119,951 |
| – Gross Shorts: | 189,015 | 849,486 | 242,135 |
| – Long to Short Ratio: | 0.8 to 1 | 1.2 to 1 | 0.5 to 1 |
| NET POSITION TREND: | |||
| – Strength Index Score (3 Year Range Pct): | 18.7 | 88.2 | 41.9 |
| – Strength Index Reading (3 Year Range): | Bearish-Extreme | Bullish-Extreme | Bearish |
| NET POSITION MOVEMENT INDEX: | |||
| – 6-Week Change in Strength Index: | -34.0 | 20.8 | 32.7 |
This week’s current strength score (the trader positioning range over the past three years, measured from 0 to 100) shows the speculators are currently Bullish-Extreme with a score of 100.0 percent. The commercials are Bearish-Extreme with a score of 11.0 percent and the small traders (not shown in chart) are Bearish with a score of 37.7 percent.
| US Treasury Bonds Statistics | SPECULATORS | COMMERCIALS | SMALL TRADERS |
| – Percent of Open Interest Longs: | 11.9 | 71.5 | 13.8 |
| – Percent of Open Interest Shorts: | 7.7 | 74.1 | 15.5 |
| – Net Position: | 47,368 | -28,607 | -18,761 |
| – Gross Longs: | 132,656 | 797,310 | 154,047 |
| – Gross Shorts: | 85,288 | 825,917 | 172,808 |
| – Long to Short Ratio: | 1.6 to 1 | 1.0 to 1 | 0.9 to 1 |
| NET POSITION TREND: | |||
| – Strength Index Score (3 Year Range Pct): | 100.0 | 11.0 | 37.7 |
| – Strength Index Reading (3 Year Range): | Bullish-Extreme | Bearish-Extreme | Bearish |
| NET POSITION MOVEMENT INDEX: | |||
| – 6-Week Change in Strength Index: | 36.3 | -32.8 | -6.8 |
This week’s current strength score (the trader positioning range over the past three years, measured from 0 to 100) shows the speculators are currently Bullish with a score of 69.2 percent. The commercials are Bearish with a score of 38.5 percent and the small traders (not shown in chart) are Bullish with a score of 51.2 percent.
| Ultra US Treasury Bonds Statistics | SPECULATORS | COMMERCIALS | SMALL TRADERS |
| – Percent of Open Interest Longs: | 6.7 | 80.8 | 11.8 |
| – Percent of Open Interest Shorts: | 29.6 | 60.5 | 9.3 |
| – Net Position: | -284,418 | 252,520 | 31,898 |
| – Gross Longs: | 83,173 | 1,004,968 | 147,181 |
| – Gross Shorts: | 367,591 | 752,448 | 115,283 |
| – Long to Short Ratio: | 0.2 to 1 | 1.3 to 1 | 1.3 to 1 |
| NET POSITION TREND: | |||
| – Strength Index Score (3 Year Range Pct): | 69.2 | 38.5 | 51.2 |
| – Strength Index Reading (3 Year Range): | Bullish | Bearish | Bullish |
| NET POSITION MOVEMENT INDEX: | |||
| – 6-Week Change in Strength Index: | 24.0 | -29.3 | 0.7 |
Article By InvestMacro – Receive our weekly COT Reports by Email
*COT Report: The COT data, released weekly to the public each Friday, is updated through the most recent Tuesday (data is 3 days old) and shows a quick view of how large speculators or non-commercials (for-profit traders) were positioned in the futures markets.
The CFTC categorizes trader positions according to commercial hedgers (traders who use futures contracts for hedging as part of the business), non-commercials (large traders who speculate to realize trading profits) and nonreportable traders (usually small traders/speculators) as well as their open interest (contracts open in the market at time of reporting).See CFTC criteria here.
By Jeffrey Young, Georgia Institute of Technology You’ve probably heard artificial intelligence models described as…
Source: Barry Dawes (7/23/26) Barry Dawes of Martin Place Securities shares his analysis of the…
By JustMarkets The US stock indices ended Thursday’s session with a notable decline amid a…
By Analytical Department RoboForex USD/JPY soared to 163.81 on Friday, marking a new 40-year high.…
By JustMarkets The US equities ended Wednesday’s session lower amid investor caution ahead of the…
By Analytical Department RoboForex EUR/USD rose to 1.1429 on Thursday, with the US dollar continuing…
This website uses cookies.