By InvestMacro | COT | Data Tables | COT Leaders | Downloads | COT Newsletter
Here are the latest charts and statistics for the Commitment of Traders (COT) data published by the Commodities Futures Trading Commission (CFTC).
The latest COT data is updated through Tuesday February 8th 2022 and shows a quick view of how large traders (for-profit speculators and commercial entities) were positioned in the futures markets.
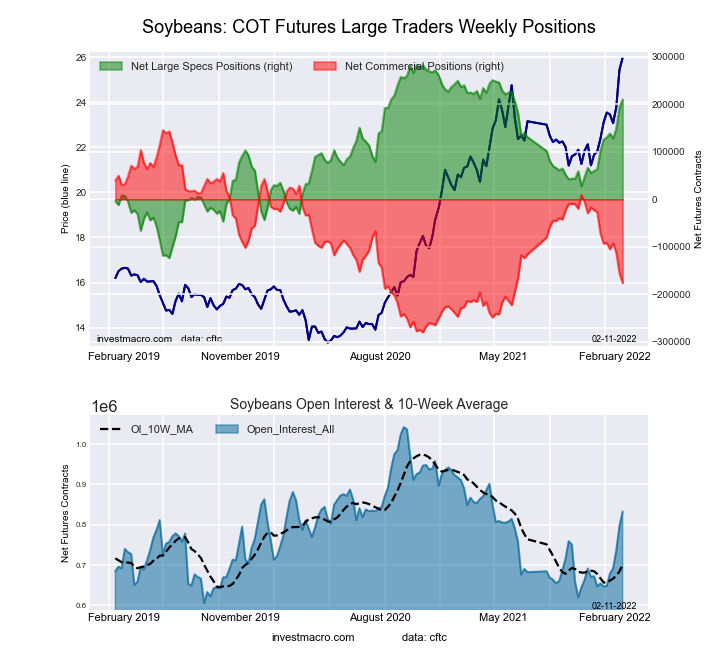
Highlighting the COT soft commodities data is the continued increases in the Soybeans futures bets. The speculative net position in the Soybeans futures rose for a third consecutive week this week and for the ninth time out of the past ten weeks. Over the past ten weeks, the speculative position has surged higher by a total of 154,413 net contracts and has now pushed the current net spec standing to a thirty-five week high at over +209,000 contracts. The Soybeans positioning has reached an extreme speculator level of 82.2 percent in the strength index readings this week (current spec level compared to past three years of data where above 80% is extreme bullish and below 20% is extreme bearish) for the first time since June 15th of 2021.
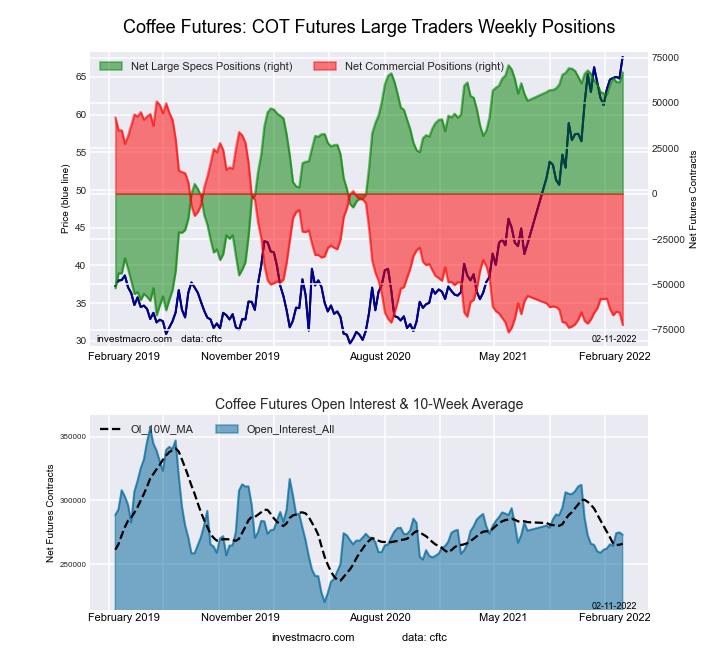
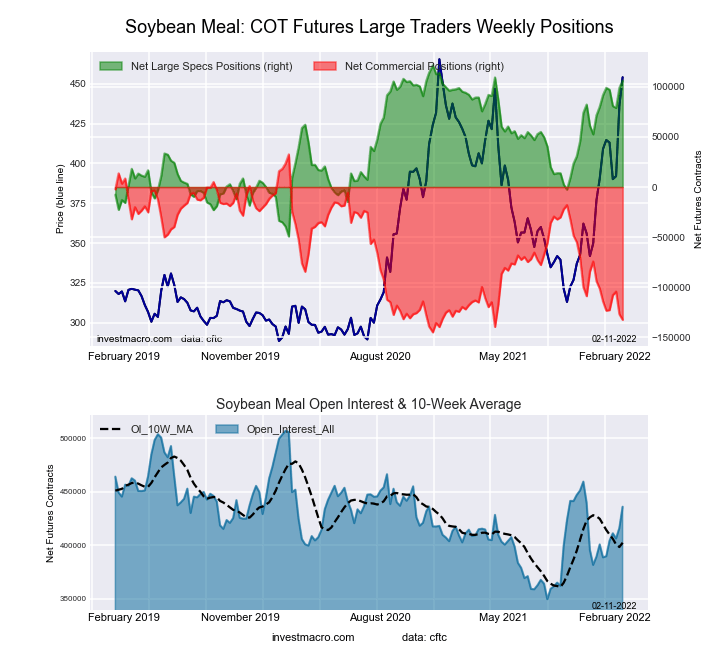
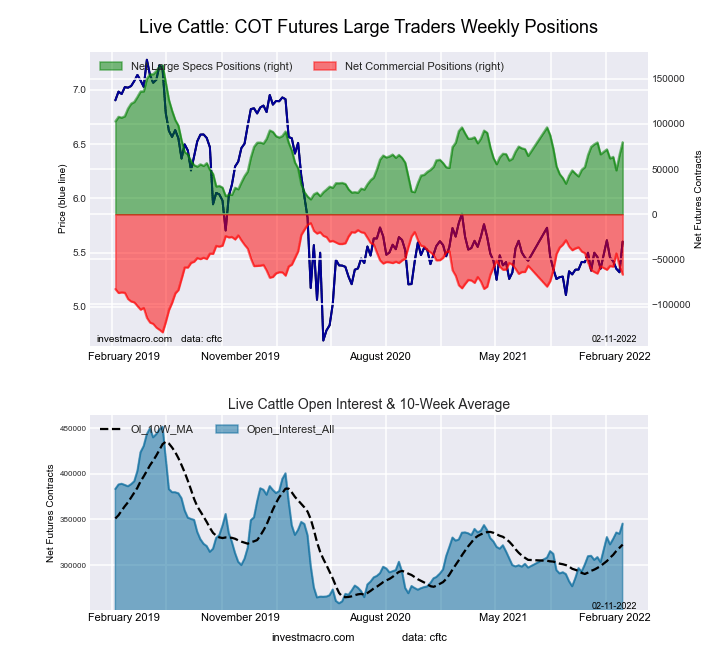
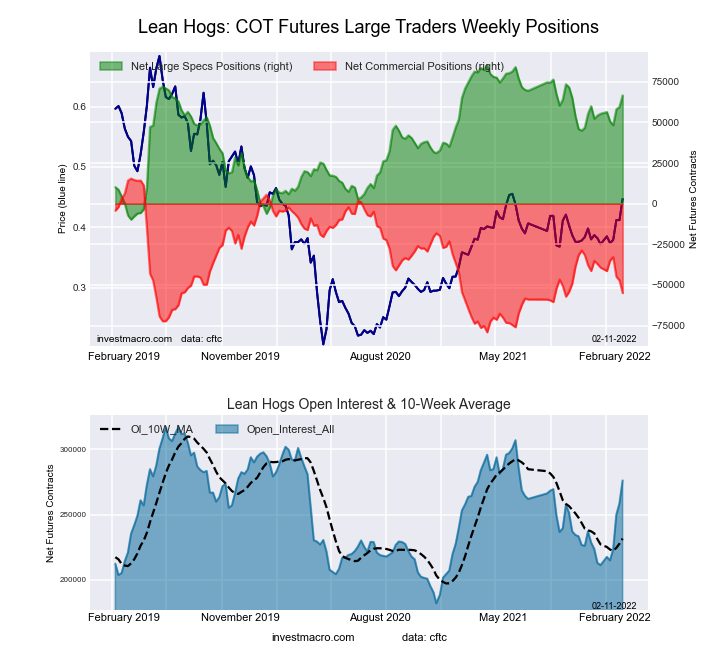
The soft commodities that saw higher bets this week were Soybeans (16,357 contracts), Coffee (5,489 contracts), Soybean Meal (7,421 contracts), Live Cattle (14,301 contracts), Lean Hogs (7,121 contracts), Cocoa (15,093 contracts) and Wheat (-3,928 contracts).
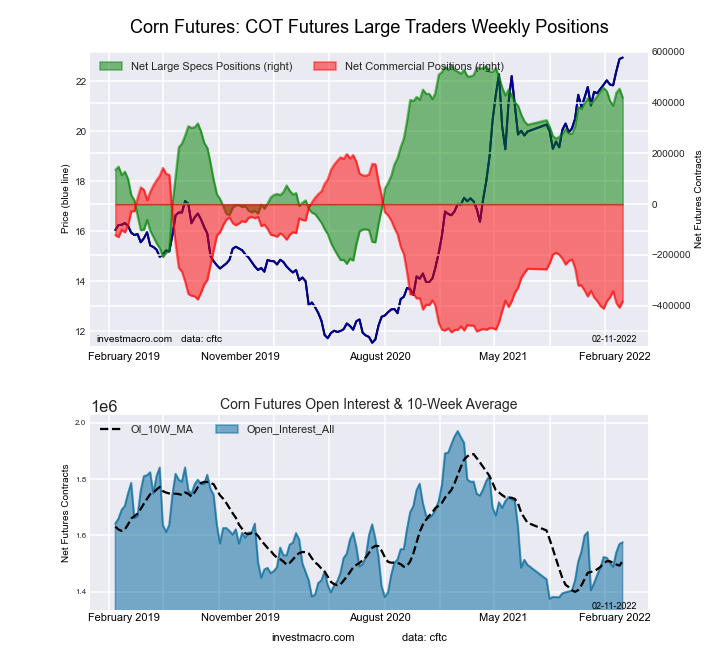
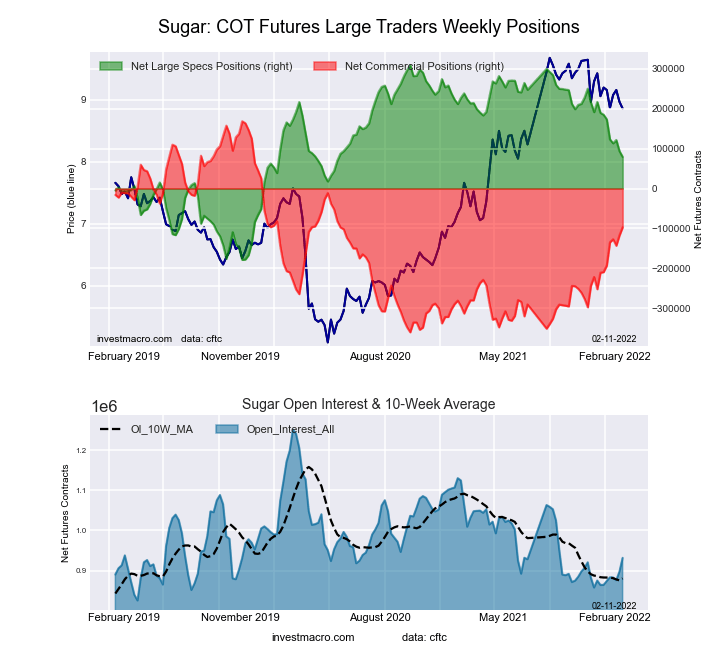
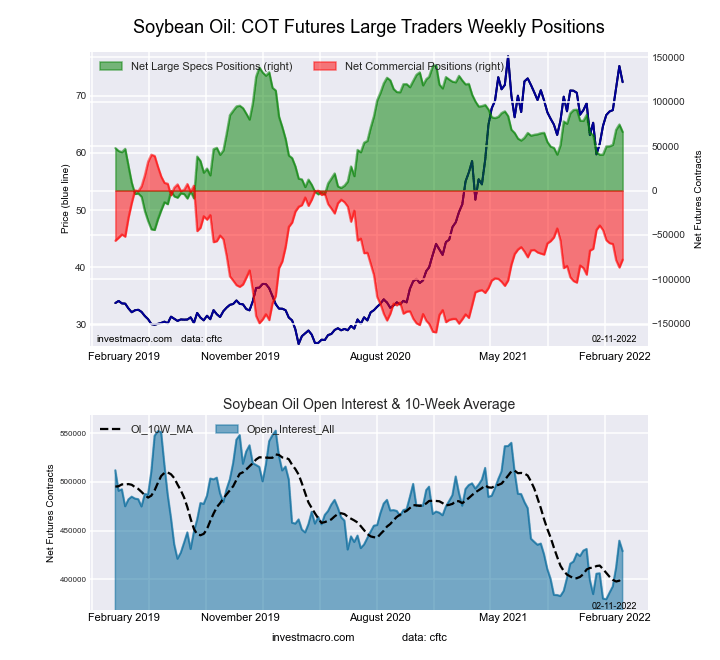
The soft commodities that saw lower bets this week were Corn (-35,618 contracts), Sugar (-14,503 contracts), Cotton (-1,790 contracts) and Soybean Oil (-8,375 contracts).
Free Reports:
| Feb-08-2022 | OI | OI-Index | Spec-Net | Spec-Index | Com-Net | COM-Index | Smalls-Net | Smalls-Index |
|---|---|---|---|---|---|---|---|---|
| WTI Crude | 2,170,681 | 46 | 363,383 | 18 | -412,144 | 69 | 48,761 | 84 |
| Gold | 512,842 | 23 | 186,706 | 47 | -211,434 | 53 | 24,728 | 34 |
| Silver | 147,379 | 14 | 19,299 | 42 | -32,571 | 67 | 13,272 | 20 |
| Copper | 201,860 | 28 | 18,855 | 56 | -25,523 | 42 | 6,668 | 64 |
| Palladium | 7,497 | 5 | -1,230 | 14 | 1,035 | 83 | 195 | 56 |
| Platinum | 58,766 | 20 | 11,759 | 19 | -16,638 | 85 | 4,879 | 30 |
| Natural Gas | 1,133,934 | 6 | -115,089 | 44 | 85,151 | 58 | 29,938 | 55 |
| Brent | 208,578 | 46 | -26,323 | 73 | 22,725 | 27 | 3,598 | 58 |
| Heating Oil | 349,618 | 31 | 6,455 | 52 | -32,434 | 37 | 25,979 | 88 |
| Soybeans | 832,618 | 52 | 209,730 | 82 | -176,080 | 24 | -33,650 | 14 |
| Corn | 1,575,318 | 34 | 419,602 | 84 | -382,874 | 17 | -36,728 | 22 |
| Coffee | 273,102 | 39 | 66,867 | 97 | -72,255 | 3 | 5,388 | 26 |
| Sugar | 931,602 | 25 | 79,090 | 53 | -96,963 | 50 | 17,873 | 30 |
| Wheat | 385,172 | 26 | -3,578 | 44 | 7,972 | 49 | -4,394 | 81 |
This week’s current strength score (the trader positioning range over the past three years, measured from 0 to 100) shows the speculators are currently Bullish-Extreme with a score of 83.6 percent. The commercials are Bearish-Extreme with a score of 17.4 percent and the small traders (not shown in chart) are Bearish with a score of 21.9 percent.
| CORN Futures Statistics | SPECULATORS | COMMERCIALS | SMALL TRADERS |
| – Percent of Open Interest Longs: | 33.0 | 44.0 | 9.4 |
| – Percent of Open Interest Shorts: | 6.4 | 68.3 | 11.8 |
| – Net Position: | 419,602 | -382,874 | -36,728 |
| – Gross Longs: | 519,855 | 693,712 | 148,454 |
| – Gross Shorts: | 100,253 | 1,076,586 | 185,182 |
| – Long to Short Ratio: | 5.2 to 1 | 0.6 to 1 | 0.8 to 1 |
| NET POSITION TREND: | |||
| – Strength Index Score (3 Year Range Pct): | 83.6 | 17.4 | 21.9 |
| – Strength Index Reading (3 Year Range): | Bullish-Extreme | Bearish-Extreme | Bearish |
| NET POSITION MOVEMENT INDEX: | |||
| – 6-Week Change in Strength Index: | -4.9 | 4.1 | 5.5 |
This week’s current strength score (the trader positioning range over the past three years, measured from 0 to 100) shows the speculators are currently Bullish with a score of 52.9 percent. The commercials are Bearish with a score of 49.8 percent and the small traders (not shown in chart) are Bearish with a score of 30.0 percent.
| SUGAR Futures Statistics | SPECULATORS | COMMERCIALS | SMALL TRADERS |
| – Percent of Open Interest Longs: | 19.8 | 57.1 | 8.9 |
| – Percent of Open Interest Shorts: | 11.3 | 67.5 | 7.0 |
| – Net Position: | 79,090 | -96,963 | 17,873 |
| – Gross Longs: | 184,040 | 532,127 | 83,261 |
| – Gross Shorts: | 104,950 | 629,090 | 65,388 |
| – Long to Short Ratio: | 1.8 to 1 | 0.8 to 1 | 1.3 to 1 |
| NET POSITION TREND: | |||
| – Strength Index Score (3 Year Range Pct): | 52.9 | 49.8 | 30.0 |
| – Strength Index Reading (3 Year Range): | Bullish | Bearish | Bearish |
| NET POSITION MOVEMENT INDEX: | |||
| – 6-Week Change in Strength Index: | -21.7 | 21.2 | -8.0 |
This week’s current strength score (the trader positioning range over the past three years, measured from 0 to 100) shows the speculators are currently Bullish-Extreme with a score of 97.2 percent. The commercials are Bearish-Extreme with a score of 3.2 percent and the small traders (not shown in chart) are Bearish with a score of 25.6 percent.
| COFFEE Futures Statistics | SPECULATORS | COMMERCIALS | SMALL TRADERS |
| – Percent of Open Interest Longs: | 29.3 | 42.3 | 4.6 |
| – Percent of Open Interest Shorts: | 4.8 | 68.8 | 2.7 |
| – Net Position: | 66,867 | -72,255 | 5,388 |
| – Gross Longs: | 79,999 | 115,622 | 12,695 |
| – Gross Shorts: | 13,132 | 187,877 | 7,307 |
| – Long to Short Ratio: | 6.1 to 1 | 0.6 to 1 | 1.7 to 1 |
| NET POSITION TREND: | |||
| – Strength Index Score (3 Year Range Pct): | 97.2 | 3.2 | 25.6 |
| – Strength Index Reading (3 Year Range): | Bullish-Extreme | Bearish-Extreme | Bearish |
| NET POSITION MOVEMENT INDEX: | |||
| – 6-Week Change in Strength Index: | 8.4 | -11.2 | 18.3 |
This week’s current strength score (the trader positioning range over the past three years, measured from 0 to 100) shows the speculators are currently Bullish-Extreme with a score of 82.2 percent. The commercials are Bearish with a score of 24.4 percent and the small traders (not shown in chart) are Bearish-Extreme with a score of 14.4 percent.
| SOYBEANS Futures Statistics | SPECULATORS | COMMERCIALS | SMALL TRADERS |
| – Percent of Open Interest Longs: | 30.7 | 45.5 | 6.7 |
| – Percent of Open Interest Shorts: | 5.5 | 66.6 | 10.7 |
| – Net Position: | 209,730 | -176,080 | -33,650 |
| – Gross Longs: | 255,224 | 378,830 | 55,648 |
| – Gross Shorts: | 45,494 | 554,910 | 89,298 |
| – Long to Short Ratio: | 5.6 to 1 | 0.7 to 1 | 0.6 to 1 |
| NET POSITION TREND: | |||
| – Strength Index Score (3 Year Range Pct): | 82.2 | 24.4 | 14.4 |
| – Strength Index Reading (3 Year Range): | Bullish-Extreme | Bearish | Bearish-Extreme |
| NET POSITION MOVEMENT INDEX: | |||
| – 6-Week Change in Strength Index: | 20.8 | -19.5 | -2.4 |
This week’s current strength score (the trader positioning range over the past three years, measured from 0 to 100) shows the speculators are currently Bullish with a score of 59.5 percent. The commercials are Bearish with a score of 40.9 percent and the small traders (not shown in chart) are Bullish with a score of 57.2 percent.
| SOYBEAN OIL Futures Statistics | SPECULATORS | COMMERCIALS | SMALL TRADERS |
| – Percent of Open Interest Longs: | 25.2 | 47.7 | 8.6 |
| – Percent of Open Interest Shorts: | 9.8 | 65.8 | 5.9 |
| – Net Position: | 66,035 | -77,767 | 11,732 |
| – Gross Longs: | 107,923 | 204,514 | 36,975 |
| – Gross Shorts: | 41,888 | 282,281 | 25,243 |
| – Long to Short Ratio: | 2.6 to 1 | 0.7 to 1 | 1.5 to 1 |
| NET POSITION TREND: | |||
| – Strength Index Score (3 Year Range Pct): | 59.5 | 40.9 | 57.2 |
| – Strength Index Reading (3 Year Range): | Bullish | Bearish | Bullish |
| NET POSITION MOVEMENT INDEX: | |||
| – 6-Week Change in Strength Index: | 13.7 | -16.6 | 29.2 |
This week’s current strength score (the trader positioning range over the past three years, measured from 0 to 100) shows the speculators are currently Bullish-Extreme with a score of 91.0 percent. The commercials are Bearish-Extreme with a score of 7.0 percent and the small traders (not shown in chart) are Bullish with a score of 76.0 percent.
| SOYBEAN MEAL Futures Statistics | SPECULATORS | COMMERCIALS | SMALL TRADERS |
| – Percent of Open Interest Longs: | 29.4 | 43.0 | 11.0 |
| – Percent of Open Interest Shorts: | 5.1 | 73.4 | 5.0 |
| – Net Position: | 106,260 | -132,541 | 26,281 |
| – Gross Longs: | 128,328 | 187,284 | 48,040 |
| – Gross Shorts: | 22,068 | 319,825 | 21,759 |
| – Long to Short Ratio: | 5.8 to 1 | 0.6 to 1 | 2.2 to 1 |
| NET POSITION TREND: | |||
| – Strength Index Score (3 Year Range Pct): | 91.0 | 7.0 | 76.0 |
| – Strength Index Reading (3 Year Range): | Bullish-Extreme | Bearish-Extreme | Bullish |
| NET POSITION MOVEMENT INDEX: | |||
| – 6-Week Change in Strength Index: | 8.5 | -10.4 | 15.6 |
This week’s current strength score (the trader positioning range over the past three years, measured from 0 to 100) shows the speculators are currently Bearish with a score of 42.6 percent. The commercials are Bullish with a score of 52.8 percent and the small traders (not shown in chart) are Bullish with a score of 55.7 percent.
| LIVE CATTLE Futures Statistics | SPECULATORS | COMMERCIALS | SMALL TRADERS |
| – Percent of Open Interest Longs: | 37.5 | 36.9 | 9.9 |
| – Percent of Open Interest Shorts: | 14.4 | 56.2 | 13.7 |
| – Net Position: | 79,809 | -66,920 | -12,889 |
| – Gross Longs: | 129,605 | 127,373 | 34,272 |
| – Gross Shorts: | 49,796 | 194,293 | 47,161 |
| – Long to Short Ratio: | 2.6 to 1 | 0.7 to 1 | 0.7 to 1 |
| NET POSITION TREND: | |||
| – Strength Index Score (3 Year Range Pct): | 42.6 | 52.8 | 55.7 |
| – Strength Index Reading (3 Year Range): | Bearish | Bullish | Bullish |
| NET POSITION MOVEMENT INDEX: | |||
| – 6-Week Change in Strength Index: | 9.6 | -7.6 | -12.2 |
This week’s current strength score (the trader positioning range over the past three years, measured from 0 to 100) shows the speculators are currently Bullish with a score of 79.7 percent. The commercials are Bearish with a score of 25.8 percent and the small traders (not shown in chart) are Bearish with a score of 29.7 percent.
| LEAN HOGS Futures Statistics | SPECULATORS | COMMERCIALS | SMALL TRADERS |
| – Percent of Open Interest Longs: | 41.3 | 31.9 | 8.2 |
| – Percent of Open Interest Shorts: | 17.2 | 51.8 | 12.4 |
| – Net Position: | 66,642 | -54,973 | -11,669 |
| – Gross Longs: | 114,130 | 88,056 | 22,616 |
| – Gross Shorts: | 47,488 | 143,029 | 34,285 |
| – Long to Short Ratio: | 2.4 to 1 | 0.6 to 1 | 0.7 to 1 |
| NET POSITION TREND: | |||
| – Strength Index Score (3 Year Range Pct): | 79.7 | 25.8 | 29.7 |
| – Strength Index Reading (3 Year Range): | Bullish | Bearish | Bearish |
| NET POSITION MOVEMENT INDEX: | |||
| – 6-Week Change in Strength Index: | 9.5 | -13.3 | 15.1 |
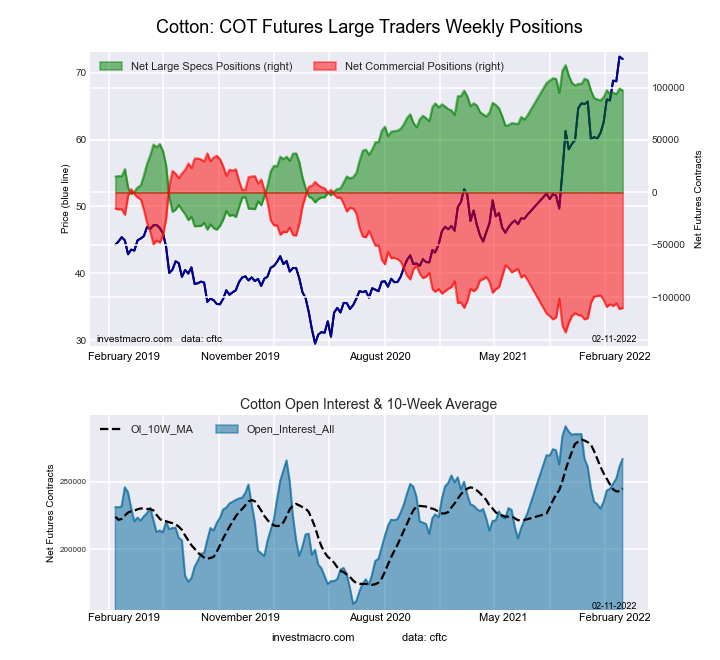
This week’s current strength score (the trader positioning range over the past three years, measured from 0 to 100) shows the speculators are currently Bullish-Extreme with a score of 84.6 percent. The commercials are Bearish-Extreme with a score of 13.6 percent and the small traders (not shown in chart) are Bullish-Extreme with a score of 94.1 percent.
| COTTON Futures Statistics | SPECULATORS | COMMERCIALS | SMALL TRADERS |
| – Percent of Open Interest Longs: | 42.1 | 36.5 | 7.8 |
| – Percent of Open Interest Shorts: | 5.7 | 77.8 | 3.0 |
| – Net Position: | 97,210 | -110,111 | 12,901 |
| – Gross Longs: | 112,341 | 97,445 | 20,934 |
| – Gross Shorts: | 15,131 | 207,556 | 8,033 |
| – Long to Short Ratio: | 7.4 to 1 | 0.5 to 1 | 2.6 to 1 |
| NET POSITION TREND: | |||
| – Strength Index Score (3 Year Range Pct): | 84.6 | 13.6 | 94.1 |
| – Strength Index Reading (3 Year Range): | Bullish-Extreme | Bearish-Extreme | Bullish-Extreme |
| NET POSITION MOVEMENT INDEX: | |||
| – 6-Week Change in Strength Index: | 4.0 | -4.5 | 8.0 |
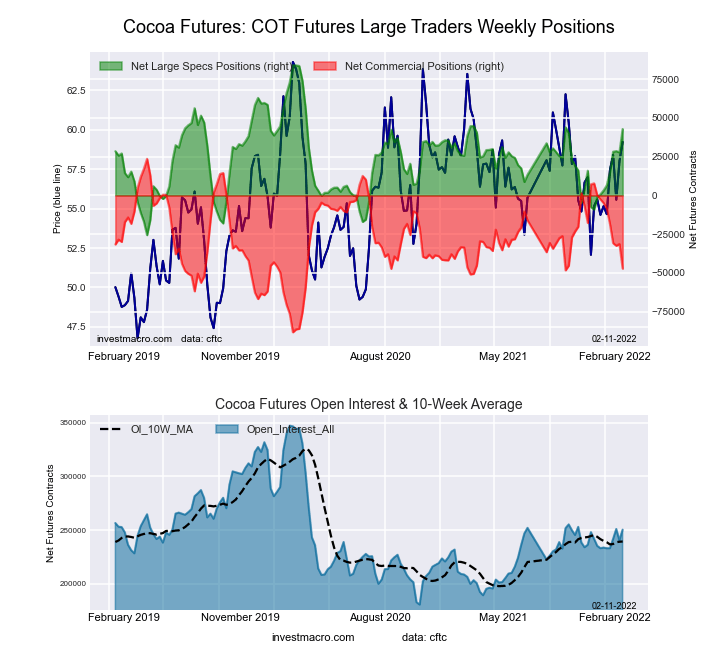
This week’s current strength score (the trader positioning range over the past three years, measured from 0 to 100) shows the speculators are currently Bullish with a score of 62.4 percent. The commercials are Bearish with a score of 36.7 percent and the small traders (not shown in chart) are Bullish with a score of 58.3 percent.
| COCOA Futures Statistics | SPECULATORS | COMMERCIALS | SMALL TRADERS |
| – Percent of Open Interest Longs: | 31.4 | 43.7 | 5.0 |
| – Percent of Open Interest Shorts: | 14.3 | 62.6 | 3.2 |
| – Net Position: | 42,855 | -47,234 | 4,379 |
| – Gross Longs: | 78,615 | 109,531 | 12,487 |
| – Gross Shorts: | 35,760 | 156,765 | 8,108 |
| – Long to Short Ratio: | 2.2 to 1 | 0.7 to 1 | 1.5 to 1 |
| NET POSITION TREND: | |||
| – Strength Index Score (3 Year Range Pct): | 62.4 | 36.7 | 58.3 |
| – Strength Index Reading (3 Year Range): | Bullish | Bearish | Bullish |
| NET POSITION MOVEMENT INDEX: | |||
| – 6-Week Change in Strength Index: | 36.1 | -37.8 | 31.2 |
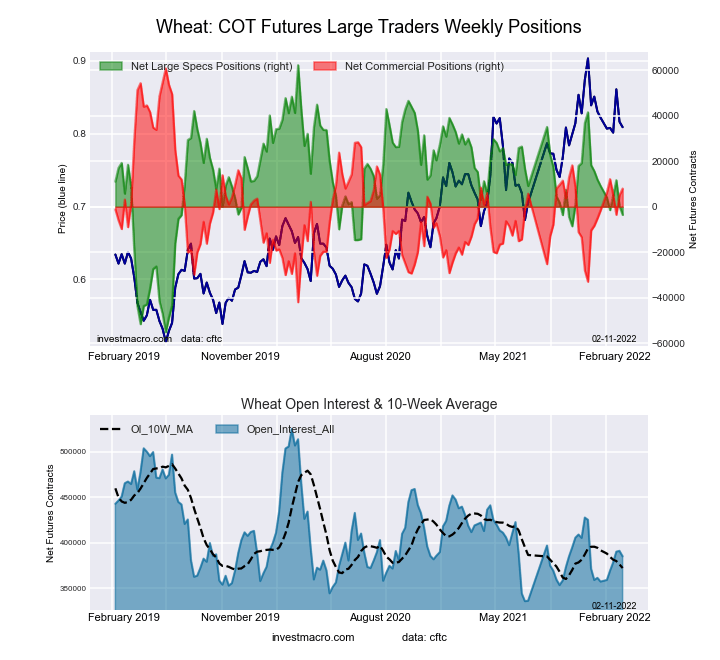
This week’s current strength score (the trader positioning range over the past three years, measured from 0 to 100) shows the speculators are currently Bearish with a score of 44.0 percent. The commercials are Bearish with a score of 48.6 percent and the small traders (not shown in chart) are Bullish-Extreme with a score of 80.6 percent.
| WHEAT Futures Statistics | SPECULATORS | COMMERCIALS | SMALL TRADERS |
| – Percent of Open Interest Longs: | 27.0 | 39.5 | 9.5 |
| – Percent of Open Interest Shorts: | 27.9 | 37.4 | 10.6 |
| – Net Position: | -3,578 | 7,972 | -4,394 |
| – Gross Longs: | 103,885 | 152,212 | 36,456 |
| – Gross Shorts: | 107,463 | 144,240 | 40,850 |
| – Long to Short Ratio: | 1.0 to 1 | 1.1 to 1 | 0.9 to 1 |
| NET POSITION TREND: | |||
| – Strength Index Score (3 Year Range Pct): | 44.0 | 48.6 | 80.6 |
| – Strength Index Reading (3 Year Range): | Bearish | Bearish | Bullish-Extreme |
| NET POSITION MOVEMENT INDEX: | |||
| – 6-Week Change in Strength Index: | -8.1 | 6.2 | 14.8 |
Article By InvestMacro – Receive our weekly COT Reports by Email
*COT Report: The COT data, released weekly to the public each Friday, is updated through the most recent Tuesday (data is 3 days old) and shows a quick view of how large speculators or non-commercials (for-profit traders) were positioned in the futures markets.
The CFTC categorizes trader positions according to commercial hedgers (traders who use futures contracts for hedging as part of the business), non-commercials (large traders who speculate to realize trading profits) and nonreportable traders (usually small traders/speculators) as well as their open interest (contracts open in the market at time of reporting).See CFTC criteria here.
By JustMarkets On Tuesday, the US stock indices finished the session in the green, supported…
By Analytical Department RoboForex GBP/USD rose to 1.3403 on Wednesday, with British politics taking centre…
By Analytical Department RoboForex USD/JPY ended Tuesday at 162.27, with the Japanese yen remaining near…
By JustMarkets On Friday, the Dow Jones Index (US30) rose by 0.29% (weekly: -0.36%). The…
By Analytical Department RoboForex EUR/USD opens the week around 1.1433. Investors continue to assess the…
By InvestMacro Here are the latest charts and statistics for the Commitment of Traders (COT)…
This website uses cookies.