
By InvestMacro | COT | Data Tables | COT Leaders | Downloads | COT Newsletter
Here are the latest charts and statistics for the Commitment of Traders (COT) data published by the Commodities Futures Trading Commission (CFTC).
The latest COT data is updated through Tuesday February 15th and shows a quick view of how large traders (for-profit speculators and commercial entities) were positioned in the futures markets.
Highlighting the COT soft commodities data is the recent turnaround in speculator sentiment for the Sugar futures bets. The speculative net position in the Sugar futures has fallen for three straight weeks and in ten out of the past twelve weeks. Overall, the net position has now decreased by a total of -170,063 net contracts over the past twelve weeks.
Sugar bullish bets had been on a strong uptrend from 2020 through 2021 with speculator bullish bets reaching a recent high of +302,267 net contracts on August 17th. Since then, contracts and sugar prices have cooled off and have started lower with the trend accelerating over the past few months. The slipping sentiment has pushed the current speculator standing for Sugar to the lowest level of the past ninety-one weeks, dating back to May of 2020.
The soft commodities that saw higher bets this week were Coffee (3,558 contracts), Soybeans (7,002 contracts), Soybean Oil (1,285 contracts), Soybean Meal (3,284 contracts), Live Cattle (3,758 contracts), Lean Hogs (690 contracts) and Cocoa (6,361 contracts).
Free Reports:
 Get our Weekly Commitment of Traders Reports - See where the biggest traders (Hedge Funds and Commercial Hedgers) are positioned in the futures markets on a weekly basis.
 Sign Up for Our Stock Market Newsletter – Get updated on News, Charts & Rankings of Public Companies when you join our Stocks Newsletter
The soft commodities that saw lower bets this week were Corn (-5,110 contracts), Sugar (-4,527 contracts), Cotton (-3,487 contracts) and Wheat (-2,268 contracts).
| Feb-15-2022 | OI | OI-Index | Spec-Net | Spec-Index | Com-Net | COM-Index | Smalls-Net | Smalls-Index |
|---|---|---|---|---|---|---|---|---|
| WTI Crude | 2,122,758 | 39 | 348,093 | 8 | -392,000 | 80 | 43,907 | 77 |
| Gold | 558,645 | 35 | 213,613 | 56 | -238,875 | 45 | 25,262 | 36 |
| Silver | 156,968 | 23 | 23,556 | 46 | -36,348 | 63 | 12,792 | 17 |
| Copper | 210,089 | 34 | 30,692 | 64 | -39,421 | 32 | 8,729 | 76 |
| Palladium | 8,358 | 9 | -1,000 | 15 | 903 | 83 | 97 | 50 |
| Platinum | 59,897 | 22 | 10,132 | 16 | -16,020 | 86 | 5,888 | 44 |
| Natural Gas | 1,098,101 | 0 | -131,424 | 39 | 99,903 | 62 | 31,521 | 59 |
| Brent | 214,404 | 51 | -26,325 | 73 | 22,279 | 27 | 4,046 | 64 |
| Heating Oil | 349,618 | 31 | 6,455 | 52 | -32,434 | 37 | 25,979 | 88 |
| Soybeans | 856,917 | 58 | 216,732 | 84 | -186,438 | 22 | -30,294 | 20 |
| Corn | 1,607,591 | 39 | 414,492 | 83 | -374,969 | 19 | -39,523 | 20 |
| Coffee | 254,992 | 25 | 70,425 | 100 | -75,230 | 1 | 4,805 | 22 |
| Sugar | 871,213 | 11 | 74,563 | 52 | -90,388 | 51 | 15,825 | 27 |
| Wheat | 402,232 | 35 | -5,846 | 42 | 10,013 | 51 | -4,167 | 82 |
CORN Futures:
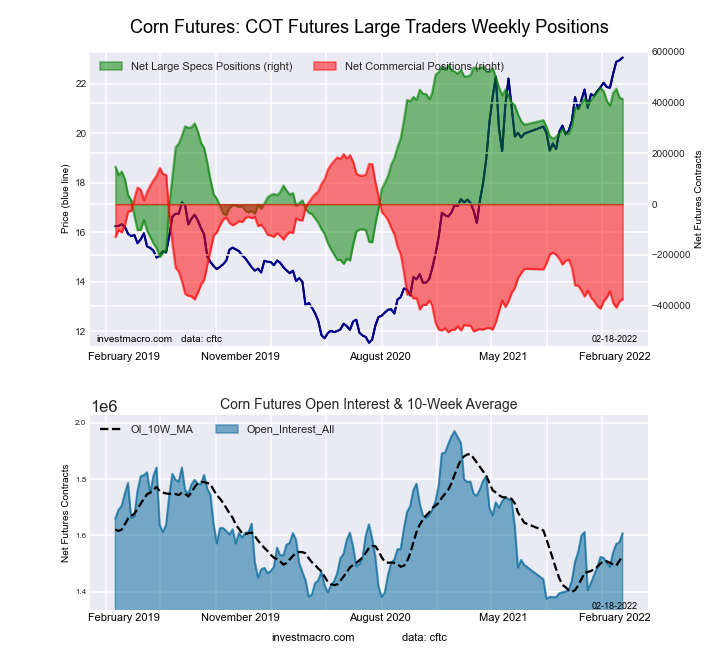 The CORN large speculator standing this week totaled a net position of 414,492 contracts in the data reported through Tuesday. This was a weekly reduction of -5,110 contracts from the previous week which had a total of 419,602 net contracts.
This week’s current strength score (the trader positioning range over the past three years, measured from 0 to 100) shows the speculators are currently Bullish-Extreme with a score of 83.0 percent. The commercials are Bearish-Extreme with a score of 18.5 percent and the small traders (not shown in chart) are Bearish with a score of 20.3 percent.
| CORN Futures Statistics | SPECULATORS | COMMERCIALS | SMALL TRADERS |
| – Percent of Open Interest Longs: | 31.8 | 45.0 | 9.1 |
| – Percent of Open Interest Shorts: | 6.0 | 68.3 | 11.6 |
| – Net Position: | 414,492 | -374,969 | -39,523 |
| – Gross Longs: | 510,734 | 723,086 | 146,972 |
| – Gross Shorts: | 96,242 | 1,098,055 | 186,495 |
| – Long to Short Ratio: | 5.3 to 1 | 0.7 to 1 | 0.8 to 1 |
| NET POSITION TREND: | |||
| – Strength Index Score (3 Year Range Pct): | 83.0 | 18.5 | 20.3 |
| – Strength Index Reading (3 Year Range): | Bullish-Extreme | Bearish-Extreme | Bearish |
| NET POSITION MOVEMENT INDEX: | |||
| – 6-Week Change in Strength Index: | -4.0 | 1.1 | 13.3 |
SUGAR Futures:
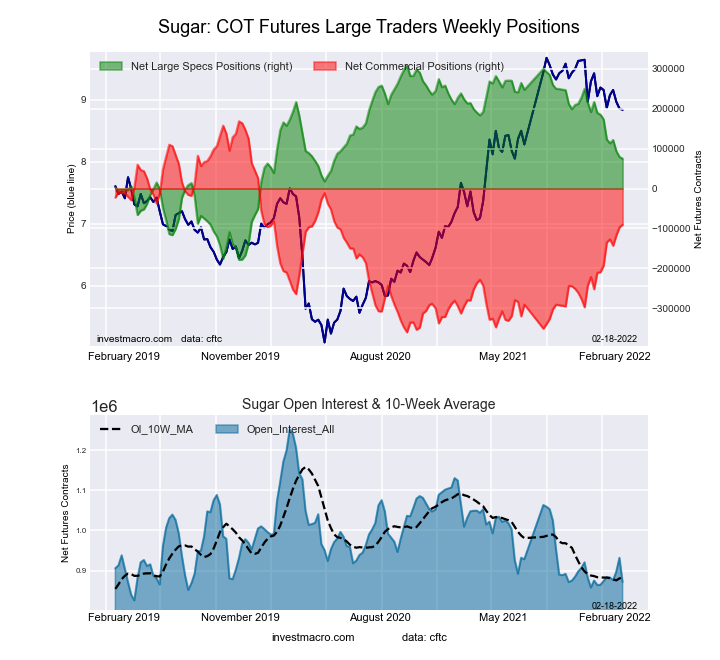 The SUGAR large speculator standing this week totaled a net position of 74,563 contracts in the data reported through Tuesday. This was a weekly decrease of -4,527 contracts from the previous week which had a total of 79,090 net contracts.
This week’s current strength score (the trader positioning range over the past three years, measured from 0 to 100) shows the speculators are currently Bullish with a score of 51.9 percent. The commercials are Bullish with a score of 51.0 percent and the small traders (not shown in chart) are Bearish with a score of 27.4 percent.
| SUGAR Futures Statistics | SPECULATORS | COMMERCIALS | SMALL TRADERS |
| – Percent of Open Interest Longs: | 21.0 | 56.2 | 9.0 |
| – Percent of Open Interest Shorts: | 12.4 | 66.6 | 7.2 |
| – Net Position: | 74,563 | -90,388 | 15,825 |
| – Gross Longs: | 182,861 | 489,754 | 78,130 |
| – Gross Shorts: | 108,298 | 580,142 | 62,305 |
| – Long to Short Ratio: | 1.7 to 1 | 0.8 to 1 | 1.3 to 1 |
| NET POSITION TREND: | |||
| – Strength Index Score (3 Year Range Pct): | 51.9 | 51.0 | 27.4 |
| – Strength Index Reading (3 Year Range): | Bullish | Bullish | Bearish |
| NET POSITION MOVEMENT INDEX: | |||
| – 6-Week Change in Strength Index: | -20.2 | 19.4 | -4.9 |
COFFEE Futures:
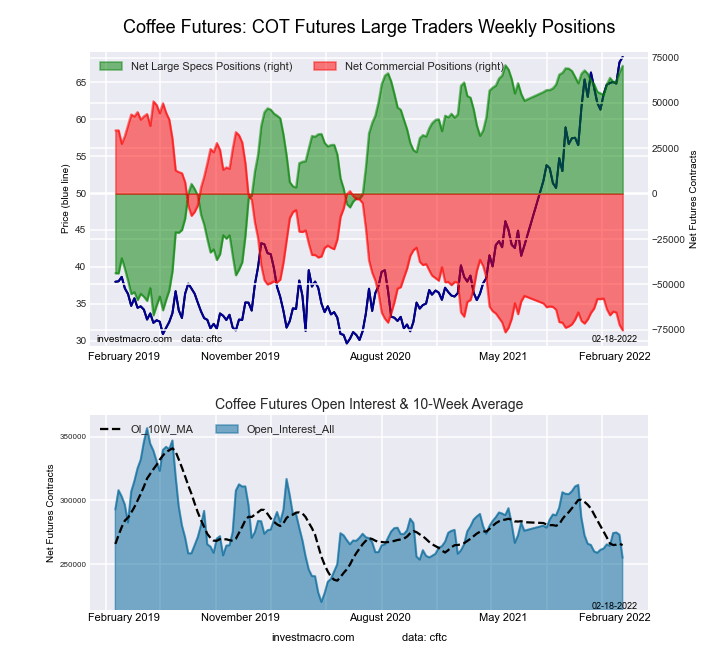 The COFFEE large speculator standing this week totaled a net position of 70,425 contracts in the data reported through Tuesday. This was a weekly advance of 3,558 contracts from the previous week which had a total of 66,867 net contracts.
This week’s current strength score (the trader positioning range over the past three years, measured from 0 to 100) shows the speculators are currently Bullish-Extreme with a score of 99.7 percent. The commercials are Bearish-Extreme with a score of 0.9 percent and the small traders (not shown in chart) are Bearish with a score of 21.6 percent.
| COFFEE Futures Statistics | SPECULATORS | COMMERCIALS | SMALL TRADERS |
| – Percent of Open Interest Longs: | 31.4 | 41.5 | 4.5 |
| – Percent of Open Interest Shorts: | 3.7 | 71.0 | 2.7 |
| – Net Position: | 70,425 | -75,230 | 4,805 |
| – Gross Longs: | 79,961 | 105,790 | 11,577 |
| – Gross Shorts: | 9,536 | 181,020 | 6,772 |
| – Long to Short Ratio: | 8.4 to 1 | 0.6 to 1 | 1.7 to 1 |
| NET POSITION TREND: | |||
| – Strength Index Score (3 Year Range Pct): | 99.7 | 0.9 | 21.6 |
| – Strength Index Reading (3 Year Range): | Bullish-Extreme | Bearish-Extreme | Bearish |
| NET POSITION MOVEMENT INDEX: | |||
| – 6-Week Change in Strength Index: | 11.5 | -13.7 | 11.2 |
SOYBEANS Futures:
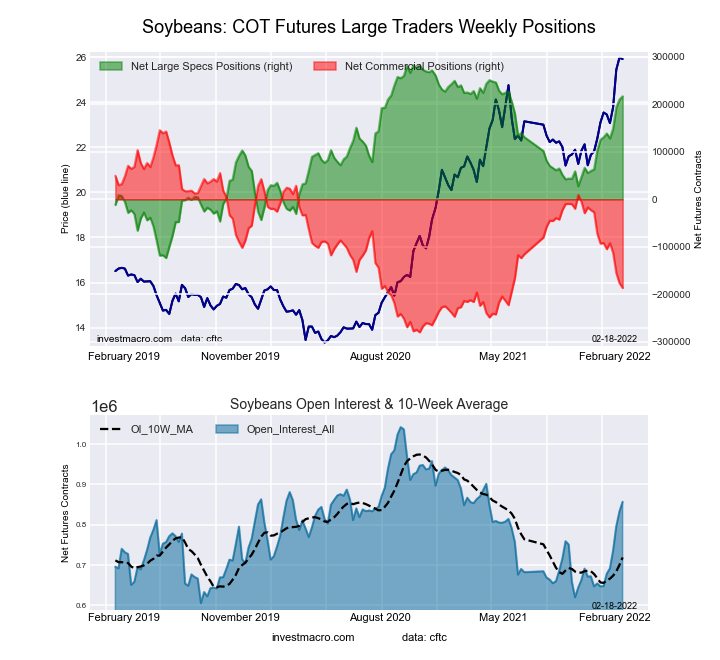 The SOYBEANS large speculator standing this week totaled a net position of 216,732 contracts in the data reported through Tuesday. This was a weekly gain of 7,002 contracts from the previous week which had a total of 209,730 net contracts.
This week’s current strength score (the trader positioning range over the past three years, measured from 0 to 100) shows the speculators are currently Bullish-Extreme with a score of 83.9 percent. The commercials are Bearish with a score of 22.0 percent and the small traders (not shown in chart) are Bearish-Extreme with a score of 19.8 percent.
| SOYBEANS Futures Statistics | SPECULATORS | COMMERCIALS | SMALL TRADERS |
| – Percent of Open Interest Longs: | 30.5 | 43.8 | 6.6 |
| – Percent of Open Interest Shorts: | 5.2 | 65.6 | 10.2 |
| – Net Position: | 216,732 | -186,438 | -30,294 |
| – Gross Longs: | 261,666 | 375,676 | 56,797 |
| – Gross Shorts: | 44,934 | 562,114 | 87,091 |
| – Long to Short Ratio: | 5.8 to 1 | 0.7 to 1 | 0.7 to 1 |
| NET POSITION TREND: | |||
| – Strength Index Score (3 Year Range Pct): | 83.9 | 22.0 | 19.8 |
| – Strength Index Reading (3 Year Range): | Bullish-Extreme | Bearish | Bearish-Extreme |
| NET POSITION MOVEMENT INDEX: | |||
| – 6-Week Change in Strength Index: | 21.3 | -22.2 | 14.2 |
SOYBEAN OIL Futures:
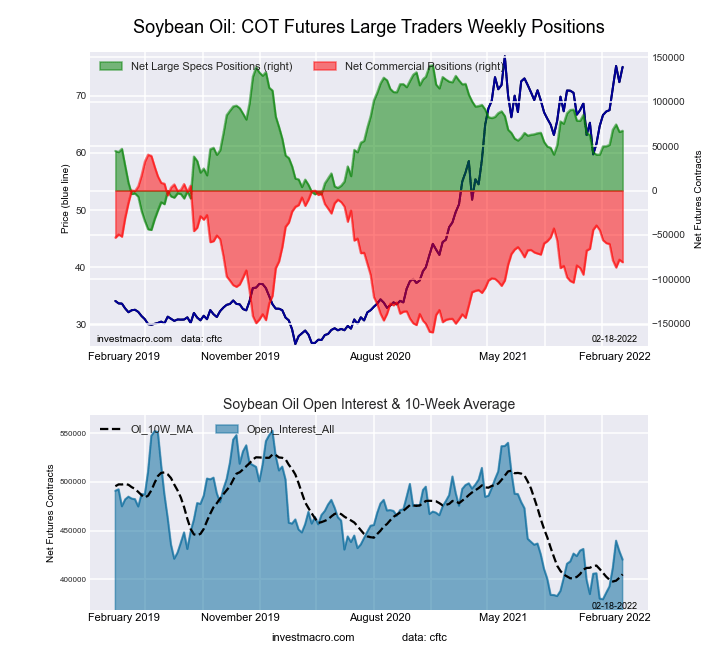 The SOYBEAN OIL large speculator standing this week totaled a net position of 67,320 contracts in the data reported through Tuesday. This was a weekly advance of 1,285 contracts from the previous week which had a total of 66,035 net contracts.
This week’s current strength score (the trader positioning range over the past three years, measured from 0 to 100) shows the speculators are currently Bullish with a score of 60.2 percent. The commercials are Bearish with a score of 39.5 percent and the small traders (not shown in chart) are Bullish with a score of 63.2 percent.
| SOYBEAN OIL Futures Statistics | SPECULATORS | COMMERCIALS | SMALL TRADERS |
| – Percent of Open Interest Longs: | 24.4 | 46.8 | 9.5 |
| – Percent of Open Interest Shorts: | 8.3 | 66.0 | 6.4 |
| – Net Position: | 67,320 | -80,652 | 13,332 |
| – Gross Longs: | 102,372 | 196,884 | 40,131 |
| – Gross Shorts: | 35,052 | 277,536 | 26,799 |
| – Long to Short Ratio: | 2.9 to 1 | 0.7 to 1 | 1.5 to 1 |
| NET POSITION TREND: | |||
| – Strength Index Score (3 Year Range Pct): | 60.2 | 39.5 | 63.2 |
| – Strength Index Reading (3 Year Range): | Bullish | Bearish | Bullish |
| NET POSITION MOVEMENT INDEX: | |||
| – 6-Week Change in Strength Index: | 9.5 | -12.4 | 26.9 |
SOYBEAN MEAL Futures:
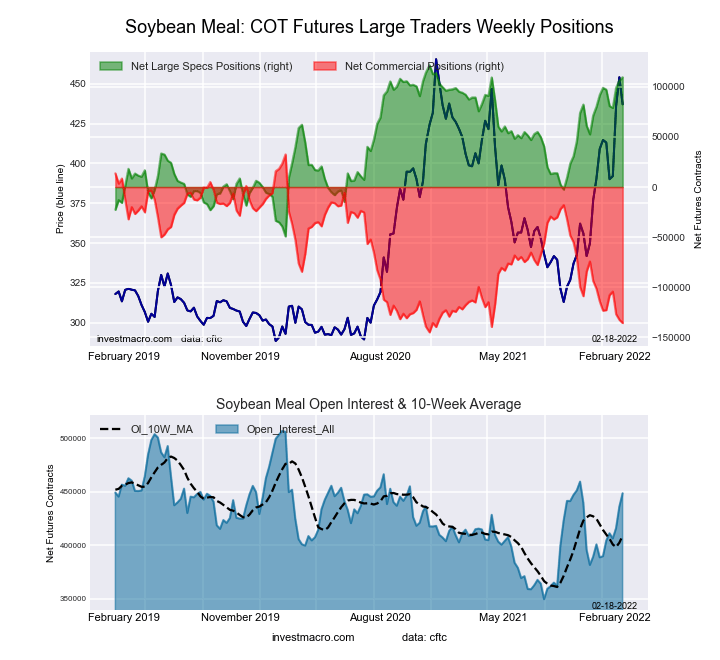 The SOYBEAN MEAL large speculator standing this week totaled a net position of 109,544 contracts in the data reported through Tuesday. This was a weekly gain of 3,284 contracts from the previous week which had a total of 106,260 net contracts.
This week’s current strength score (the trader positioning range over the past three years, measured from 0 to 100) shows the speculators are currently Bullish-Extreme with a score of 92.9 percent. The commercials are Bearish-Extreme with a score of 5.2 percent and the small traders (not shown in chart) are Bullish with a score of 75.7 percent.
| SOYBEAN MEAL Futures Statistics | SPECULATORS | COMMERCIALS | SMALL TRADERS |
| – Percent of Open Interest Longs: | 29.4 | 43.8 | 11.4 |
| – Percent of Open Interest Shorts: | 5.0 | 74.1 | 5.6 |
| – Net Position: | 109,544 | -135,761 | 26,217 |
| – Gross Longs: | 131,883 | 196,526 | 51,263 |
| – Gross Shorts: | 22,339 | 332,287 | 25,046 |
| – Long to Short Ratio: | 5.9 to 1 | 0.6 to 1 | 2.0 to 1 |
| NET POSITION TREND: | |||
| – Strength Index Score (3 Year Range Pct): | 92.9 | 5.2 | 75.7 |
| – Strength Index Reading (3 Year Range): | Bullish-Extreme | Bearish-Extreme | Bullish |
| NET POSITION MOVEMENT INDEX: | |||
| – 6-Week Change in Strength Index: | 6.2 | -7.0 | 7.4 |
LIVE CATTLE Futures:
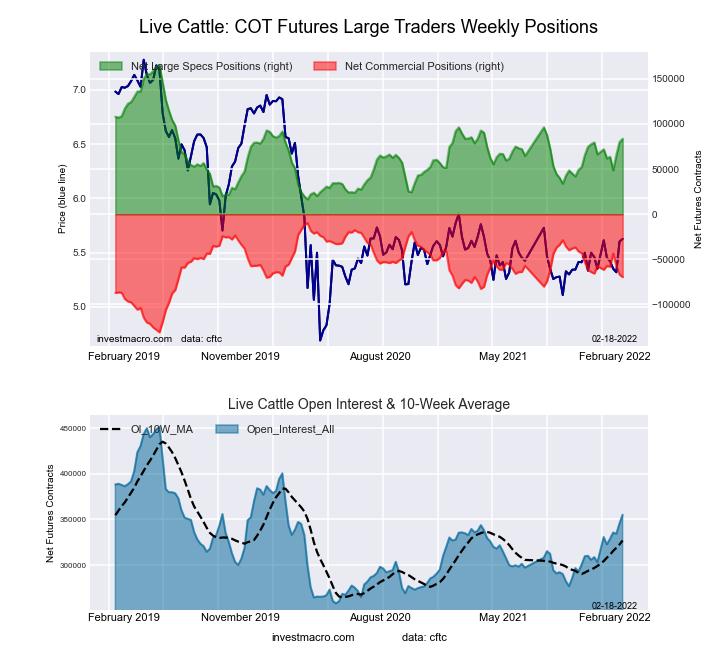 The LIVE CATTLE large speculator standing this week totaled a net position of 83,567 contracts in the data reported through Tuesday. This was a weekly lift of 3,758 contracts from the previous week which had a total of 79,809 net contracts.
This week’s current strength score (the trader positioning range over the past three years, measured from 0 to 100) shows the speculators are currently Bearish with a score of 45.1 percent. The commercials are Bullish with a score of 50.5 percent and the small traders (not shown in chart) are Bullish with a score of 53.2 percent.
| LIVE CATTLE Futures Statistics | SPECULATORS | COMMERCIALS | SMALL TRADERS |
| – Percent of Open Interest Longs: | 37.3 | 36.9 | 9.2 |
| – Percent of Open Interest Shorts: | 13.8 | 56.5 | 13.2 |
| – Net Position: | 83,567 | -69,675 | -13,892 |
| – Gross Longs: | 132,481 | 130,961 | 32,844 |
| – Gross Shorts: | 48,914 | 200,636 | 46,736 |
| – Long to Short Ratio: | 2.7 to 1 | 0.7 to 1 | 0.7 to 1 |
| NET POSITION TREND: | |||
| – Strength Index Score (3 Year Range Pct): | 45.1 | 50.5 | 53.2 |
| – Strength Index Reading (3 Year Range): | Bearish | Bullish | Bullish |
| NET POSITION MOVEMENT INDEX: | |||
| – 6-Week Change in Strength Index: | 7.9 | -6.7 | -8.7 |
LEAN HOGS Futures:
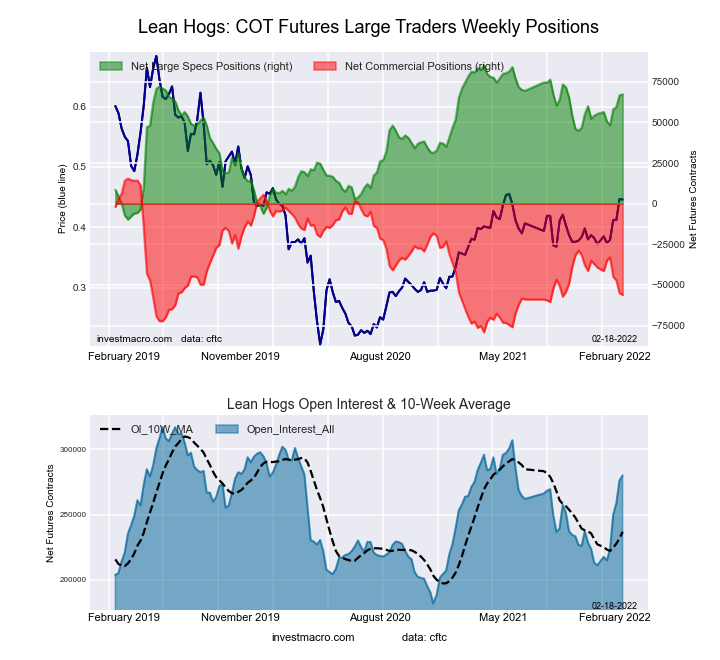 The LEAN HOGS large speculator standing this week totaled a net position of 67,332 contracts in the data reported through Tuesday. This was a weekly gain of 690 contracts from the previous week which had a total of 66,642 net contracts.
This week’s current strength score (the trader positioning range over the past three years, measured from 0 to 100) shows the speculators are currently Bullish-Extreme with a score of 80.1 percent. The commercials are Bearish with a score of 24.6 percent and the small traders (not shown in chart) are Bearish with a score of 31.8 percent.
| LEAN HOGS Futures Statistics | SPECULATORS | COMMERCIALS | SMALL TRADERS |
| – Percent of Open Interest Longs: | 40.7 | 32.3 | 8.0 |
| – Percent of Open Interest Shorts: | 16.6 | 52.3 | 12.0 |
| – Net Position: | 67,332 | -56,167 | -11,165 |
| – Gross Longs: | 113,909 | 90,422 | 22,524 |
| – Gross Shorts: | 46,577 | 146,589 | 33,689 |
| – Long to Short Ratio: | 2.4 to 1 | 0.6 to 1 | 0.7 to 1 |
| NET POSITION TREND: | |||
| – Strength Index Score (3 Year Range Pct): | 80.1 | 24.6 | 31.8 |
| – Strength Index Reading (3 Year Range): | Bullish-Extreme | Bearish | Bearish |
| NET POSITION MOVEMENT INDEX: | |||
| – 6-Week Change in Strength Index: | 11.9 | -15.8 | 16.4 |
COTTON Futures:
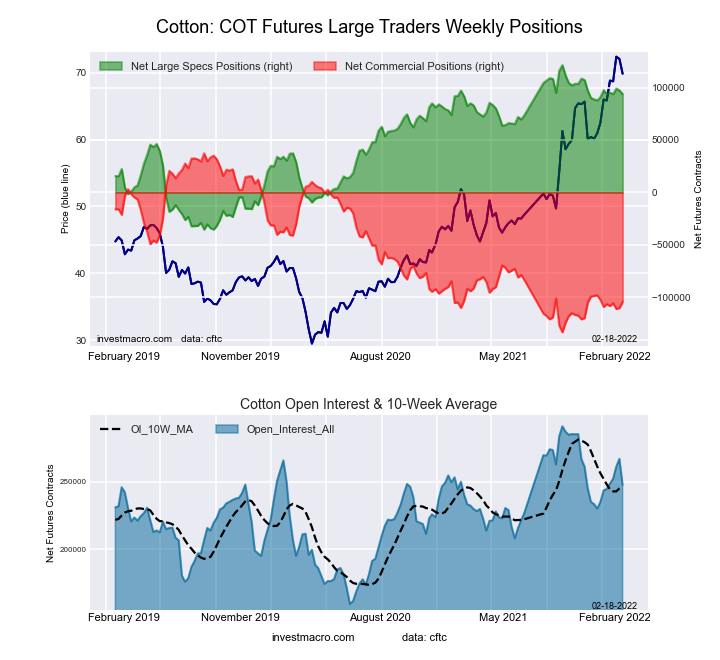 The COTTON large speculator standing this week totaled a net position of 93,723 contracts in the data reported through Tuesday. This was a weekly decline of -3,487 contracts from the previous week which had a total of 97,210 net contracts.
This week’s current strength score (the trader positioning range over the past three years, measured from 0 to 100) shows the speculators are currently Bullish-Extreme with a score of 82.4 percent. The commercials are Bearish-Extreme with a score of 17.0 percent and the small traders (not shown in chart) are Bullish with a score of 79.5 percent.
| COTTON Futures Statistics | SPECULATORS | COMMERCIALS | SMALL TRADERS |
| – Percent of Open Interest Longs: | 42.9 | 38.3 | 7.9 |
| – Percent of Open Interest Shorts: | 5.0 | 80.4 | 3.6 |
| – Net Position: | 93,723 | -104,282 | 10,559 |
| – Gross Longs: | 106,081 | 94,792 | 19,508 |
| – Gross Shorts: | 12,358 | 199,074 | 8,949 |
| – Long to Short Ratio: | 8.6 to 1 | 0.5 to 1 | 2.2 to 1 |
| NET POSITION TREND: | |||
| – Strength Index Score (3 Year Range Pct): | 82.4 | 17.0 | 79.5 |
| – Strength Index Reading (3 Year Range): | Bullish-Extreme | Bearish-Extreme | Bullish |
| NET POSITION MOVEMENT INDEX: | |||
| – 6-Week Change in Strength Index: | -2.4 | 2.8 | -6.5 |
COCOA Futures:
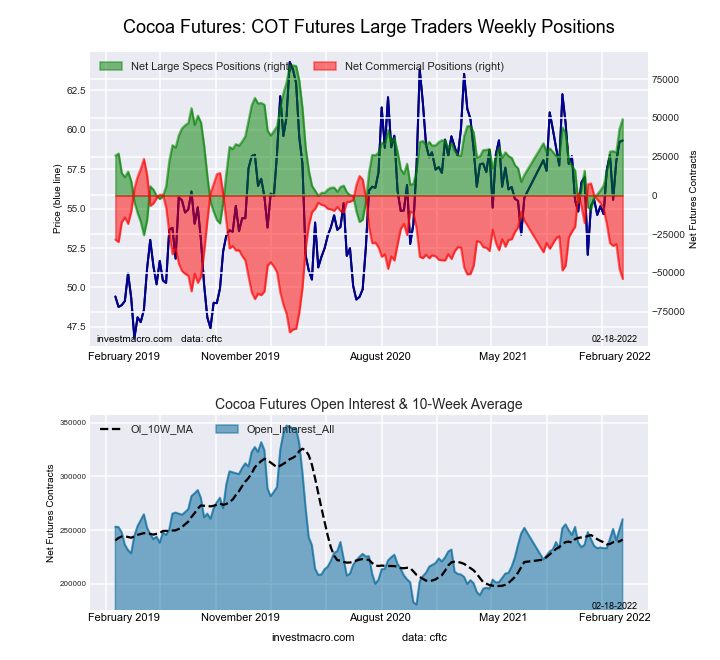 The COCOA large speculator standing this week totaled a net position of 49,216 contracts in the data reported through Tuesday. This was a weekly rise of 6,361 contracts from the previous week which had a total of 42,855 net contracts.
This week’s current strength score (the trader positioning range over the past three years, measured from 0 to 100) shows the speculators are currently Bullish with a score of 68.2 percent. The commercials are Bearish with a score of 30.8 percent and the small traders (not shown in chart) are Bullish with a score of 60.9 percent.
| COCOA Futures Statistics | SPECULATORS | COMMERCIALS | SMALL TRADERS |
| – Percent of Open Interest Longs: | 33.1 | 41.7 | 5.0 |
| – Percent of Open Interest Shorts: | 14.2 | 62.4 | 3.2 |
| – Net Position: | 49,216 | -53,823 | 4,607 |
| – Gross Longs: | 86,191 | 108,555 | 12,975 |
| – Gross Shorts: | 36,975 | 162,378 | 8,368 |
| – Long to Short Ratio: | 2.3 to 1 | 0.7 to 1 | 1.6 to 1 |
| NET POSITION TREND: | |||
| – Strength Index Score (3 Year Range Pct): | 68.2 | 30.8 | 60.9 |
| – Strength Index Reading (3 Year Range): | Bullish | Bearish | Bullish |
| NET POSITION MOVEMENT INDEX: | |||
| – 6-Week Change in Strength Index: | 39.0 | -40.4 | 28.2 |
WHEAT Futures:
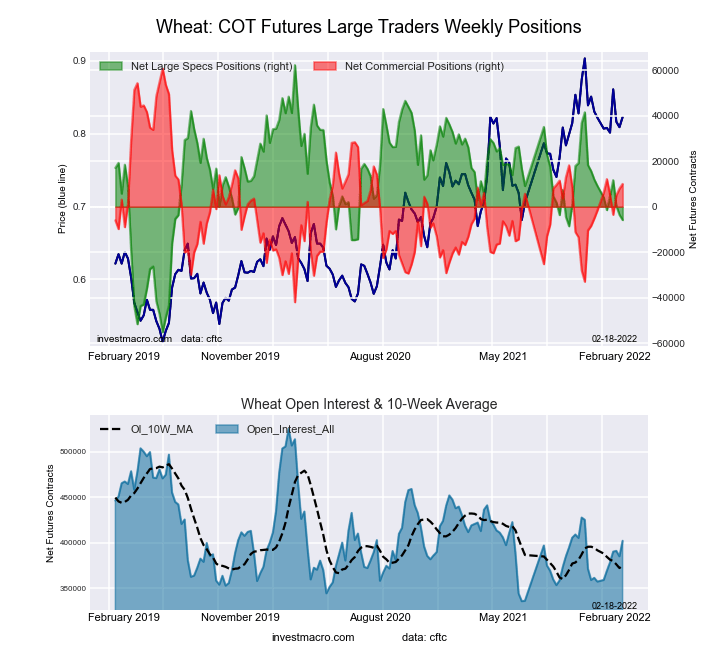 The WHEAT large speculator standing this week totaled a net position of -5,846 contracts in the data reported through Tuesday. This was a weekly fall of -2,268 contracts from the previous week which had a total of -3,578 net contracts.
This week’s current strength score (the trader positioning range over the past three years, measured from 0 to 100) shows the speculators are currently Bearish with a score of 42.0 percent. The commercials are Bullish with a score of 50.6 percent and the small traders (not shown in chart) are Bullish-Extreme with a score of 81.7 percent.
| WHEAT Futures Statistics | SPECULATORS | COMMERCIALS | SMALL TRADERS |
| – Percent of Open Interest Longs: | 26.5 | 39.0 | 8.6 |
| – Percent of Open Interest Shorts: | 28.0 | 36.5 | 9.6 |
| – Net Position: | -5,846 | 10,013 | -4,167 |
| – Gross Longs: | 106,622 | 156,858 | 34,592 |
| – Gross Shorts: | 112,468 | 146,845 | 38,759 |
| – Long to Short Ratio: | 0.9 to 1 | 1.1 to 1 | 0.9 to 1 |
| NET POSITION TREND: | |||
| – Strength Index Score (3 Year Range Pct): | 42.0 | 50.6 | 81.7 |
| – Strength Index Reading (3 Year Range): | Bearish | Bullish | Bullish-Extreme |
| NET POSITION MOVEMENT INDEX: | |||
| – 6-Week Change in Strength Index: | -8.5 | 3.7 | 29.4 |
Article By InvestMacro – Receive our weekly COT Reports by Email
*COT Report: The COT data, released weekly to the public each Friday, is updated through the most recent Tuesday (data is 3 days old) and shows a quick view of how large speculators or non-commercials (for-profit traders) were positioned in the futures markets.
The CFTC categorizes trader positions according to commercial hedgers (traders who use futures contracts for hedging as part of the business), non-commercials (large traders who speculate to realize trading profits) and nonreportable traders (usually small traders/speculators) as well as their open interest (contracts open in the market at time of reporting).See CFTC criteria here.

- The US introduces new import tariffs for 60 countries. Brent crude surpasses $100 per barrel Jul 24, 2026
- USD/JPY Breaks Records: Nothing Slows the Yen’s Decline Jul 24, 2026
- Oil prices reached a 6‑week high. The AUD strengthened on the back of a strong labor‑market report Jul 23, 2026
- EUR/USD Recovers as Dollar Weakens Jul 23, 2026
- Bitcoin rose to $66,000. The New Zealand dollar continues to strengthen Jul 22, 2026
- Inflationary pressure is easing in Canada. In New Zealand, on the contrary, inflation is rising Jul 21, 2026
- GBP/USD Falls After Cabinet Changes Jul 21, 2026
- Geopolitical and macroeconomic conditions continue to pressure market sentiment Jul 20, 2026
- USD/JPY Poised to Continue Gains as Expensive Oil and Lack of Support Weigh on Yen Jul 20, 2026
- COT Metals Charts: Weekly Speculator Bets led by Copper & Steel Jul 18, 2026