
By InvestMacro | COT | Data Tables | COT Leaders | Downloads | COT Newsletter
Here are the latest charts and statistics for the Commitment of Traders (COT) data published by the Commodities Futures Trading Commission (CFTC).
The latest COT data is updated through Tuesday February 15th and shows a quick view of how large traders (for-profit speculators and commercial entities) were positioned in the futures markets.
Highlighting the COT energy data is the large decline in this week’s Natural Gas futures bets. The speculative net position in the Natural Gas futures dropped this week by -16,335 contracts which marks the largest one-week amount since September. Speculators had been reducing their bearish bets in previous weeks with decreases in bearish bets in five out of the previous six weeks before this week’s rise in bearish bets. Overall, the Natural Gas speculator positions are now at the most bearish standing of the past six weeks.
Joining Natural Gas (-16,335 contracts) in falling this week were Brent Crude Oil (-2 contracts), WTI Crude Oil (-15,290 contracts), Heating Oil (-9,228 contracts), Gasoline (-156 contracts) and the Bloomberg Commodity Index (-4,573 contracts).
| Feb-15-2022 | OI | OI-Index | Spec-Net | Spec-Index | Com-Net | COM-Index | Smalls-Net | Smalls-Index |
|---|---|---|---|---|---|---|---|---|
| WTI Crude | 2,122,758 | 39 | 348,093 | 8 | -392,000 | 80 | 43,907 | 77 |
| Gold | 558,645 | 35 | 213,613 | 56 | -238,875 | 45 | 25,262 | 36 |
| Silver | 156,968 | 23 | 23,556 | 46 | -36,348 | 63 | 12,792 | 17 |
| Copper | 210,089 | 34 | 30,692 | 64 | -39,421 | 32 | 8,729 | 76 |
| Palladium | 8,358 | 9 | -1,000 | 15 | 903 | 83 | 97 | 50 |
| Platinum | 59,897 | 22 | 10,132 | 16 | -16,020 | 86 | 5,888 | 44 |
| Natural Gas | 1,098,101 | 0 | -131,424 | 39 | 99,903 | 62 | 31,521 | 59 |
| Brent | 214,404 | 51 | -26,325 | 73 | 22,279 | 27 | 4,046 | 64 |
| Heating Oil | 349,618 | 31 | 6,455 | 52 | -32,434 | 37 | 25,979 | 88 |
| Soybeans | 856,917 | 58 | 216,732 | 84 | -186,438 | 22 | -30,294 | 20 |
| Corn | 1,607,591 | 39 | 414,492 | 83 | -374,969 | 19 | -39,523 | 20 |
| Coffee | 254,992 | 25 | 70,425 | 100 | -75,230 | 1 | 4,805 | 22 |
| Sugar | 871,213 | 11 | 74,563 | 52 | -90,388 | 51 | 15,825 | 27 |
| Wheat | 402,232 | 35 | -5,846 | 42 | 10,013 | 51 | -4,167 | 82 |
Free Reports:
 Get our Weekly Commitment of Traders Reports - See where the biggest traders (Hedge Funds and Commercial Hedgers) are positioned in the futures markets on a weekly basis.
 Download Our Metatrader 4 Indicators – Put Our Free MetaTrader 4 Custom Indicators on your charts when you join our Weekly Newsletter
WTI Crude Oil Futures:
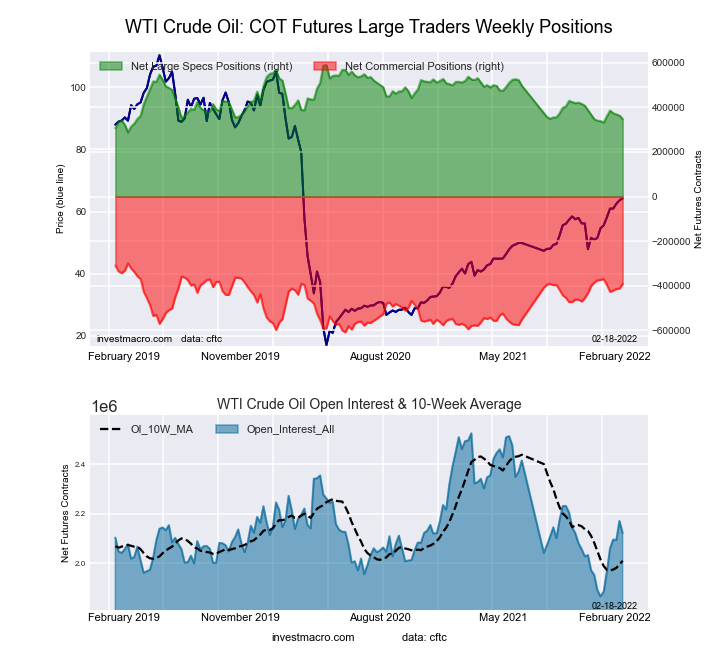 The WTI Crude Oil Futures large speculator standing this week recorded a net position of 348,093 contracts in the data reported through Tuesday. This was a weekly decline of -15,290 contracts from the previous week which had a total of 363,383 net contracts.
This week’s current strength score (the trader positioning range over the past three years, measured from 0 to 100) shows the speculators are currently Bearish-Extreme with a score of 7.8 percent. The commercials are Bullish with a score of 79.9 percent and the small traders (not shown in chart) are Bullish with a score of 76.9 percent.
| WTI Crude Oil Futures Statistics | SPECULATORS | COMMERCIALS | SMALL TRADERS |
| – Percent of Open Interest Longs: | 21.6 | 36.1 | 4.8 |
| – Percent of Open Interest Shorts: | 5.2 | 54.6 | 2.8 |
| – Net Position: | 348,093 | -392,000 | 43,907 |
| – Gross Longs: | 458,819 | 767,338 | 102,736 |
| – Gross Shorts: | 110,726 | 1,159,338 | 58,829 |
| – Long to Short Ratio: | 4.1 to 1 | 0.7 to 1 | 1.7 to 1 |
| NET POSITION TREND: | |||
| – Strength Index Score (3 Year Range Pct): | 7.8 | 79.9 | 76.9 |
| – Strength Index Reading (3 Year Range): | Bearish-Extreme | Bullish | Bullish |
| NET POSITION MOVEMENT INDEX: | |||
| – 6-Week Change in Strength Index: | 5.8 | -8.1 | 9.6 |
Brent Crude Oil Futures:
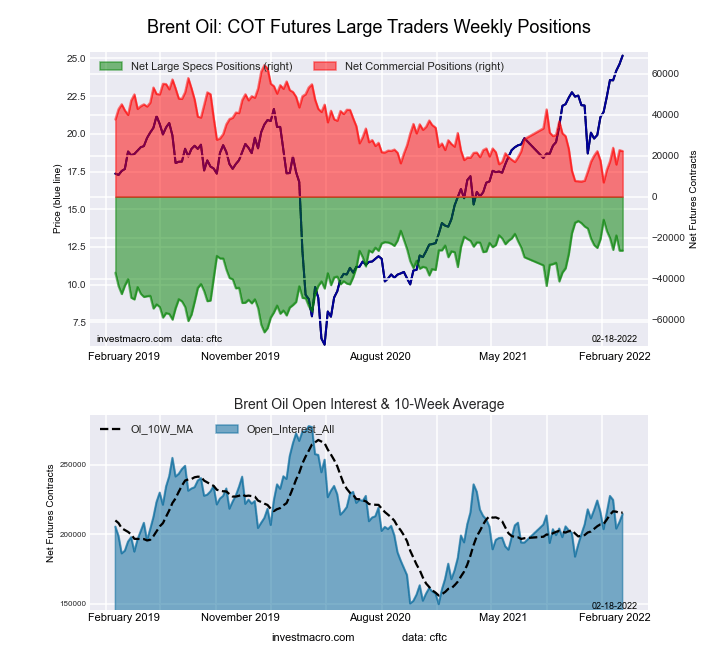 The Brent Crude Oil Futures large speculator standing this week recorded a net position of -26,325 contracts in the data reported through Tuesday. This was a weekly reduction of -2 contracts from the previous week which had a total of -26,323 net contracts.
This week’s current strength score (the trader positioning range over the past three years, measured from 0 to 100) shows the speculators are currently Bullish with a score of 72.6 percent. The commercials are Bearish with a score of 26.7 percent and the small traders (not shown in chart) are Bullish with a score of 63.9 percent.
| Brent Crude Oil Futures Statistics | SPECULATORS | COMMERCIALS | SMALL TRADERS |
| – Percent of Open Interest Longs: | 17.6 | 47.7 | 4.7 |
| – Percent of Open Interest Shorts: | 29.9 | 37.3 | 2.8 |
| – Net Position: | -26,325 | 22,279 | 4,046 |
| – Gross Longs: | 37,767 | 102,255 | 10,006 |
| – Gross Shorts: | 64,092 | 79,976 | 5,960 |
| – Long to Short Ratio: | 0.6 to 1 | 1.3 to 1 | 1.7 to 1 |
| NET POSITION TREND: | |||
| – Strength Index Score (3 Year Range Pct): | 72.6 | 26.7 | 63.9 |
| – Strength Index Reading (3 Year Range): | Bullish | Bearish | Bullish |
| NET POSITION MOVEMENT INDEX: | |||
| – 6-Week Change in Strength Index: | -27.4 | 26.7 | -3.0 |
Natural Gas Futures:
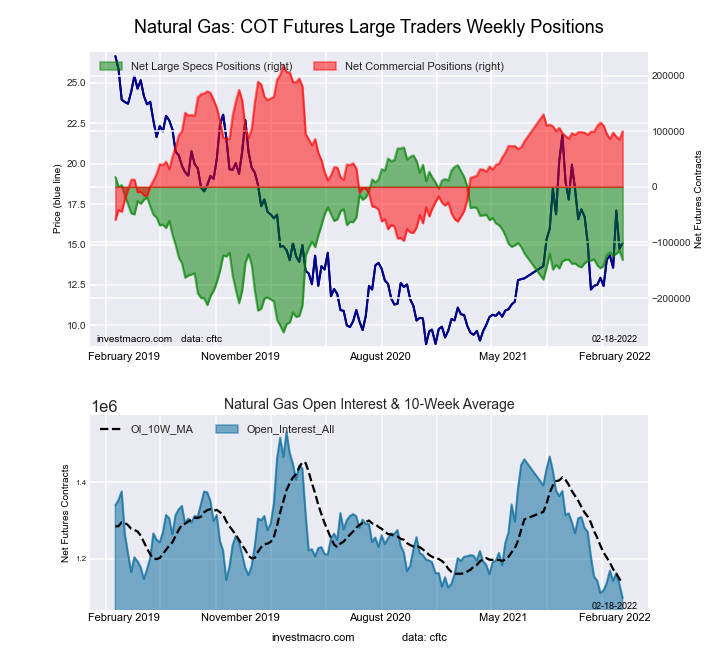 The Natural Gas Futures large speculator standing this week recorded a net position of -131,424 contracts in the data reported through Tuesday. This was a weekly fall of -16,335 contracts from the previous week which had a total of -115,089 net contracts.
This week’s current strength score (the trader positioning range over the past three years, measured from 0 to 100) shows the speculators are currently Bearish with a score of 39.1 percent. The commercials are Bullish with a score of 62.4 percent and the small traders (not shown in chart) are Bullish with a score of 58.8 percent.
| Natural Gas Futures Statistics | SPECULATORS | COMMERCIALS | SMALL TRADERS |
| – Percent of Open Interest Longs: | 21.4 | 44.4 | 5.1 |
| – Percent of Open Interest Shorts: | 33.3 | 35.3 | 2.2 |
| – Net Position: | -131,424 | 99,903 | 31,521 |
| – Gross Longs: | 234,678 | 487,701 | 55,830 |
| – Gross Shorts: | 366,102 | 387,798 | 24,309 |
| – Long to Short Ratio: | 0.6 to 1 | 1.3 to 1 | 2.3 to 1 |
| NET POSITION TREND: | |||
| – Strength Index Score (3 Year Range Pct): | 39.1 | 62.4 | 58.8 |
| – Strength Index Reading (3 Year Range): | Bearish | Bullish | Bullish |
| NET POSITION MOVEMENT INDEX: | |||
| – 6-Week Change in Strength Index: | 3.2 | -3.2 | -0.7 |
Gasoline Blendstock Futures:
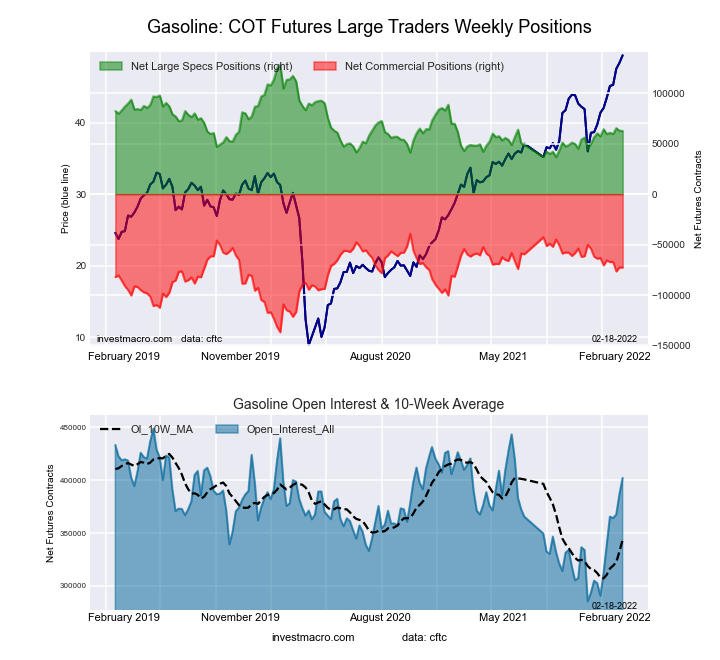 The Gasoline Blendstock Futures large speculator standing this week recorded a net position of 62,596 contracts in the data reported through Tuesday. This was a weekly fall of -156 contracts from the previous week which had a total of 62,752 net contracts.
This week’s current strength score (the trader positioning range over the past three years, measured from 0 to 100) shows the speculators are currently Bearish with a score of 33.8 percent. The commercials are Bullish with a score of 64.2 percent and the small traders (not shown in chart) are Bullish with a score of 72.2 percent.
| Nasdaq Mini Futures Statistics | SPECULATORS | COMMERCIALS | SMALL TRADERS |
| – Percent of Open Interest Longs: | 26.9 | 50.7 | 6.3 |
| – Percent of Open Interest Shorts: | 11.3 | 68.8 | 3.8 |
| – Net Position: | 62,596 | -72,742 | 10,146 |
| – Gross Longs: | 108,035 | 203,940 | 25,503 |
| – Gross Shorts: | 45,439 | 276,682 | 15,357 |
| – Long to Short Ratio: | 2.4 to 1 | 0.7 to 1 | 1.7 to 1 |
| NET POSITION TREND: | |||
| – Strength Index Score (3 Year Range Pct): | 33.8 | 64.2 | 72.2 |
| – Strength Index Reading (3 Year Range): | Bearish | Bullish | Bullish |
| NET POSITION MOVEMENT INDEX: | |||
| – 6-Week Change in Strength Index: | -1.7 | -2.3 | 24.0 |
#2 Heating Oil NY-Harbor Futures:
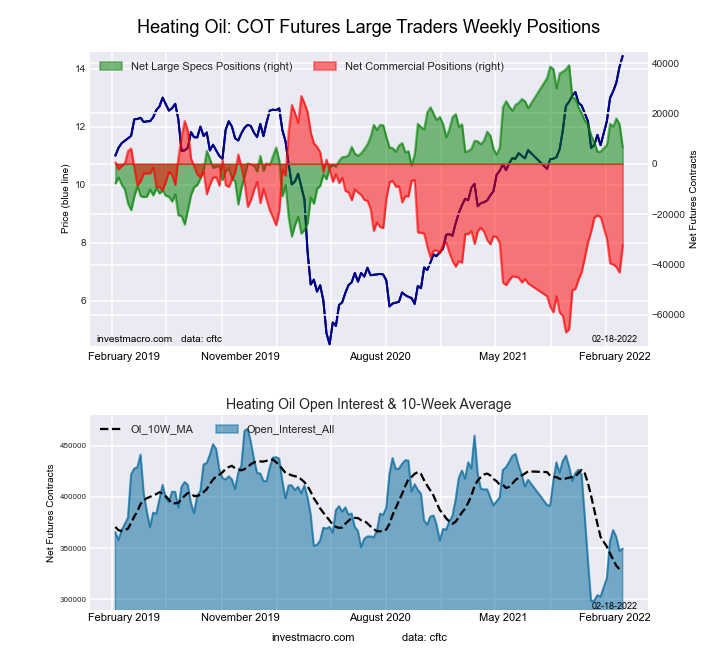 The #2 Heating Oil NY-Harbor Futures large speculator standing this week recorded a net position of 6,455 contracts in the data reported through Tuesday. This was a weekly lowering of -9,228 contracts from the previous week which had a total of 15,683 net contracts.
This week’s current strength score (the trader positioning range over the past three years, measured from 0 to 100) shows the speculators are currently Bullish with a score of 51.9 percent. The commercials are Bearish with a score of 36.7 percent and the small traders (not shown in chart) are Bullish-Extreme with a score of 88.4 percent.
| Heating Oil Futures Statistics | SPECULATORS | COMMERCIALS | SMALL TRADERS |
| – Percent of Open Interest Longs: | 17.0 | 50.8 | 14.4 |
| – Percent of Open Interest Shorts: | 15.1 | 60.1 | 6.9 |
| – Net Position: | 6,455 | -32,434 | 25,979 |
| – Gross Longs: | 59,340 | 177,626 | 50,210 |
| – Gross Shorts: | 52,885 | 210,060 | 24,231 |
| – Long to Short Ratio: | 1.1 to 1 | 0.8 to 1 | 2.1 to 1 |
| NET POSITION TREND: | |||
| – Strength Index Score (3 Year Range Pct): | 51.9 | 36.7 | 88.4 |
| – Strength Index Reading (3 Year Range): | Bullish | Bearish | Bullish-Extreme |
| NET POSITION MOVEMENT INDEX: | |||
| – 6-Week Change in Strength Index: | 4.2 | -10.3 | 23.6 |
Bloomberg Commodity Index Futures:
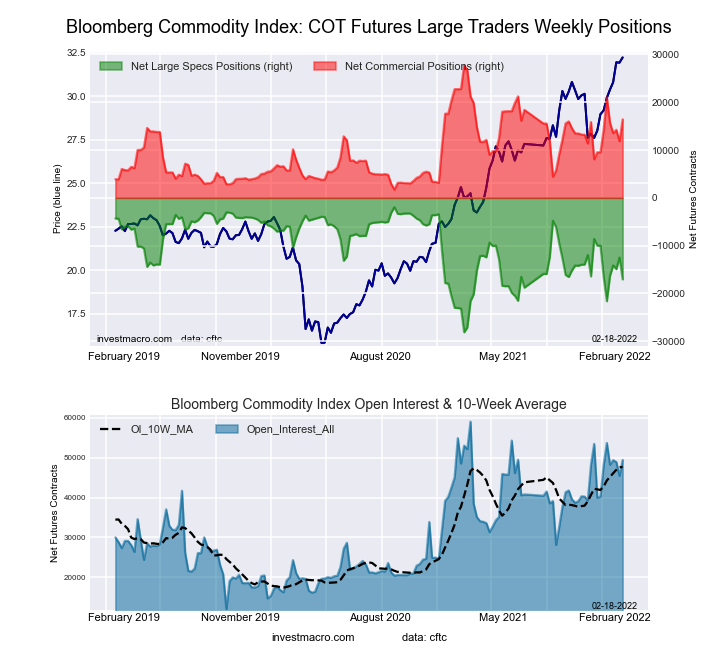 The Bloomberg Commodity Index Futures large speculator standing this week recorded a net position of -17,041 contracts in the data reported through Tuesday. This was a weekly decrease of -4,573 contracts from the previous week which had a total of -12,468 net contracts.
This week’s current strength score (the trader positioning range over the past three years, measured from 0 to 100) shows the speculators are currently Bearish with a score of 42.3 percent. The commercials are Bullish with a score of 56.5 percent and the small traders (not shown in chart) are Bearish with a score of 40.9 percent.
| Bloomberg Index Futures Statistics | SPECULATORS | COMMERCIALS | SMALL TRADERS |
| – Percent of Open Interest Longs: | 61.7 | 34.5 | 1.4 |
| – Percent of Open Interest Shorts: | 96.1 | 1.3 | 0.2 |
| – Net Position: | -17,041 | 16,437 | 604 |
| – Gross Longs: | 30,521 | 17,060 | 700 |
| – Gross Shorts: | 47,562 | 623 | 96 |
| – Long to Short Ratio: | 0.6 to 1 | 27.4 to 1 | 7.3 to 1 |
| NET POSITION TREND: | |||
| – Strength Index Score (3 Year Range Pct): | 42.3 | 56.5 | 40.9 |
| – Strength Index Reading (3 Year Range): | Bearish | Bullish | Bearish |
| NET POSITION MOVEMENT INDEX: | |||
| – 6-Week Change in Strength Index: | -2.0 | 8.4 | -59.1 |
Article By InvestMacro – Receive our weekly COT Reports by Email
*COT Report: The COT data, released weekly to the public each Friday, is updated through the most recent Tuesday (data is 3 days old) and shows a quick view of how large speculators or non-commercials (for-profit traders) were positioned in the futures markets.
The CFTC categorizes trader positions according to commercial hedgers (traders who use futures contracts for hedging as part of the business), non-commercials (large traders who speculate to realize trading profits) and nonreportable traders (usually small traders/speculators) as well as their open interest (contracts open in the market at time of reporting).See CFTC criteria here.

- The US introduces new import tariffs for 60 countries. Brent crude surpasses $100 per barrel Jul 24, 2026
- USD/JPY Breaks Records: Nothing Slows the Yen’s Decline Jul 24, 2026
- Oil prices reached a 6‑week high. The AUD strengthened on the back of a strong labor‑market report Jul 23, 2026
- EUR/USD Recovers as Dollar Weakens Jul 23, 2026
- Bitcoin rose to $66,000. The New Zealand dollar continues to strengthen Jul 22, 2026
- Inflationary pressure is easing in Canada. In New Zealand, on the contrary, inflation is rising Jul 21, 2026
- GBP/USD Falls After Cabinet Changes Jul 21, 2026
- Geopolitical and macroeconomic conditions continue to pressure market sentiment Jul 20, 2026
- USD/JPY Poised to Continue Gains as Expensive Oil and Lack of Support Weigh on Yen Jul 20, 2026
- COT Metals Charts: Weekly Speculator Bets led by Copper & Steel Jul 18, 2026