By InvestMacro | COT | Data Tables | COT Leaders | Downloads | COT Newsletter
Here are the latest charts and statistics for the Commitment of Traders (COT) data published by the Commodities Futures Trading Commission (CFTC).
The latest COT data is updated through Tuesday January 4th 2022 and shows a quick view of how large traders (for-profit speculators and commercial entities) were positioned in the futures markets.
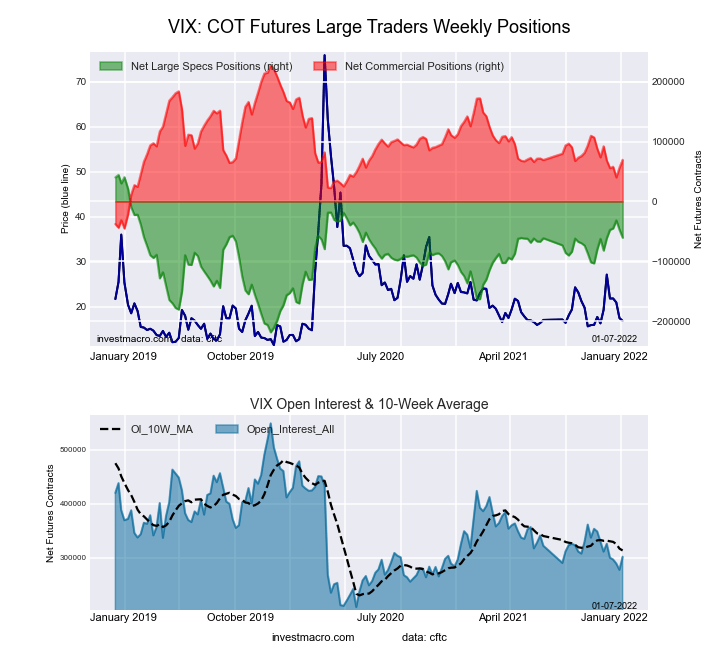
Highlighting the COT stock market data is the two-week ramp up in the VIX Volatility futures bearish bets. The speculative net position in the VIX futures saw bearish bets rise by over 13,000 contracts for a second week in a row following four weeks of declining bearish bets. Speculators have now been betting on less volatility (for S&P500) in these past two weeks and have pushed their bearish standing back up to the highest level since November 30th.
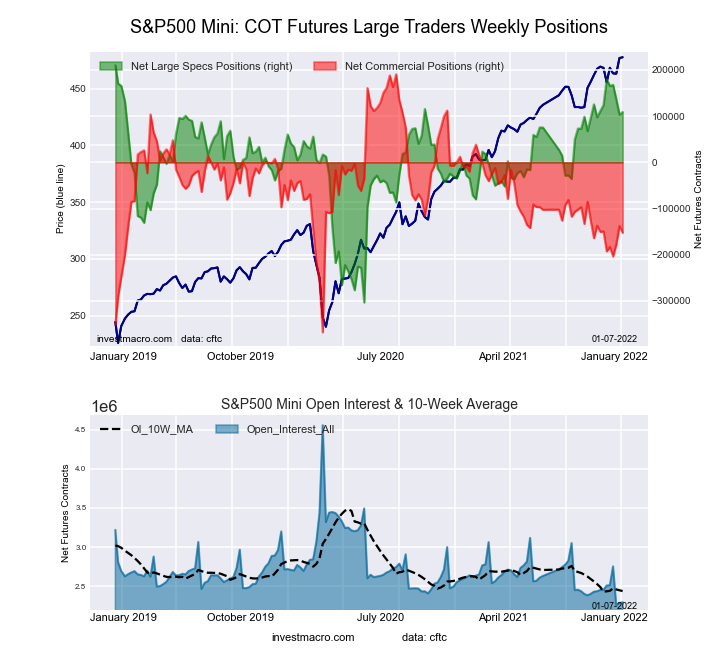
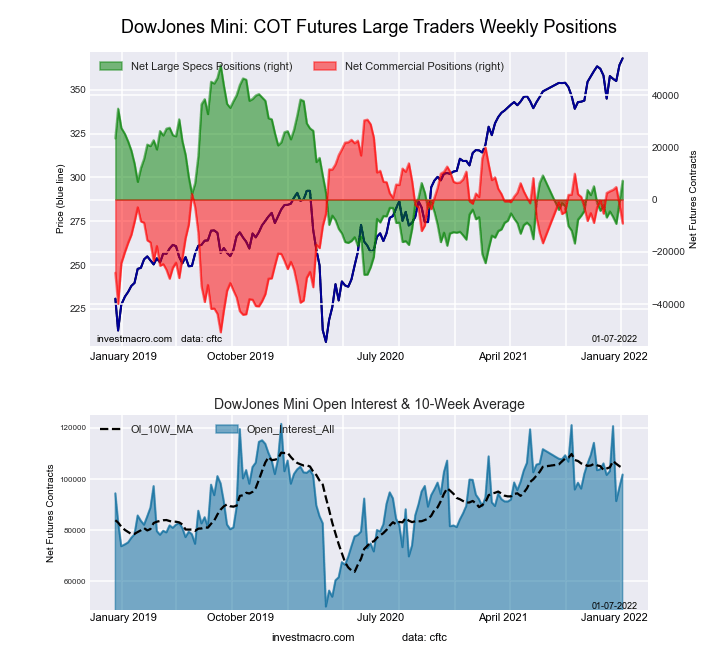
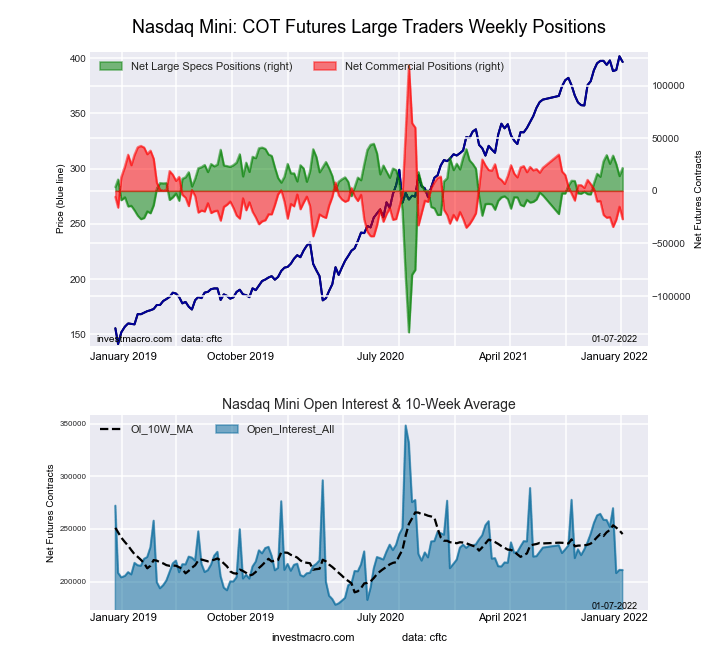
The stock markets that saw higher speculator bets this week were S&P500 Mini (5,738 contracts), Dow Jones Industrial Average Mini (8,392 contracts), Nasdaq Mini (7,621 contracts), Russell 2000 Mini (4,506 contracts), Nikkei 225 USD (263 contracts) and the MSCI EAFE Mini (18,905 contracts).
The markets with lower speculator bets this week were VIX (-13,259 contracts) and the MSCI Emerging Markets Mini (-2,219 contracts).
Free Reports:
| Jan-04-2022 | OI | OI-Index | Spec-Net | Spec-Index | Com-Net | COM-Index | Smalls-Net | Smalls-Index |
|---|---|---|---|---|---|---|---|---|
| S&P500-Mini | 2,297,290 | 2 | 109,032 | 85 | -152,356 | 39 | 43,324 | 35 |
| Nikkei 225 | 15,764 | 4 | -7,532 | 42 | 6,889 | 64 | 643 | 35 |
| Nasdaq-Mini | 210,931 | 19 | 21,725 | 87 | -26,892 | 10 | 5,167 | 56 |
| DowJones-Mini | 101,757 | 72 | 7,234 | 45 | -9,171 | 51 | 1,937 | 49 |
| VIX | 301,754 | 27 | -60,454 | 76 | 69,419 | 27 | -8,965 | 22 |
| Nikkei 225 Yen | 44,197 | 20 | 710 | 24 | 13,246 | 70 | -13,956 | 51 |
This week’s current strength score (the trader positioning range over the past three years, measured from 0 to 100) shows the speculators are currently Bullish with a score of 75.7 percent. The commercials are Bearish with a score of 26.8 percent and the small traders (not shown in chart) are Bearish with a score of 22.4 percent.
| VIX Volatility Futures Statistics | SPECULATORS | COMMERCIALS | SMALL TRADERS |
| – Percent of Open Interest Longs: | 19.3 | 51.1 | 6.5 |
| – Percent of Open Interest Shorts: | 39.3 | 28.1 | 9.4 |
| – Net Position: | -60,454 | 69,419 | -8,965 |
| – Gross Longs: | 58,107 | 154,292 | 19,512 |
| – Gross Shorts: | 118,561 | 84,873 | 28,477 |
| – Long to Short Ratio: | 0.5 to 1 | 1.8 to 1 | 0.7 to 1 |
| NET POSITION TREND: | |||
| – Strength Index Score (3 Year Range Pct): | 75.7 | 26.8 | 22.4 |
| – Strength Index Reading (3 Year Range): | Bullish | Bearish | Bearish |
| NET POSITION MOVEMENT INDEX: | |||
| – 6-Week Change in Strength Index: | 10.3 | -10.5 | 4.5 |
This week’s current strength score (the trader positioning range over the past three years, measured from 0 to 100) shows the speculators are currently Bullish-Extreme with a score of 85.4 percent. The commercials are Bearish with a score of 38.6 percent and the small traders (not shown in chart) are Bearish with a score of 35.5 percent.
| S&P500 Mini Futures Statistics | SPECULATORS | COMMERCIALS | SMALL TRADERS |
| – Percent of Open Interest Longs: | 17.7 | 68.7 | 11.7 |
| – Percent of Open Interest Shorts: | 13.0 | 75.3 | 9.8 |
| – Net Position: | 109,032 | -152,356 | 43,324 |
| – Gross Longs: | 407,706 | 1,577,841 | 268,686 |
| – Gross Shorts: | 298,674 | 1,730,197 | 225,362 |
| – Long to Short Ratio: | 1.4 to 1 | 0.9 to 1 | 1.2 to 1 |
| NET POSITION TREND: | |||
| – Strength Index Score (3 Year Range Pct): | 85.4 | 38.6 | 35.5 |
| – Strength Index Reading (3 Year Range): | Bullish-Extreme | Bearish | Bearish |
| NET POSITION MOVEMENT INDEX: | |||
| – 6-Week Change in Strength Index: | -3.1 | -0.5 | 3.7 |
This week’s current strength score (the trader positioning range over the past three years, measured from 0 to 100) shows the speculators are currently Bearish with a score of 44.9 percent. The commercials are Bullish with a score of 51.1 percent and the small traders (not shown in chart) are Bearish with a score of 48.8 percent.
| Dow Jones Mini Futures Statistics | SPECULATORS | COMMERCIALS | SMALL TRADERS |
| – Percent of Open Interest Longs: | 41.2 | 43.0 | 15.2 |
| – Percent of Open Interest Shorts: | 34.1 | 52.0 | 13.3 |
| – Net Position: | 7,234 | -9,171 | 1,937 |
| – Gross Longs: | 41,883 | 43,753 | 15,436 |
| – Gross Shorts: | 34,649 | 52,924 | 13,499 |
| – Long to Short Ratio: | 1.2 to 1 | 0.8 to 1 | 1.1 to 1 |
| NET POSITION TREND: | |||
| – Strength Index Score (3 Year Range Pct): | 44.9 | 51.1 | 48.8 |
| – Strength Index Reading (3 Year Range): | Bearish | Bullish | Bearish |
| NET POSITION MOVEMENT INDEX: | |||
| – 6-Week Change in Strength Index: | 11.7 | -4.7 | -29.8 |
This week’s current strength score (the trader positioning range over the past three years, measured from 0 to 100) shows the speculators are currently Bullish-Extreme with a score of 87.2 percent. The commercials are Bearish-Extreme with a score of 10.0 percent and the small traders (not shown in chart) are Bullish with a score of 55.6 percent.
| Nasdaq Mini Futures Statistics | SPECULATORS | COMMERCIALS | SMALL TRADERS |
| – Percent of Open Interest Longs: | 33.0 | 46.6 | 18.8 |
| – Percent of Open Interest Shorts: | 22.7 | 59.3 | 16.4 |
| – Net Position: | 21,725 | -26,892 | 5,167 |
| – Gross Longs: | 69,552 | 98,227 | 39,737 |
| – Gross Shorts: | 47,827 | 125,119 | 34,570 |
| – Long to Short Ratio: | 1.5 to 1 | 0.8 to 1 | 1.1 to 1 |
| NET POSITION TREND: | |||
| – Strength Index Score (3 Year Range Pct): | 87.2 | 10.0 | 55.6 |
| – Strength Index Reading (3 Year Range): | Bullish-Extreme | Bearish-Extreme | Bullish |
| NET POSITION MOVEMENT INDEX: | |||
| – 6-Week Change in Strength Index: | -3.5 | -2.5 | 23.3 |
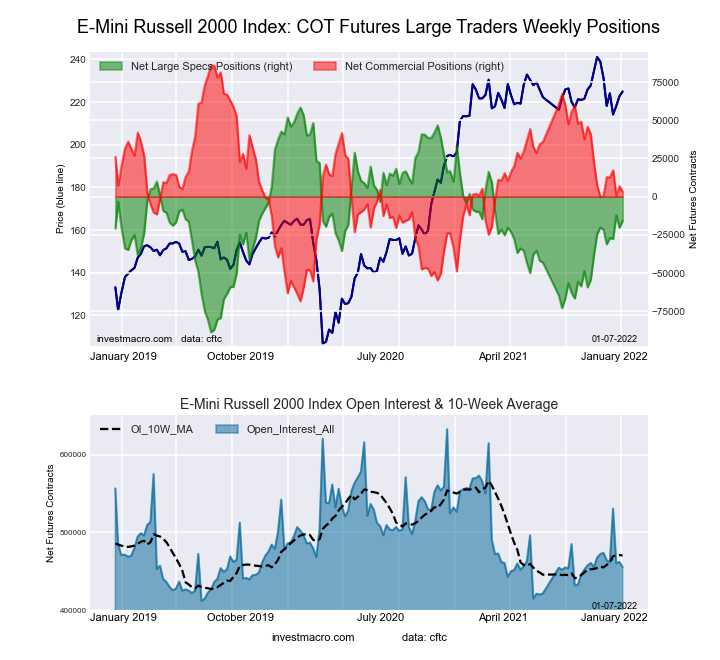
This week’s current strength score (the trader positioning range over the past three years, measured from 0 to 100) shows the speculators are currently Bearish with a score of 49.6 percent. The commercials are Bearish with a score of 46.3 percent and the small traders (not shown in chart) are Bullish with a score of 68.7 percent.
| Russell 2000 Mini Futures Statistics | SPECULATORS | COMMERCIALS | SMALL TRADERS |
| – Percent of Open Interest Longs: | 16.1 | 76.3 | 6.6 |
| – Percent of Open Interest Shorts: | 19.5 | 75.7 | 3.8 |
| – Net Position: | -15,793 | 3,155 | 12,638 |
| – Gross Longs: | 73,156 | 347,533 | 30,107 |
| – Gross Shorts: | 88,949 | 344,378 | 17,469 |
| – Long to Short Ratio: | 0.8 to 1 | 1.0 to 1 | 1.7 to 1 |
| NET POSITION TREND: | |||
| – Strength Index Score (3 Year Range Pct): | 49.6 | 46.3 | 68.7 |
| – Strength Index Reading (3 Year Range): | Bearish | Bearish | Bullish |
| NET POSITION MOVEMENT INDEX: | |||
| – 6-Week Change in Strength Index: | 3.9 | 1.7 | -23.8 |
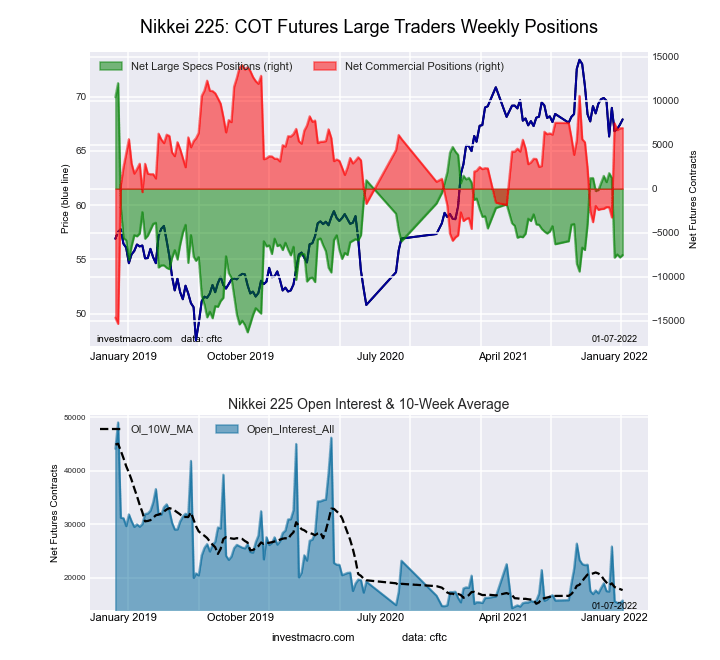
This week’s current strength score (the trader positioning range over the past three years, measured from 0 to 100) shows the speculators are currently Bearish with a score of 41.7 percent. The commercials are Bullish with a score of 64.2 percent and the small traders (not shown in chart) are Bearish with a score of 35.0 percent.
| Nikkei Stock Average Futures Statistics | SPECULATORS | COMMERCIALS | SMALL TRADERS |
| – Percent of Open Interest Longs: | 10.4 | 61.5 | 28.2 |
| – Percent of Open Interest Shorts: | 58.1 | 17.8 | 24.1 |
| – Net Position: | -7,532 | 6,889 | 643 |
| – Gross Longs: | 1,633 | 9,690 | 4,441 |
| – Gross Shorts: | 9,165 | 2,801 | 3,798 |
| – Long to Short Ratio: | 0.2 to 1 | 3.5 to 1 | 1.2 to 1 |
| NET POSITION TREND: | |||
| – Strength Index Score (3 Year Range Pct): | 41.7 | 64.2 | 35.0 |
| – Strength Index Reading (3 Year Range): | Bearish | Bullish | Bearish |
| NET POSITION MOVEMENT INDEX: | |||
| – 6-Week Change in Strength Index: | -39.4 | 45.0 | -8.8 |
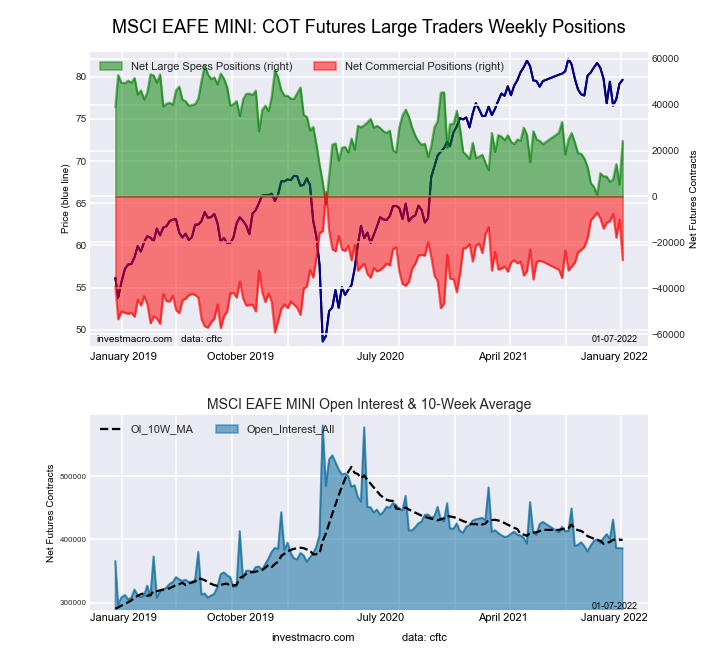
This week’s current strength score (the trader positioning range over the past three years, measured from 0 to 100) shows the speculators are currently Bearish with a score of 45.5 percent. The commercials are Bullish with a score of 51.4 percent and the small traders (not shown in chart) are Bearish with a score of 48.3 percent.
| MSCI EAFE Mini Futures Statistics | SPECULATORS | COMMERCIALS | SMALL TRADERS |
| – Percent of Open Interest Longs: | 8.3 | 88.7 | 2.7 |
| – Percent of Open Interest Shorts: | 2.0 | 95.9 | 1.7 |
| – Net Position: | 24,195 | -27,775 | 3,580 |
| – Gross Longs: | 31,913 | 342,005 | 10,299 |
| – Gross Shorts: | 7,718 | 369,780 | 6,719 |
| – Long to Short Ratio: | 4.1 to 1 | 0.9 to 1 | 1.5 to 1 |
| NET POSITION TREND: | |||
| – Strength Index Score (3 Year Range Pct): | 45.5 | 51.4 | 48.3 |
| – Strength Index Reading (3 Year Range): | Bearish | Bullish | Bearish |
| NET POSITION MOVEMENT INDEX: | |||
| – 6-Week Change in Strength Index: | 25.5 | -22.6 | -14.9 |
Article By InvestMacro – Receive our weekly COT Reports by Email
*COT Report: The COT data, released weekly to the public each Friday, is updated through the most recent Tuesday (data is 3 days old) and shows a quick view of how large speculators or non-commercials (for-profit traders) were positioned in the futures markets.
The CFTC categorizes trader positions according to commercial hedgers (traders who use futures contracts for hedging as part of the business), non-commercials (large traders who speculate to realize trading profits) and nonreportable traders (usually small traders/speculators) as well as their open interest (contracts open in the market at time of reporting).See CFTC criteria here.
By Jeffrey Young, Georgia Institute of Technology You’ve probably heard artificial intelligence models described as…
Source: Barry Dawes (7/23/26) Barry Dawes of Martin Place Securities shares his analysis of the…
By JustMarkets The US stock indices ended Thursday’s session with a notable decline amid a…
By Analytical Department RoboForex USD/JPY soared to 163.81 on Friday, marking a new 40-year high.…
By JustMarkets The US equities ended Wednesday’s session lower amid investor caution ahead of the…
By Analytical Department RoboForex EUR/USD rose to 1.1429 on Thursday, with the US dollar continuing…
This website uses cookies.