
By InvestMacro | COT | Data Tables | COT Leaders | Downloads | COT Newsletter
Here are the latest charts and statistics for the Commitment of Traders (COT) data published by the Commodities Futures Trading Commission (CFTC).
The latest COT data is updated through Tuesday December 14th 2021 and shows a quick view of how large traders (for-profit speculators and commercial entities) were positioned in the futures markets.
Highlighting the COT soft commodities data is the rebound in Sugar futures bets this week. The speculator net positioning in the Sugar futures rose by +25,224 net contracts this week following two straight weekly declines. The boost in Sugar bets has now brought the weekly speculator changes higher in five out of the past seven weeks and pushed back the speculator position into a extreme-bullish reading of 81 percent in the strength index (current speculator standing compared to past three years, above 80 is bullish extreme, below 20 is bearish extreme).
Despite the recent uptrend in speculator bets and the Sugar price, open interest has been waning in the Sugar market (as well as many other soft commodities markets) indicating that this may be a weakening trend.
The soft commodities that saw higher bets this week were Corn (15,807 contracts), Sugar (25,224 contracts), Soybeans (3,567 contracts), Soybean Meal (18,786 contracts), Live Cattle (1,991 contracts), Lean Hogs (1,905 contracts) and Cocoa (7,994 contracts). The commodities that fell in speculator bets this week were Coffee (-2,036 contracts), Soybean Oil (-19,292 contracts), Cotton (-1,326 contracts) and Wheat (-3,702 contracts).
Free Reports:
 Get our Weekly Commitment of Traders Reports - See where the biggest traders (Hedge Funds and Commercial Hedgers) are positioned in the futures markets on a weekly basis.
 Download Our Metatrader 4 Indicators – Put Our Free MetaTrader 4 Custom Indicators on your charts when you join our Weekly Newsletter
| Dec-14-2021 | OI | OI-Index | Spec-Net | Spec-Index | Com-Net | COM-Index | Smalls-Net | Smalls-Index |
|---|---|---|---|---|---|---|---|---|
| WTI Crude | 1,953,397 | 0 | 347,137 | 22 | -385,527 | 67 | 38,390 | 69 |
| Gold | 503,709 | 20 | 202,401 | 52 | -231,411 | 47 | 29,010 | 47 |
| Silver | 142,384 | 9 | 21,984 | 44 | -35,855 | 64 | 13,871 | 21 |
| Copper | 171,976 | 6 | 6,697 | 47 | -13,108 | 50 | 6,411 | 62 |
| Palladium | 10,098 | 16 | -3,774 | 0 | 4,125 | 100 | -351 | 24 |
| Platinum | 66,300 | 32 | 3,731 | 8 | -9,661 | 95 | 5,930 | 45 |
| Natural Gas | 1,153,450 | 7 | -130,226 | 39 | 99,238 | 62 | 30,988 | 57 |
| Brent | 217,274 | 53 | -23,610 | 78 | 20,030 | 22 | 3,580 | 58 |
| Heating Oil | 304,130 | 3 | 4,723 | 49 | -20,481 | 49 | 15,758 | 53 |
| Soybeans | 647,243 | 9 | 63,221 | 46 | -27,165 | 59 | -36,056 | 12 |
| Corn | 1,459,289 | 14 | 426,621 | 85 | -381,897 | 18 | -44,724 | 17 |
| Coffee | 260,063 | 29 | 60,308 | 92 | -63,167 | 10 | 2,859 | 8 |
| Sugar | 874,996 | 12 | 216,463 | 81 | -251,878 | 20 | 35,415 | 52 |
| Wheat | 361,469 | 14 | 11,965 | 57 | -5,152 | 36 | -6,813 | 69 |
CORN Futures:
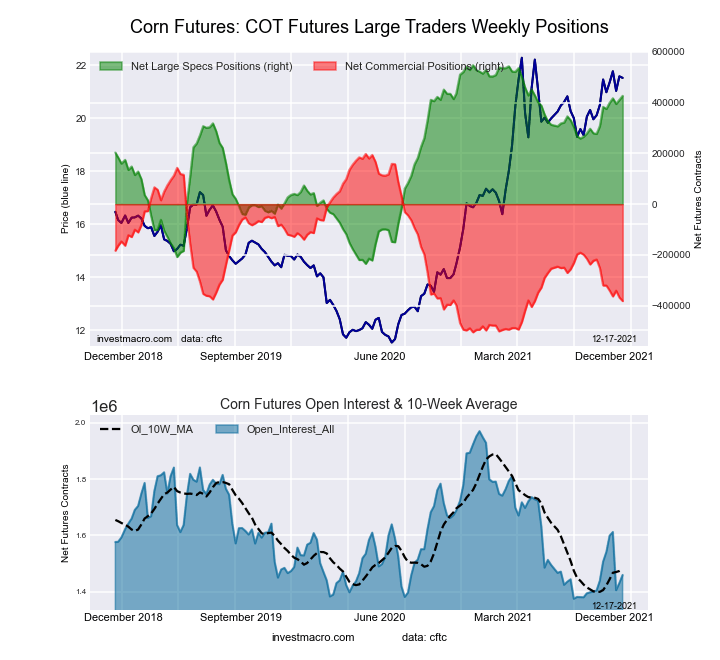 The CORN large speculator standing this week was a net position of 426,621 contracts in the data reported through Tuesday. This was a weekly increase of 15,807 contracts from the previous week which had a total of 410,814 net contracts.
This week’s current strength score (the trader positioning range over the past three years, measured from 0 to 100) shows the speculators are currently Bullish-Extreme with a score of 84.5 percent. The commercials are Bearish-Extreme with a score of 17.5 percent and the small traders (not shown in chart) are Bearish-Extreme with a score of 17.3 percent.
| CORN Futures Statistics | SPECULATORS | COMMERCIALS | SMALL TRADERS |
| – Percent of Open Interest Longs: | 34.0 | 45.5 | 8.9 |
| – Percent of Open Interest Shorts: | 4.7 | 71.6 | 12.0 |
| – Net Position: | 426,621 | -381,897 | -44,724 |
| – Gross Longs: | 495,864 | 663,387 | 130,158 |
| – Gross Shorts: | 69,243 | 1,045,284 | 174,882 |
| – Long to Short Ratio: | 7.2 to 1 | 0.6 to 1 | 0.7 to 1 |
| NET POSITION TREND: | |||
| – Strength Index Score (3 Year Range Pct): | 84.5 | 17.5 | 17.3 |
| – Strength Index Reading (3 Year Range): | Bullish-Extreme | Bearish-Extreme | Bearish-Extreme |
| NET POSITION MOVEMENT INDEX: | |||
| – 6-Week Change in Strength Index: | 5.6 | -8.8 | 10.3 |
SUGAR Futures:
 The SUGAR large speculator standing this week was a net position of 216,463 contracts in the data reported through Tuesday. This was a weekly lift of 25,224 contracts from the previous week which had a total of 191,239 net contracts.
This week’s current strength score (the trader positioning range over the past three years, measured from 0 to 100) shows the speculators are currently Bullish-Extreme with a score of 81.1 percent. The commercials are Bearish with a score of 20.4 percent and the small traders (not shown in chart) are Bullish with a score of 51.6 percent.
| SUGAR Futures Statistics | SPECULATORS | COMMERCIALS | SMALL TRADERS |
| – Percent of Open Interest Longs: | 29.4 | 47.1 | 9.7 |
| – Percent of Open Interest Shorts: | 4.7 | 75.9 | 5.7 |
| – Net Position: | 216,463 | -251,878 | 35,415 |
| – Gross Longs: | 257,362 | 412,123 | 85,082 |
| – Gross Shorts: | 40,899 | 664,001 | 49,667 |
| – Long to Short Ratio: | 6.3 to 1 | 0.6 to 1 | 1.7 to 1 |
| NET POSITION TREND: | |||
| – Strength Index Score (3 Year Range Pct): | 81.1 | 20.4 | 51.6 |
| – Strength Index Reading (3 Year Range): | Bullish-Extreme | Bearish | Bullish |
| NET POSITION MOVEMENT INDEX: | |||
| – 6-Week Change in Strength Index: | 1.5 | -0.2 | -7.9 |
COFFEE Futures:
 The COFFEE large speculator standing this week was a net position of 60,308 contracts in the data reported through Tuesday. This was a weekly decrease of -2,036 contracts from the previous week which had a total of 62,344 net contracts.
This week’s current strength score (the trader positioning range over the past three years, measured from 0 to 100) shows the speculators are currently Bullish-Extreme with a score of 92.4 percent. The commercials are Bearish-Extreme with a score of 10.3 percent and the small traders (not shown in chart) are Bearish-Extreme with a score of 8.1 percent.
| COFFEE Futures Statistics | SPECULATORS | COMMERCIALS | SMALL TRADERS |
| – Percent of Open Interest Longs: | 28.1 | 46.6 | 3.8 |
| – Percent of Open Interest Shorts: | 4.9 | 70.9 | 2.7 |
| – Net Position: | 60,308 | -63,167 | 2,859 |
| – Gross Longs: | 73,055 | 121,247 | 9,965 |
| – Gross Shorts: | 12,747 | 184,414 | 7,106 |
| – Long to Short Ratio: | 5.7 to 1 | 0.7 to 1 | 1.4 to 1 |
| NET POSITION TREND: | |||
| – Strength Index Score (3 Year Range Pct): | 92.4 | 10.3 | 8.1 |
| – Strength Index Reading (3 Year Range): | Bullish-Extreme | Bearish-Extreme | Bearish-Extreme |
| NET POSITION MOVEMENT INDEX: | |||
| – 6-Week Change in Strength Index: | -2.9 | 4.8 | -14.2 |
SOYBEANS Futures:
 The SOYBEANS large speculator standing this week was a net position of 63,221 contracts in the data reported through Tuesday. This was a weekly gain of 3,567 contracts from the previous week which had a total of 59,654 net contracts.
This week’s current strength score (the trader positioning range over the past three years, measured from 0 to 100) shows the speculators are currently Bearish with a score of 46.0 percent. The commercials are Bullish with a score of 59.4 percent and the small traders (not shown in chart) are Bearish-Extreme with a score of 11.8 percent.
| SOYBEANS Futures Statistics | SPECULATORS | COMMERCIALS | SMALL TRADERS |
| – Percent of Open Interest Longs: | 19.1 | 57.3 | 7.5 |
| – Percent of Open Interest Shorts: | 9.3 | 61.5 | 13.1 |
| – Net Position: | 63,221 | -27,165 | -36,056 |
| – Gross Longs: | 123,569 | 370,840 | 48,568 |
| – Gross Shorts: | 60,348 | 398,005 | 84,624 |
| – Long to Short Ratio: | 2.0 to 1 | 0.9 to 1 | 0.6 to 1 |
| NET POSITION TREND: | |||
| – Strength Index Score (3 Year Range Pct): | 46.0 | 59.4 | 11.8 |
| – Strength Index Reading (3 Year Range): | Bearish | Bullish | Bearish-Extreme |
| NET POSITION MOVEMENT INDEX: | |||
| – 6-Week Change in Strength Index: | 1.1 | -1.7 | 4.7 |
SOYBEAN MEAL Futures:
 The SOYBEAN MEAL large speculator standing this week was a net position of 71,429 contracts in the data reported through Tuesday. This was a weekly lift of 18,786 contracts from the previous week which had a total of 52,643 net contracts.
This week’s current strength score (the trader positioning range over the past three years, measured from 0 to 100) shows the speculators are currently Bullish with a score of 70.6 percent. The commercials are Bearish with a score of 28.8 percent and the small traders (not shown in chart) are Bullish with a score of 60.5 percent.
| SOYBEAN MEAL Futures Statistics | SPECULATORS | COMMERCIALS | SMALL TRADERS |
| – Percent of Open Interest Longs: | 25.0 | 46.1 | 12.7 |
| – Percent of Open Interest Shorts: | 6.6 | 70.2 | 6.9 |
| – Net Position: | 71,429 | -93,865 | 22,436 |
| – Gross Longs: | 97,124 | 179,389 | 49,385 |
| – Gross Shorts: | 25,695 | 273,254 | 26,949 |
| – Long to Short Ratio: | 3.8 to 1 | 0.7 to 1 | 1.8 to 1 |
| NET POSITION TREND: | |||
| – Strength Index Score (3 Year Range Pct): | 70.6 | 28.8 | 60.5 |
| – Strength Index Reading (3 Year Range): | Bullish | Bearish | Bullish |
| NET POSITION MOVEMENT INDEX: | |||
| – 6-Week Change in Strength Index: | 23.8 | -21.8 | -7.5 |
LIVE CATTLE Futures:
 The LIVE CATTLE large speculator standing this week was a net position of 79,514 contracts in the data reported through Tuesday. This was a weekly lift of 1,991 contracts from the previous week which had a total of 77,523 net contracts.
This week’s current strength score (the trader positioning range over the past three years, measured from 0 to 100) shows the speculators are currently Bearish with a score of 42.4 percent. The commercials are Bullish with a score of 53.8 percent and the small traders (not shown in chart) are Bullish with a score of 53.5 percent.
| LIVE CATTLE Futures Statistics | SPECULATORS | COMMERCIALS | SMALL TRADERS |
| – Percent of Open Interest Longs: | 40.4 | 36.7 | 9.0 |
| – Percent of Open Interest Shorts: | 14.6 | 58.0 | 13.5 |
| – Net Position: | 79,514 | -65,710 | -13,804 |
| – Gross Longs: | 124,688 | 113,185 | 27,910 |
| – Gross Shorts: | 45,174 | 178,895 | 41,714 |
| – Long to Short Ratio: | 2.8 to 1 | 0.6 to 1 | 0.7 to 1 |
| NET POSITION TREND: | |||
| – Strength Index Score (3 Year Range Pct): | 42.4 | 53.8 | 53.5 |
| – Strength Index Reading (3 Year Range): | Bearish | Bullish | Bullish |
| NET POSITION MOVEMENT INDEX: | |||
| – 6-Week Change in Strength Index: | 25.3 | -23.9 | -21.1 |
LEAN HOGS Futures:
 The LEAN HOGS large speculator standing this week was a net position of 54,202 contracts in the data reported through Tuesday. This was a weekly advance of 1,905 contracts from the previous week which had a total of 52,297 net contracts.
This week’s current strength score (the trader positioning range over the past three years, measured from 0 to 100) shows the speculators are currently Bullish with a score of 67.1 percent. The commercials are Bearish with a score of 44.4 percent and the small traders (not shown in chart) are Bearish-Extreme with a score of 6.3 percent.
| LEAN HOGS Futures Statistics | SPECULATORS | COMMERCIALS | SMALL TRADERS |
| – Percent of Open Interest Longs: | 42.4 | 35.9 | 6.9 |
| – Percent of Open Interest Shorts: | 16.9 | 53.3 | 15.0 |
| – Net Position: | 54,202 | -37,071 | -17,131 |
| – Gross Longs: | 90,314 | 76,453 | 14,782 |
| – Gross Shorts: | 36,112 | 113,524 | 31,913 |
| – Long to Short Ratio: | 2.5 to 1 | 0.7 to 1 | 0.5 to 1 |
| NET POSITION TREND: | |||
| – Strength Index Score (3 Year Range Pct): | 67.1 | 44.4 | 6.3 |
| – Strength Index Reading (3 Year Range): | Bullish | Bearish | Bearish-Extreme |
| NET POSITION MOVEMENT INDEX: | |||
| – 6-Week Change in Strength Index: | 8.6 | -5.6 | -12.6 |
COTTON Futures:
 The COTTON large speculator standing this week was a net position of 88,688 contracts in the data reported through Tuesday. This was a weekly decline of -1,326 contracts from the previous week which had a total of 90,014 net contracts.
This week’s current strength score (the trader positioning range over the past three years, measured from 0 to 100) shows the speculators are currently Bullish with a score of 79.2 percent. The commercials are Bearish with a score of 20.4 percent and the small traders (not shown in chart) are Bullish with a score of 75.0 percent.
| COTTON Futures Statistics | SPECULATORS | COMMERCIALS | SMALL TRADERS |
| – Percent of Open Interest Longs: | 43.6 | 36.2 | 7.5 |
| – Percent of Open Interest Shorts: | 5.6 | 78.5 | 3.2 |
| – Net Position: | 88,688 | -98,538 | 9,850 |
| – Gross Longs: | 101,772 | 84,397 | 17,387 |
| – Gross Shorts: | 13,084 | 182,935 | 7,537 |
| – Long to Short Ratio: | 7.8 to 1 | 0.5 to 1 | 2.3 to 1 |
| NET POSITION TREND: | |||
| – Strength Index Score (3 Year Range Pct): | 79.2 | 20.4 | 75.0 |
| – Strength Index Reading (3 Year Range): | Bullish | Bearish | Bullish |
| NET POSITION MOVEMENT INDEX: | |||
| – 6-Week Change in Strength Index: | -9.5 | 10.7 | -21.2 |
COCOA Futures:
 The COCOA large speculator standing this week was a net position of -1,101 contracts in the data reported through Tuesday. This was a weekly increase of 7,994 contracts from the previous week which had a total of -9,095 net contracts.
This week’s current strength score (the trader positioning range over the past three years, measured from 0 to 100) shows the speculators are currently Bearish with a score of 22.3 percent. The commercials are Bullish with a score of 78.9 percent and the small traders (not shown in chart) are Bearish with a score of 20.5 percent.
| COCOA Futures Statistics | SPECULATORS | COMMERCIALS | SMALL TRADERS |
| – Percent of Open Interest Longs: | 27.4 | 52.5 | 4.9 |
| – Percent of Open Interest Shorts: | 27.9 | 52.5 | 4.4 |
| – Net Position: | -1,101 | 46 | 1,055 |
| – Gross Longs: | 64,561 | 123,465 | 11,485 |
| – Gross Shorts: | 65,662 | 123,419 | 10,430 |
| – Long to Short Ratio: | 1.0 to 1 | 1.0 to 1 | 1.1 to 1 |
| NET POSITION TREND: | |||
| – Strength Index Score (3 Year Range Pct): | 22.3 | 78.9 | 20.5 |
| – Strength Index Reading (3 Year Range): | Bearish | Bullish | Bearish |
| NET POSITION MOVEMENT INDEX: | |||
| – 6-Week Change in Strength Index: | -15.7 | 18.0 | -34.1 |
WHEAT Futures:
 The WHEAT large speculator standing this week was a net position of 11,965 contracts in the data reported through Tuesday. This was a weekly reduction of -3,702 contracts from the previous week which had a total of 15,667 net contracts.
This week’s current strength score (the trader positioning range over the past three years, measured from 0 to 100) shows the speculators are currently Bullish with a score of 57.2 percent. The commercials are Bearish with a score of 35.8 percent and the small traders (not shown in chart) are Bullish with a score of 69.0 percent.
| WHEAT Futures Statistics | SPECULATORS | COMMERCIALS | SMALL TRADERS |
| – Percent of Open Interest Longs: | 30.3 | 35.5 | 9.0 |
| – Percent of Open Interest Shorts: | 27.0 | 36.9 | 10.9 |
| – Net Position: | 11,965 | -5,152 | -6,813 |
| – Gross Longs: | 109,485 | 128,325 | 32,453 |
| – Gross Shorts: | 97,520 | 133,477 | 39,266 |
| – Long to Short Ratio: | 1.1 to 1 | 1.0 to 1 | 0.8 to 1 |
| NET POSITION TREND: | |||
| – Strength Index Score (3 Year Range Pct): | 57.2 | 35.8 | 69.0 |
| – Strength Index Reading (3 Year Range): | Bullish | Bearish | Bullish |
| NET POSITION MOVEMENT INDEX: | |||
| – 6-Week Change in Strength Index: | -5.1 | 5.8 | -0.3 |
Article By InvestMacro – Receive our weekly COT Reports by Email
*COT Report: The COT data, released weekly to the public each Friday, is updated through the most recent Tuesday (data is 3 days old) and shows a quick view of how large speculators or non-commercials (for-profit traders) were positioned in the futures markets.
The CFTC categorizes trader positions according to commercial hedgers (traders who use futures contracts for hedging as part of the business), non-commercials (large traders who speculate to realize trading profits) and nonreportable traders (usually small traders/speculators) as well as their open interest (contracts open in the market at time of reporting).See CFTC criteria here.

- The US Tech sector hit by sell‑off. Oil prices decline on renewed negotiations Jul 28, 2026
- Gold Declines, Focus on Fed and Falling Oil Prices Jul 28, 2026
- This week will be one of the most crowded for central‑bank meetings Jul 27, 2026
- EUR/USD Ahead of a Key Week: Holding Near Lows Jul 27, 2026
- COT Metals Charts: Weekly Speculator Changes led by Copper Jul 26, 2026
- COT Bonds Charts: Speculator Bets led by SOFR 3-Months & 5-Year Bonds Jul 26, 2026
- COT Energy Charts: Weekly Speculator Bets led by WTI Crude & Natural Gas Jul 26, 2026
- COT Soft Commodities Charts: Weekly Speculator Bets led by Corn & Soybeans Jul 26, 2026
- The US introduces new import tariffs for 60 countries. Brent crude surpasses $100 per barrel Jul 24, 2026
- USD/JPY Breaks Records: Nothing Slows the Yen’s Decline Jul 24, 2026