
By InvestMacro | COT | Data Tables | COT Leaders | Downloads | COT Newsletter
Here are the latest charts and statistics for the Commitment of Traders (COT) data published by the Commodities Futures Trading Commission (CFTC). The latest COT data is updated through Tuesday December 14th 2021 and shows a quick view of how large traders (for-profit speculators and commercial entities) were positioned in the futures markets.
Highlighting this week’s COT energy data is the continued decreases in the WTI Crude Oil futures bets. The speculative net position in the WTI Crude Oil futures has declined for five weeks in a row and for seven out of the previous eight weeks. The WTI speculator positions have now slid by a total of -74,175 contracts over the past five week time-frame. This recent weakness has pushed the current net speculator standing for WTI positions to the lowest level in the past one-hundred and forty-six weeks, dating back to February 26th of 2019.
Joining WTI Crude Oil (-20,095 contracts) in falling this week were Brent Crude Oil (-3,164 contracts) and Heating Oil (-3,874 contracts). The markets with increasing speculators bets this week were Natural Gas (2,217 contracts), Gasoline (6,551 contracts) and the Bloomberg Commodity Index (7,838 contracts).
| Dec-14-2021 | OI | OI-Index | Spec-Net | Spec-Index | Com-Net | COM-Index | Smalls-Net | Smalls-Index |
|---|---|---|---|---|---|---|---|---|
| WTI Crude | 1,953,397 | 0 | 347,137 | 22 | -385,527 | 67 | 38,390 | 69 |
| Gold | 503,709 | 20 | 202,401 | 52 | -231,411 | 47 | 29,010 | 47 |
| Silver | 142,384 | 9 | 21,984 | 44 | -35,855 | 64 | 13,871 | 21 |
| Copper | 171,976 | 6 | 6,697 | 47 | -13,108 | 50 | 6,411 | 62 |
| Palladium | 10,098 | 16 | -3,774 | 0 | 4,125 | 100 | -351 | 24 |
| Platinum | 66,300 | 32 | 3,731 | 8 | -9,661 | 95 | 5,930 | 45 |
| Natural Gas | 1,153,450 | 7 | -130,226 | 39 | 99,238 | 62 | 30,988 | 57 |
| Brent | 217,274 | 53 | -23,610 | 78 | 20,030 | 22 | 3,580 | 58 |
| Heating Oil | 304,130 | 3 | 4,723 | 49 | -20,481 | 49 | 15,758 | 53 |
| Soybeans | 647,243 | 9 | 63,221 | 46 | -27,165 | 59 | -36,056 | 12 |
| Corn | 1,459,289 | 14 | 426,621 | 85 | -381,897 | 18 | -44,724 | 17 |
| Coffee | 260,063 | 29 | 60,308 | 92 | -63,167 | 10 | 2,859 | 8 |
| Sugar | 874,996 | 12 | 216,463 | 81 | -251,878 | 20 | 35,415 | 52 |
| Wheat | 361,469 | 14 | 11,965 | 57 | -5,152 | 36 | -6,813 | 69 |
WTI Crude Oil Futures:
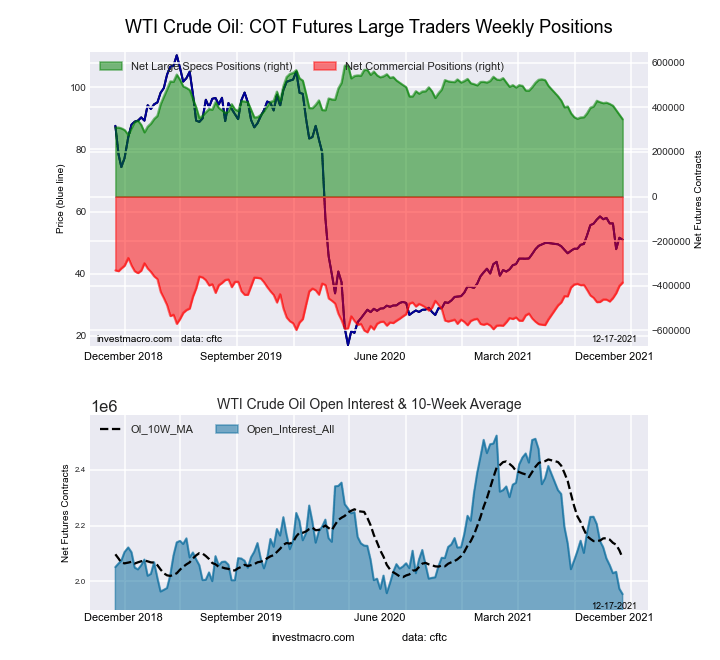 The WTI Crude Oil Futures large speculator standing this week totaled a net position of 347,137 contracts in the data reported through Tuesday. This was a weekly fall of -20,095 contracts from the previous week which had a total of 367,232 net contracts.
Free Reports:
 Get our Weekly Commitment of Traders Reports - See where the biggest traders (Hedge Funds and Commercial Hedgers) are positioned in the futures markets on a weekly basis.
 Download Our Metatrader 4 Indicators – Put Our Free MetaTrader 4 Custom Indicators on your charts when you join our Weekly Newsletter
This week’s current strength score (the trader positioning range over the past three years, measured from 0 to 100) shows the speculators are currently Bearish with a score of 22.4 percent. The commercials are Bullish with a score of 66.9 percent and the small traders (not shown in chart) are Bullish with a score of 69.1 percent.
| WTI Crude Oil Futures Statistics | SPECULATORS | COMMERCIALS | SMALL TRADERS |
| – Percent of Open Interest Longs: | 24.7 | 37.9 | 4.5 |
| – Percent of Open Interest Shorts: | 7.0 | 57.6 | 2.5 |
| – Net Position: | 347,137 | -385,527 | 38,390 |
| – Gross Longs: | 483,233 | 739,745 | 87,432 |
| – Gross Shorts: | 136,096 | 1,125,272 | 49,042 |
| – Long to Short Ratio: | 3.6 to 1 | 0.7 to 1 | 1.8 to 1 |
| NET POSITION TREND: | |||
| – Strength Index Score (3 Year Range Pct): | 22.4 | 66.9 | 69.1 |
| – Strength Index Reading (3 Year Range): | Bearish | Bullish | Bullish |
| NET POSITION MOVEMENT INDEX: | |||
| – 6-Week Change in Strength Index: | -23.1 | 22.8 | -5.4 |
Brent Crude Oil Futures:
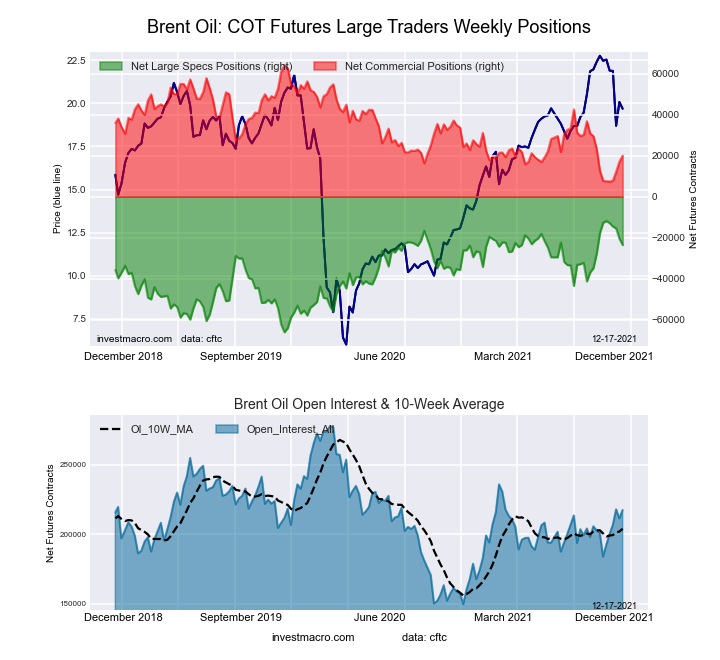 The Brent Crude Oil Futures large speculator standing this week totaled a net position of -23,610 contracts in the data reported through Tuesday. This was a weekly decline of -3,164 contracts from the previous week which had a total of -20,446 net contracts.
This week’s current strength score (the trader positioning range over the past three years, measured from 0 to 100) shows the speculators are currently Bullish with a score of 78.4 percent. The commercials are Bearish with a score of 22.2 percent and the small traders (not shown in chart) are Bullish with a score of 57.8 percent.
| Brent Crude Oil Futures Statistics | SPECULATORS | COMMERCIALS | SMALL TRADERS |
| – Percent of Open Interest Longs: | 19.8 | 44.4 | 3.5 |
| – Percent of Open Interest Shorts: | 30.7 | 35.2 | 1.9 |
| – Net Position: | -23,610 | 20,030 | 3,580 |
| – Gross Longs: | 43,014 | 96,539 | 7,666 |
| – Gross Shorts: | 66,624 | 76,509 | 4,086 |
| – Long to Short Ratio: | 0.6 to 1 | 1.3 to 1 | 1.9 to 1 |
| NET POSITION TREND: | |||
| – Strength Index Score (3 Year Range Pct): | 78.4 | 22.2 | 57.8 |
| – Strength Index Reading (3 Year Range): | Bullish | Bearish | Bullish |
| NET POSITION MOVEMENT INDEX: | |||
| – 6-Week Change in Strength Index: | -20.0 | 21.7 | -19.5 |
Natural Gas Futures:
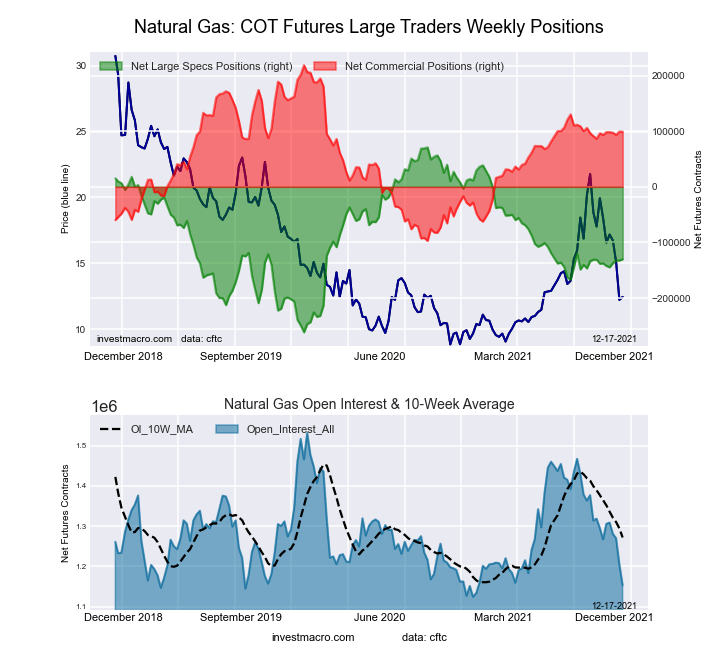 The Natural Gas Futures large speculator standing this week totaled a net position of -130,226 contracts in the data reported through Tuesday. This was a weekly increase of 2,217 contracts from the previous week which had a total of -132,443 net contracts.
This week’s current strength score (the trader positioning range over the past three years, measured from 0 to 100) shows the speculators are currently Bearish with a score of 39.5 percent. The commercials are Bullish with a score of 62.2 percent and the small traders (not shown in chart) are Bullish with a score of 57.5 percent.
| Natural Gas Futures Statistics | SPECULATORS | COMMERCIALS | SMALL TRADERS |
| – Percent of Open Interest Longs: | 19.5 | 44.4 | 4.6 |
| – Percent of Open Interest Shorts: | 30.8 | 35.7 | 1.9 |
| – Net Position: | -130,226 | 99,238 | 30,988 |
| – Gross Longs: | 224,710 | 511,567 | 52,930 |
| – Gross Shorts: | 354,936 | 412,329 | 21,942 |
| – Long to Short Ratio: | 0.6 to 1 | 1.2 to 1 | 2.4 to 1 |
| NET POSITION TREND: | |||
| – Strength Index Score (3 Year Range Pct): | 39.5 | 62.2 | 57.5 |
| – Strength Index Reading (3 Year Range): | Bearish | Bullish | Bullish |
| NET POSITION MOVEMENT INDEX: | |||
| – 6-Week Change in Strength Index: | 2.3 | 1.8 | -33.4 |
Gasoline Blendstock Futures:
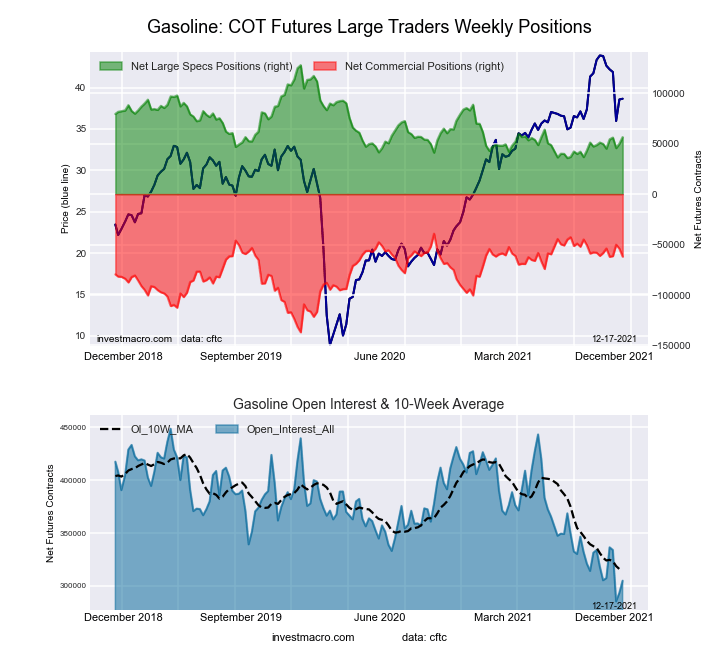 The Gasoline Blendstock Futures large speculator standing this week totaled a net position of 56,434 contracts in the data reported through Tuesday. This was a weekly increase of 6,551 contracts from the previous week which had a total of 49,883 net contracts.
This week’s current strength score (the trader positioning range over the past three years, measured from 0 to 100) shows the speculators are currently Bearish with a score of 27.5 percent. The commercials are Bullish with a score of 75.1 percent and the small traders (not shown in chart) are Bearish with a score of 44.4 percent.
| Nasdaq Mini Futures Statistics | SPECULATORS | COMMERCIALS | SMALL TRADERS |
| – Percent of Open Interest Longs: | 30.2 | 44.8 | 5.8 |
| – Percent of Open Interest Shorts: | 11.7 | 65.2 | 4.0 |
| – Net Position: | 56,434 | -61,932 | 5,498 |
| – Gross Longs: | 92,136 | 136,769 | 17,790 |
| – Gross Shorts: | 35,702 | 198,701 | 12,292 |
| – Long to Short Ratio: | 2.6 to 1 | 0.7 to 1 | 1.4 to 1 |
| NET POSITION TREND: | |||
| – Strength Index Score (3 Year Range Pct): | 27.5 | 75.1 | 44.4 |
| – Strength Index Reading (3 Year Range): | Bearish | Bullish | Bearish |
| NET POSITION MOVEMENT INDEX: | |||
| – 6-Week Change in Strength Index: | 6.8 | -3.6 | -18.5 |
#2 Heating Oil NY-Harbor Futures:
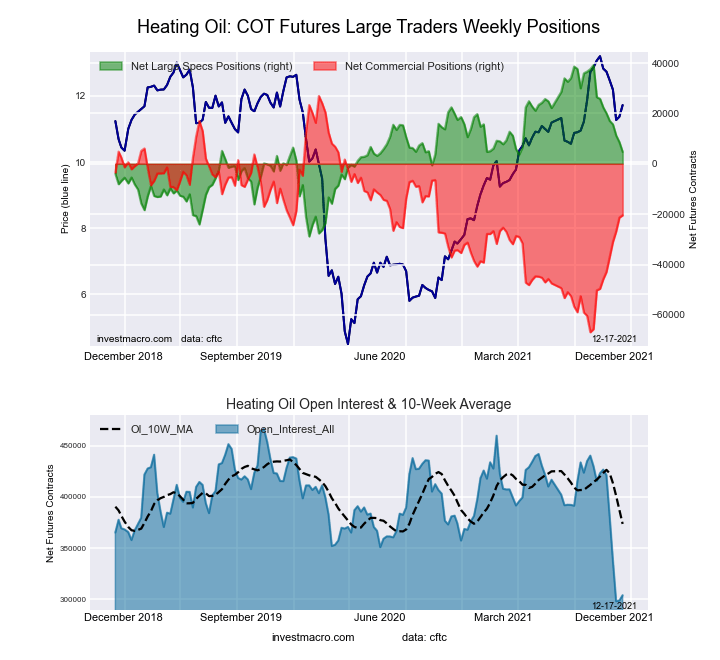 The #2 Heating Oil NY-Harbor Futures large speculator standing this week totaled a net position of 4,723 contracts in the data reported through Tuesday. This was a weekly fall of -3,874 contracts from the previous week which had a total of 8,597 net contracts.
This week’s current strength score (the trader positioning range over the past three years, measured from 0 to 100) shows the speculators are currently Bearish with a score of 49.4 percent. The commercials are Bearish with a score of 49.5 percent and the small traders (not shown in chart) are Bullish with a score of 52.9 percent.
| Heating Oil Futures Statistics | SPECULATORS | COMMERCIALS | SMALL TRADERS |
| – Percent of Open Interest Longs: | 12.3 | 52.8 | 13.2 |
| – Percent of Open Interest Shorts: | 10.7 | 59.5 | 8.0 |
| – Net Position: | 4,723 | -20,481 | 15,758 |
| – Gross Longs: | 37,337 | 160,612 | 40,145 |
| – Gross Shorts: | 32,614 | 181,093 | 24,387 |
| – Long to Short Ratio: | 1.1 to 1 | 0.9 to 1 | 1.6 to 1 |
| NET POSITION TREND: | |||
| – Strength Index Score (3 Year Range Pct): | 49.4 | 49.5 | 52.9 |
| – Strength Index Reading (3 Year Range): | Bearish | Bearish | Bullish |
| NET POSITION MOVEMENT INDEX: | |||
| – 6-Week Change in Strength Index: | -26.0 | 27.0 | -26.7 |
Bloomberg Commodity Index Futures:
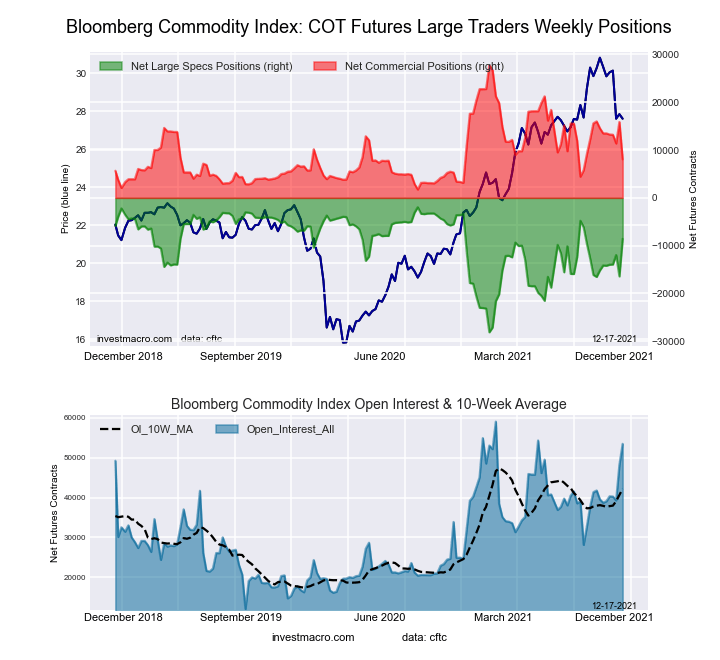 The Bloomberg Commodity Index Futures large speculator standing this week totaled a net position of -8,583 contracts in the data reported through Tuesday. This was a weekly increase of 7,838 contracts from the previous week which had a total of -16,421 net contracts.
This week’s current strength score (the trader positioning range over the past three years, measured from 0 to 100) shows the speculators are currently Bullish with a score of 74.6 percent. The commercials are Bearish with a score of 24.3 percent and the small traders (not shown in chart) are Bearish with a score of 46.8 percent.
| Bloomberg Index Futures Statistics | SPECULATORS | COMMERCIALS | SMALL TRADERS |
| – Percent of Open Interest Longs: | 55.1 | 19.5 | 1.0 |
| – Percent of Open Interest Shorts: | 71.2 | 4.4 | 0.1 |
| – Net Position: | -8,583 | 8,071 | 512 |
| – Gross Longs: | 29,505 | 10,444 | 539 |
| – Gross Shorts: | 38,088 | 2,373 | 27 |
| – Long to Short Ratio: | 0.8 to 1 | 4.4 to 1 | 20.0 to 1 |
| NET POSITION TREND: | |||
| – Strength Index Score (3 Year Range Pct): | 74.6 | 24.3 | 46.8 |
| – Strength Index Reading (3 Year Range): | Bullish | Bearish | Bearish |
| NET POSITION MOVEMENT INDEX: | |||
| – 6-Week Change in Strength Index: | 21.3 | -20.8 | -6.3 |
Article By InvestMacro – Receive our weekly COT Reports by Email
*COT Report: The COT data, released weekly to the public each Friday, is updated through the most recent Tuesday (data is 3 days old) and shows a quick view of how large speculators or non-commercials (for-profit traders) were positioned in the futures markets.
The CFTC categorizes trader positions according to commercial hedgers (traders who use futures contracts for hedging as part of the business), non-commercials (large traders who speculate to realize trading profits) and nonreportable traders (usually small traders/speculators) as well as their open interest (contracts open in the market at time of reporting).See CFTC criteria here.

- The US Tech sector hit by sell‑off. Oil prices decline on renewed negotiations Jul 28, 2026
- Gold Declines, Focus on Fed and Falling Oil Prices Jul 28, 2026
- This week will be one of the most crowded for central‑bank meetings Jul 27, 2026
- EUR/USD Ahead of a Key Week: Holding Near Lows Jul 27, 2026
- COT Metals Charts: Weekly Speculator Changes led by Copper Jul 26, 2026
- COT Bonds Charts: Speculator Bets led by SOFR 3-Months & 5-Year Bonds Jul 26, 2026
- COT Energy Charts: Weekly Speculator Bets led by WTI Crude & Natural Gas Jul 26, 2026
- COT Soft Commodities Charts: Weekly Speculator Bets led by Corn & Soybeans Jul 26, 2026
- The US introduces new import tariffs for 60 countries. Brent crude surpasses $100 per barrel Jul 24, 2026
- USD/JPY Breaks Records: Nothing Slows the Yen’s Decline Jul 24, 2026