By InvestMacro | COT | Data Tables | COT Leaders | Downloads | COT Newsletter
Here are the latest charts and statistics for the Commitment of Traders (COT) data published by the Commodities Futures Trading Commission (CFTC).
The latest COT data is updated through Tuesday November 16th 2021 and shows a quick view of how large traders (for-profit speculators and commercial entities) were positioned in the futures markets.
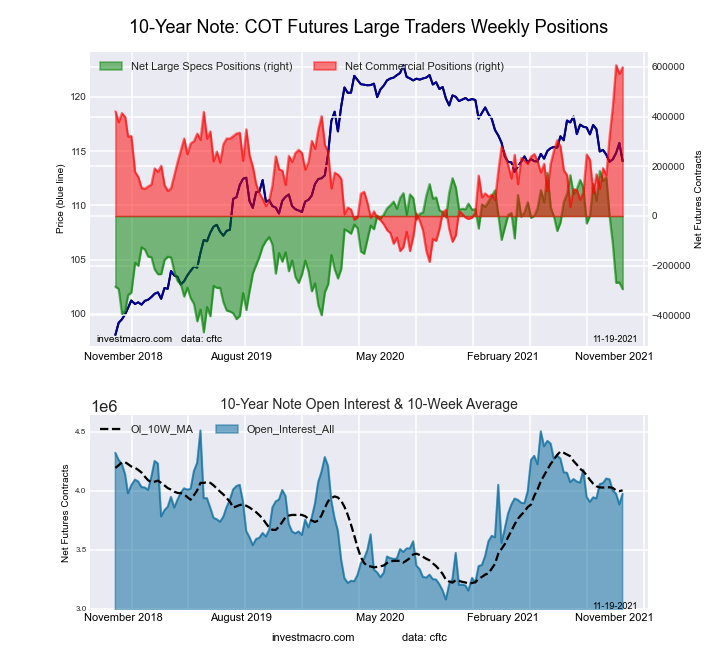
Highlighting the COT Bonds data this week is the increase in bearishness of the 10-Year Treasury Note speculators. The 10-Year speculative positions fell by -26,809 net contracts this week and have now declined in four out of the past five weeks. Speculator net positions have experienced a huge drop of -450,183 contracts in just that 5-week period. This bearishness has dropped the current spec level to the most bearish standing since February 18th of 2020, a span of ninety-one weeks.
Looking at the overall situation in the 10-Year futures market shows that speculators (-294,141 contracts) and small traders (-304,450 contracts) currently make up the bearish side while the commercial hedgers (598,591 contracts) are very bullish and sport a strength index score of 99 percent. This means that commercial traders are right at the top of their range of bullishness over the past three years and as these traders can eventually move markets, this situation bears watching.
| Nov-16-2021 | OI | OI-Index | Spec-Net | Spec-Index | Com-Net | COM-Index | Smalls-Net | Smalls-Index |
|---|---|---|---|---|---|---|---|---|
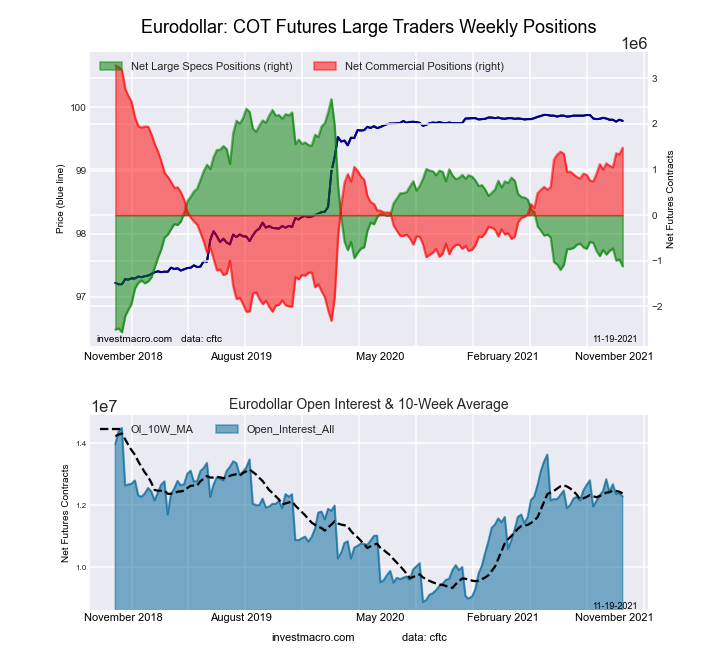
| Eurodollar | 12,283,299 | 61 | -1,119,283 | 28 | 1,477,223 | 68 | -357,940 | 55 |
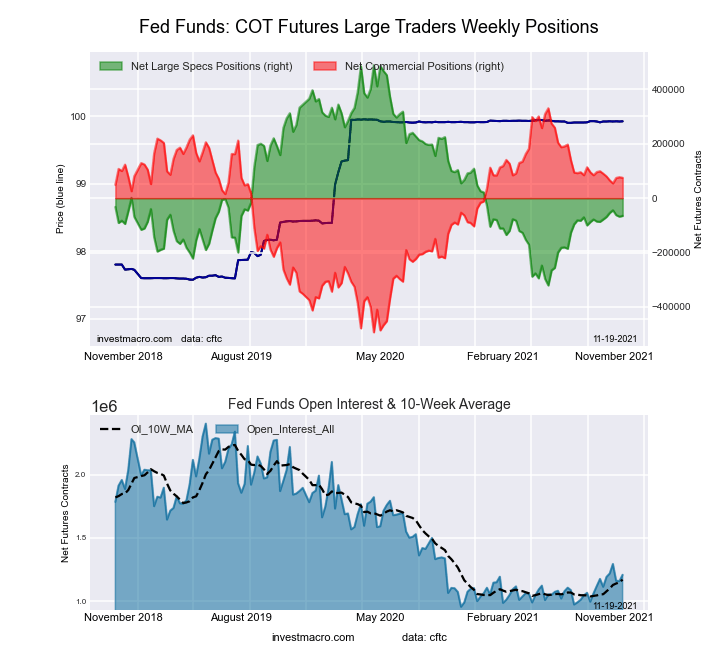
| FedFunds | 1,207,677 | 17 | -65,206 | 32 | 74,839 | 69 | -9,633 | 45 |
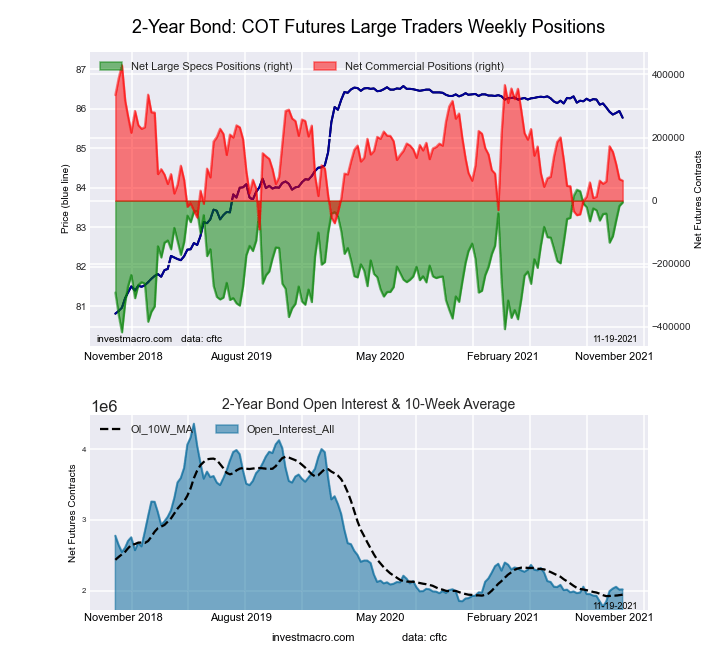
| 2-Year | 2,016,362 | 9 | -5,445 | 91 | 63,501 | 30 | -58,056 | 0 |
| Long T-Bond | 1,232,186 | 54 | -16,368 | 88 | 8,293 | 23 | 8,075 | 59 |
| 10-Year | 3,972,392 | 62 | -294,141 | 27 | 598,591 | 99 | -304,450 | 8 |
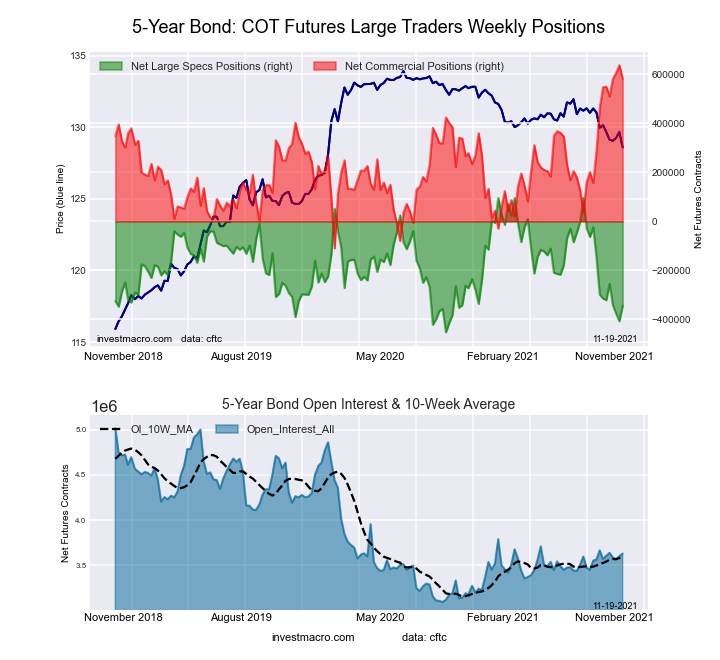
| 5-Year | 3,630,431 | 28 | -344,595 | 20 | 581,981 | 93 | -237,386 | 5 |
Free Reports:
This week’s current strength score (the trader positioning range over the past three years, measured from 0 to 100) shows the speculators are currently Bearish with a score of 28.3 percent. The commercials are Bullish with a score of 67.7 percent and the small traders (not shown in chart) are Bullish with a score of 55.5 percent.
| 3-Month Eurodollars Statistics | SPECULATORS | COMMERCIALS | SMALL TRADERS |
| – Percent of Open Interest Longs: | 12.0 | 66.3 | 4.4 |
| – Percent of Open Interest Shorts: | 21.1 | 54.2 | 7.3 |
| – Net Position: | -1,119,283 | 1,477,223 | -357,940 |
| – Gross Longs: | 1,477,552 | 8,137,706 | 540,741 |
| – Gross Shorts: | 2,596,835 | 6,660,483 | 898,681 |
| – Long to Short Ratio: | 0.6 to 1 | 1.2 to 1 | 0.6 to 1 |
| NET POSITION TREND: | |||
| – COT Index Score (3 Year Range Pct): | 28.3 | 67.7 | 55.5 |
| – COT Index Reading (3 Year Range): | Bearish | Bullish | Bullish |
| NET POSITION MOVEMENT INDEX: | |||
| – 6-Week Change in Strength Index: | -7.0 | 8.6 | -16.1 |
This week’s current strength score (the trader positioning range over the past three years, measured from 0 to 100) shows the speculators are currently Bearish with a score of 31.6 percent. The commercials are Bullish with a score of 69.0 percent and the small traders (not shown in chart) are Bearish with a score of 44.5 percent.
| 30-Day Federal Funds Statistics | SPECULATORS | COMMERCIALS | SMALL TRADERS |
| – Percent of Open Interest Longs: | 4.9 | 81.4 | 1.7 |
| – Percent of Open Interest Shorts: | 10.3 | 75.2 | 2.5 |
| – Net Position: | -65,206 | 74,839 | -9,633 |
| – Gross Longs: | 58,782 | 982,458 | 20,741 |
| – Gross Shorts: | 123,988 | 907,619 | 30,374 |
| – Long to Short Ratio: | 0.5 to 1 | 1.1 to 1 | 0.7 to 1 |
| NET POSITION TREND: | |||
| – COT Index Score (3 Year Range Pct): | 31.6 | 69.0 | 44.5 |
| – COT Index Reading (3 Year Range): | Bearish | Bullish | Bearish |
| NET POSITION MOVEMENT INDEX: | |||
| – 6-Week Change in Strength Index: | 1.6 | -1.8 | 4.3 |
This week’s current strength score (the trader positioning range over the past three years, measured from 0 to 100) shows the speculators are currently Bullish-Extreme with a score of 91.1 percent. The commercials are Bearish with a score of 29.6 percent and the small traders (not shown in chart) are Bearish-Extreme with a score of 0.0 percent.
| 2-Year Treasury Note Statistics | SPECULATORS | COMMERCIALS | SMALL TRADERS |
| – Percent of Open Interest Longs: | 17.1 | 73.3 | 6.0 |
| – Percent of Open Interest Shorts: | 17.4 | 70.1 | 8.9 |
| – Net Position: | -5,445 | 63,501 | -58,056 |
| – Gross Longs: | 345,245 | 1,477,100 | 121,652 |
| – Gross Shorts: | 350,690 | 1,413,599 | 179,708 |
| – Long to Short Ratio: | 1.0 to 1 | 1.0 to 1 | 0.7 to 1 |
| NET POSITION TREND: | |||
| – COT Index Score (3 Year Range Pct): | 91.1 | 29.6 | 0.0 |
| – COT Index Reading (3 Year Range): | Bullish-Extreme | Bearish | Bearish-Extreme |
| NET POSITION MOVEMENT INDEX: | |||
| – 6-Week Change in Strength Index: | 8.2 | 1.9 | -25.8 |
This week’s current strength score (the trader positioning range over the past three years, measured from 0 to 100) shows the speculators are currently Bearish-Extreme with a score of 19.7 percent. The commercials are Bullish-Extreme with a score of 92.6 percent and the small traders (not shown in chart) are Bearish-Extreme with a score of 5.5 percent.
| 5-Year Treasury Note Statistics | SPECULATORS | COMMERCIALS | SMALL TRADERS |
| – Percent of Open Interest Longs: | 8.3 | 81.1 | 7.2 |
| – Percent of Open Interest Shorts: | 17.8 | 65.1 | 13.7 |
| – Net Position: | -344,595 | 581,981 | -237,386 |
| – Gross Longs: | 300,750 | 2,944,901 | 261,002 |
| – Gross Shorts: | 645,345 | 2,362,920 | 498,388 |
| – Long to Short Ratio: | 0.5 to 1 | 1.2 to 1 | 0.5 to 1 |
| NET POSITION TREND: | |||
| – COT Index Score (3 Year Range Pct): | 19.7 | 92.6 | 5.5 |
| – COT Index Reading (3 Year Range): | Bearish-Extreme | Bullish-Extreme | Bearish-Extreme |
| NET POSITION MOVEMENT INDEX: | |||
| – 6-Week Change in Strength Index: | -5.4 | 4.5 | -1.3 |
This week’s current strength score (the trader positioning range over the past three years, measured from 0 to 100) shows the speculators are currently Bearish with a score of 26.7 percent. The commercials are Bullish-Extreme with a score of 99.0 percent and the small traders (not shown in chart) are Bearish-Extreme with a score of 7.8 percent.
| 10-Year Treasury Note Statistics | SPECULATORS | COMMERCIALS | SMALL TRADERS |
| – Percent of Open Interest Longs: | 12.3 | 76.9 | 7.4 |
| – Percent of Open Interest Shorts: | 19.7 | 61.8 | 15.1 |
| – Net Position: | -294,141 | 598,591 | -304,450 |
| – Gross Longs: | 486,980 | 3,053,354 | 293,521 |
| – Gross Shorts: | 781,121 | 2,454,763 | 597,971 |
| – Long to Short Ratio: | 0.6 to 1 | 1.2 to 1 | 0.5 to 1 |
| NET POSITION TREND: | |||
| – COT Index Score (3 Year Range Pct): | 26.7 | 99.0 | 7.8 |
| – COT Index Reading (3 Year Range): | Bearish | Bullish-Extreme | Bearish-Extreme |
| NET POSITION MOVEMENT INDEX: | |||
| – 6-Week Change in Strength Index: | -67.1 | 51.3 | 6.9 |
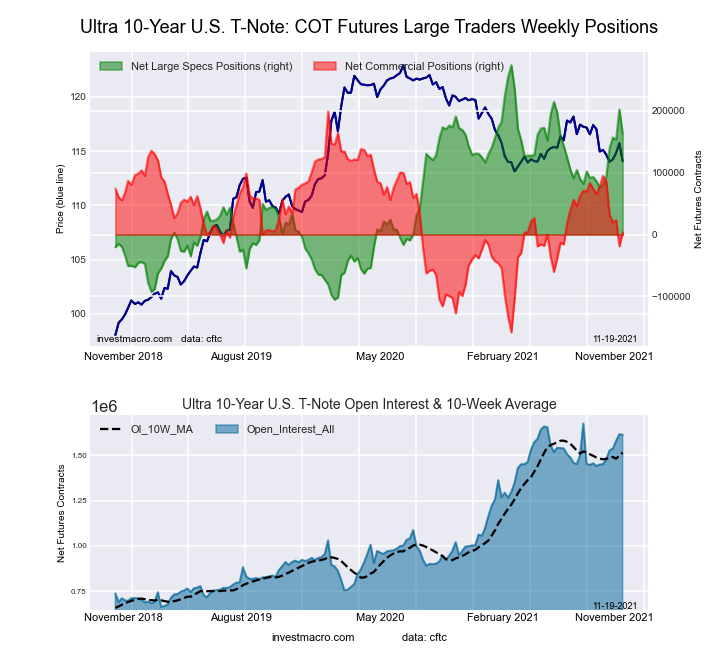
This week’s current strength score (the trader positioning range over the past three years, measured from 0 to 100) shows the speculators are currently Bullish with a score of 70.6 percent. The commercials are Bearish with a score of 45.2 percent and the small traders (not shown in chart) are Bearish-Extreme with a score of 11.0 percent.
| Ultra 10-Year Notes Statistics | SPECULATORS | COMMERCIALS | SMALL TRADERS |
| – Percent of Open Interest Longs: | 20.1 | 71.6 | 7.0 |
| – Percent of Open Interest Shorts: | 10.1 | 71.4 | 17.3 |
| – Net Position: | 162,410 | 3,376 | -165,786 |
| – Gross Longs: | 324,961 | 1,154,942 | 113,100 |
| – Gross Shorts: | 162,551 | 1,151,566 | 278,886 |
| – Long to Short Ratio: | 2.0 to 1 | 1.0 to 1 | 0.4 to 1 |
| NET POSITION TREND: | |||
| – COT Index Score (3 Year Range Pct): | 70.6 | 45.2 | 11.0 |
| – COT Index Reading (3 Year Range): | Bullish | Bearish | Bearish-Extreme |
| NET POSITION MOVEMENT INDEX: | |||
| – 6-Week Change in Strength Index: | 21.5 | -25.6 | 6.2 |
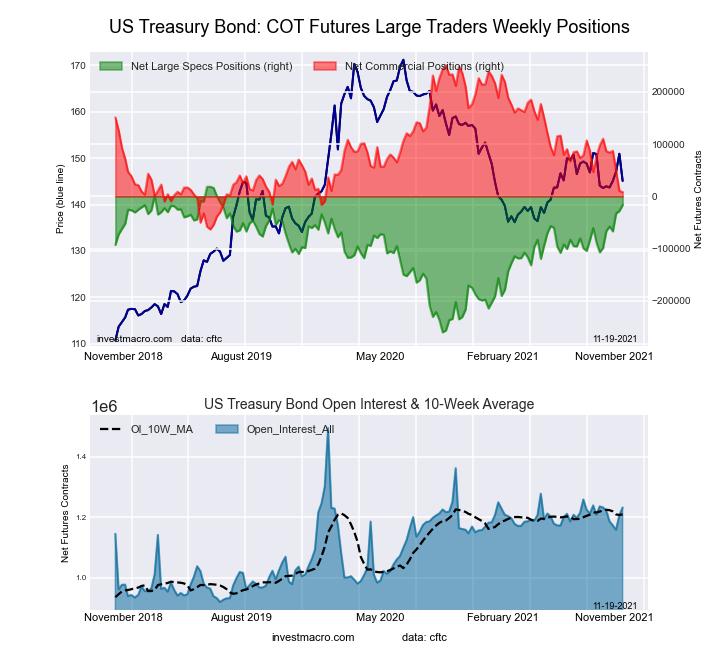
This week’s current strength score (the trader positioning range over the past three years, measured from 0 to 100) shows the speculators are currently Bullish-Extreme with a score of 87.5 percent. The commercials are Bearish with a score of 22.8 percent and the small traders (not shown in chart) are Bullish with a score of 59.0 percent.
| US Treasury Bonds Statistics | SPECULATORS | COMMERCIALS | SMALL TRADERS |
| – Percent of Open Interest Longs: | 11.8 | 69.6 | 16.0 |
| – Percent of Open Interest Shorts: | 13.1 | 68.9 | 15.4 |
| – Net Position: | -16,368 | 8,293 | 8,075 |
| – Gross Longs: | 144,973 | 857,612 | 197,253 |
| – Gross Shorts: | 161,341 | 849,319 | 189,178 |
| – Long to Short Ratio: | 0.9 to 1 | 1.0 to 1 | 1.0 to 1 |
| NET POSITION TREND: | |||
| – COT Index Score (3 Year Range Pct): | 87.5 | 22.8 | 59.0 |
| – COT Index Reading (3 Year Range): | Bullish-Extreme | Bearish | Bullish |
| NET POSITION MOVEMENT INDEX: | |||
| – 6-Week Change in Strength Index: | 29.6 | -32.4 | 15.4 |
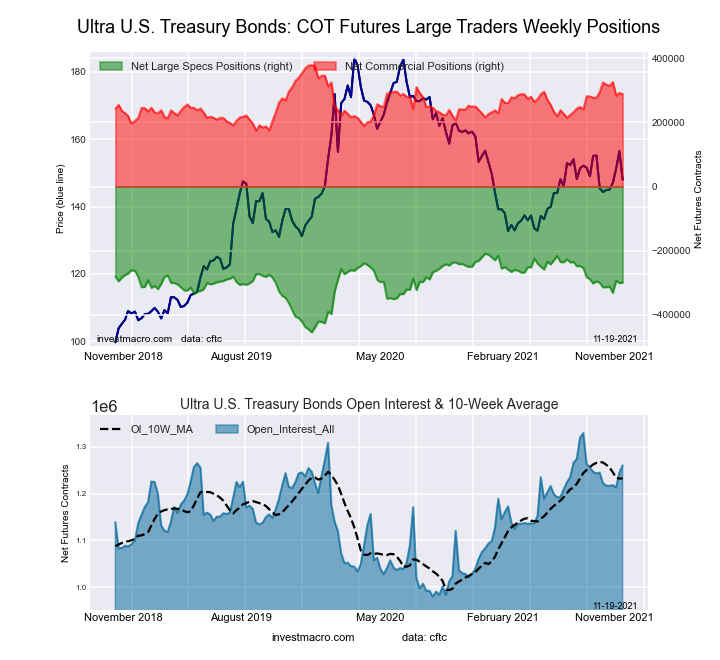
This week’s current strength score (the trader positioning range over the past three years, measured from 0 to 100) shows the speculators are currently Bullish with a score of 63.3 percent. The commercials are Bullish with a score of 55.9 percent and the small traders (not shown in chart) are Bearish with a score of 36.1 percent.
| Ultra US Treasury Bonds Statistics | SPECULATORS | COMMERCIALS | SMALL TRADERS |
| – Percent of Open Interest Longs: | 5.9 | 80.4 | 12.4 |
| – Percent of Open Interest Shorts: | 29.6 | 57.5 | 11.6 |
| – Net Position: | -298,879 | 287,988 | 10,891 |
| – Gross Longs: | 74,179 | 1,012,845 | 156,624 |
| – Gross Shorts: | 373,058 | 724,857 | 145,733 |
| – Long to Short Ratio: | 0.2 to 1 | 1.4 to 1 | 1.1 to 1 |
| NET POSITION TREND: | |||
| – COT Index Score (3 Year Range Pct): | 63.3 | 55.9 | 36.1 |
| – COT Index Reading (3 Year Range): | Bullish | Bullish | Bearish |
| NET POSITION MOVEMENT INDEX: | |||
| – 6-Week Change in Strength Index: | 6.0 | -17.7 | 15.4 |
Article By InvestMacro – Receive our weekly COT Reports by Email
*COT Report: The COT data, released weekly to the public each Friday, is updated through the most recent Tuesday (data is 3 days old) and shows a quick view of how large speculators or non-commercials (for-profit traders) were positioned in the futures markets.
The CFTC categorizes trader positions according to commercial hedgers (traders who use futures contracts for hedging as part of the business), non-commercials (large traders who speculate to realize trading profits) and nonreportable traders (usually small traders/speculators) as well as their open interest (contracts open in the market at time of reporting).See CFTC criteria here.
By Analytical Department RoboForex Gold fell to 4,033 USD per ounce on Thursday, extending its…
By JustMarkets By the end of the day, the Dow Jones Index (US30) rose by…
By JustMarkets On Tuesday, the US stock indices finished the session in the green, supported…
By Analytical Department RoboForex GBP/USD rose to 1.3403 on Wednesday, with British politics taking centre…
By Analytical Department RoboForex USD/JPY ended Tuesday at 162.27, with the Japanese yen remaining near…
By JustMarkets On Friday, the Dow Jones Index (US30) rose by 0.29% (weekly: -0.36%). The…
This website uses cookies.