By InvestMacro.com COT Home | Data Tables | Data Downloads | Newsletter
Here are the latest charts and statistics for the Commitment of Traders (COT) data published by the Commodities Futures Trading Commission (CFTC).
The latest COT data is updated through Tuesday September 28th 2021 and shows a quick view of how large traders (for-profit speculators and commercial entities) were positioned in the futures markets.
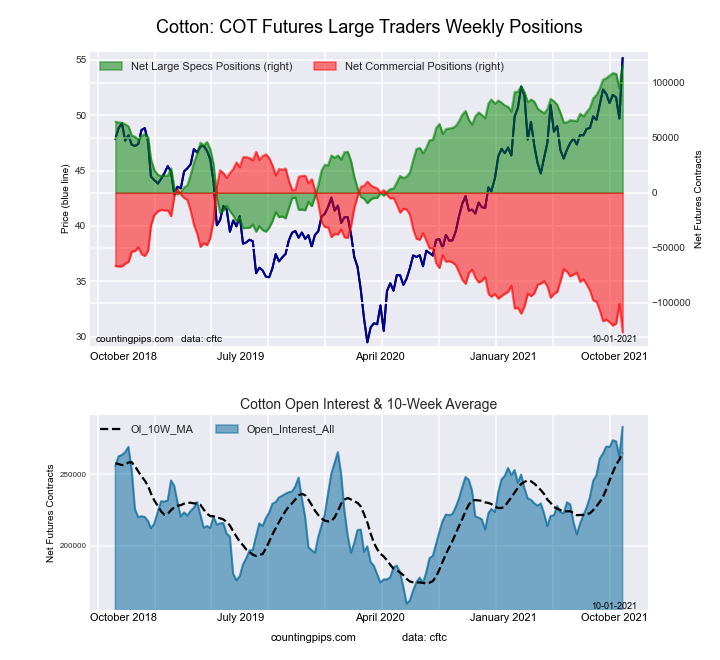
Highlighting this week’s speculator positioning is a new 3-year high net bullish position in Cotton. Speculators have added to their Cotton bullish bets to highest level since June 12th of 2018 when specs had a total bullish net position of +122,946 contracts. The strength index score for Cotton is also at a 100 percent score, indicating the highest level of bullish spec interest over the past three-year range.
This week’s current strength score (the trader positioning range over the past three years, measured from 0 to 100) shows the speculators are currently Bullish-Extreme with a score of 100.0 percent. The commercials are Bearish-Extreme with a score of 0.0 percent and the small traders (not shown in chart) are Bullish-Extreme with a score of 81.8 percent.
Free Reports:
| COTTON Futures Statistics | SPECULATORS | COMMERCIALS | SMALL TRADERS |
| – Percent of Open Interest Longs: | 45.3 | 33.8 | 7.2 |
| – Percent of Open Interest Shorts: | 4.4 | 78.6 | 3.4 |
| – Net Position: | 116,132 | -127,066 | 10,934 |
| – Gross Longs: | 128,487 | 95,758 | 20,525 |
| – Gross Shorts: | 12,355 | 222,824 | 9,591 |
| – Long to Short Ratio: | 10.4 to 1 | 0.4 to 1 | 2.1 to 1 |
| NET POSITION TREND: | |||
| – COT Index Score (3 Year Range Pct): | 100.0 | 0.0 | 81.8 |
| – COT Index Reading (3 Year Range): | Bullish-Extreme | Bearish-Extreme | Bullish-Extreme |
| NET POSITION MOVEMENT INDEX: | |||
| – 6-Week Change in Strength Index: | 8.6 | -6.2 | -18.2 |
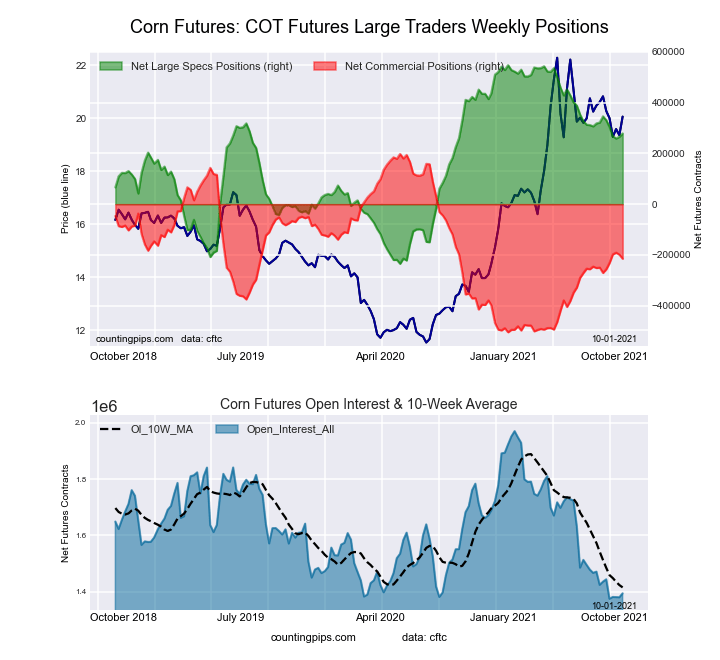
This week’s current strength score (the trader positioning range over the past three years, measured from 0 to 100) shows the speculators are currently Bullish with a score of 65.6 percent. The commercials are Bearish with a score of 41.3 percent and the small traders (not shown in chart) are Bearish-Extreme with a score of 6.5 percent.
| CORN Futures Statistics | SPECULATORS | COMMERCIALS | SMALL TRADERS |
| – Percent of Open Interest Longs: | 27.7 | 49.4 | 8.6 |
| – Percent of Open Interest Shorts: | 7.7 | 64.9 | 13.2 |
| – Net Position: | 278,546 | -215,090 | -63,456 |
| – Gross Longs: | 386,177 | 688,955 | 120,051 |
| – Gross Shorts: | 107,631 | 904,045 | 183,507 |
| – Long to Short Ratio: | 3.6 to 1 | 0.8 to 1 | 0.7 to 1 |
| NET POSITION TREND: | |||
| – COT Index Score (3 Year Range Pct): | 65.6 | 41.3 | 6.5 |
| – COT Index Reading (3 Year Range): | Bullish | Bearish | Bearish-Extreme |
| NET POSITION MOVEMENT INDEX: | |||
| – 6-Week Change in Strength Index: | -8.6 | 8.0 | 6.5 |
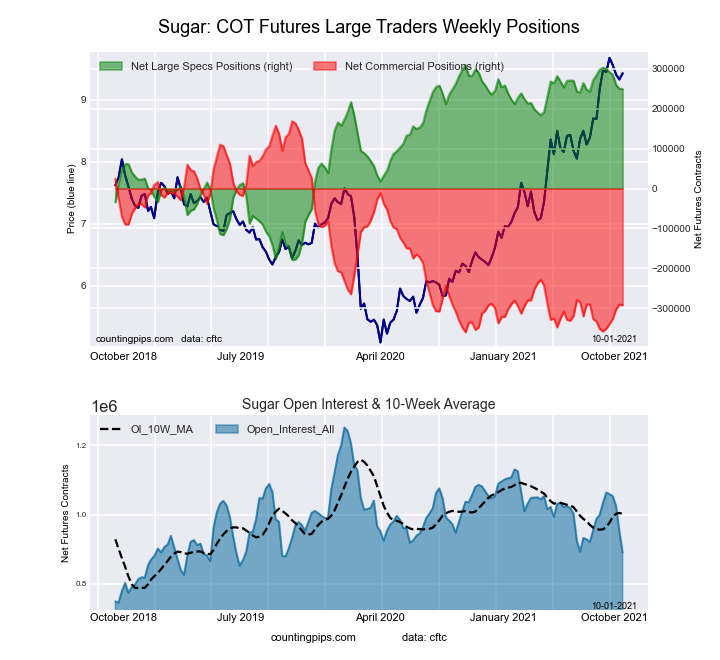
This week’s current strength score (the trader positioning range over the past three years, measured from 0 to 100) shows the speculators are currently Bullish-Extreme with a score of 87.8 percent. The commercials are Bearish-Extreme with a score of 12.9 percent and the small traders (not shown in chart) are Bullish with a score of 60.8 percent.
| SUGAR Futures Statistics | SPECULATORS | COMMERCIALS | SMALL TRADERS |
| – Percent of Open Interest Longs: | 33.4 | 43.0 | 9.5 |
| – Percent of Open Interest Shorts: | 5.4 | 75.8 | 4.7 |
| – Net Position: | 248,915 | -291,724 | 42,809 |
| – Gross Longs: | 297,099 | 382,907 | 84,947 |
| – Gross Shorts: | 48,184 | 674,631 | 42,138 |
| – Long to Short Ratio: | 6.2 to 1 | 0.6 to 1 | 2.0 to 1 |
| NET POSITION TREND: | |||
| – COT Index Score (3 Year Range Pct): | 87.8 | 12.9 | 60.8 |
| – COT Index Reading (3 Year Range): | Bullish-Extreme | Bearish-Extreme | Bullish |
| NET POSITION MOVEMENT INDEX: | |||
| – 6-Week Change in Strength Index: | -11.0 | 12.4 | -15.2 |
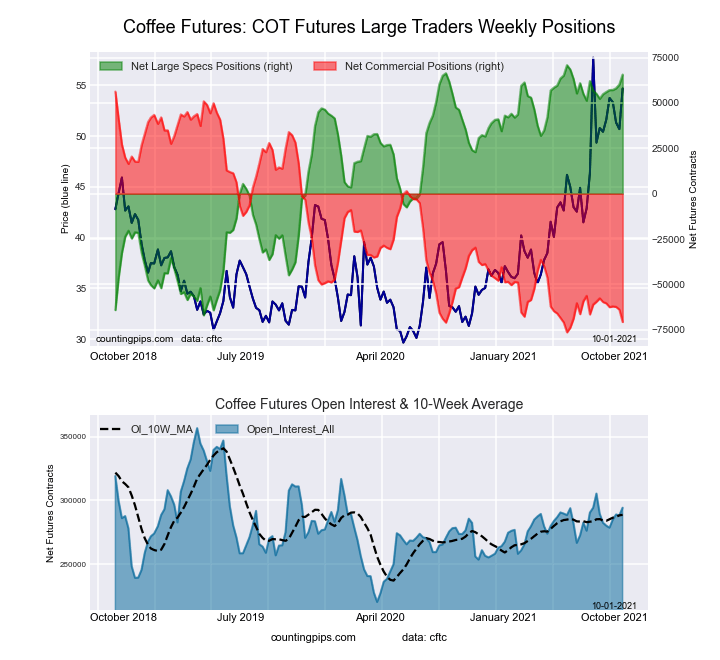
This week’s current strength score (the trader positioning range over the past three years, measured from 0 to 100) shows the speculators are currently Bullish-Extreme with a score of 96.2 percent. The commercials are Bearish-Extreme with a score of 4.3 percent and the small traders (not shown in chart) are Bearish with a score of 23.5 percent.
| COFFEE Futures Statistics | SPECULATORS | COMMERCIALS | SMALL TRADERS |
| – Percent of Open Interest Longs: | 28.0 | 41.8 | 3.9 |
| – Percent of Open Interest Shorts: | 5.7 | 65.9 | 2.2 |
| – Net Position: | 65,575 | -70,663 | 5,088 |
| – Gross Longs: | 82,278 | 123,137 | 11,533 |
| – Gross Shorts: | 16,703 | 193,800 | 6,445 |
| – Long to Short Ratio: | 4.9 to 1 | 0.6 to 1 | 1.8 to 1 |
| NET POSITION TREND: | |||
| – COT Index Score (3 Year Range Pct): | 96.2 | 4.3 | 23.5 |
| – COT Index Reading (3 Year Range): | Bullish-Extreme | Bearish-Extreme | Bearish |
| NET POSITION MOVEMENT INDEX: | |||
| – 6-Week Change in Strength Index: | 7.8 | -8.3 | 1.7 |
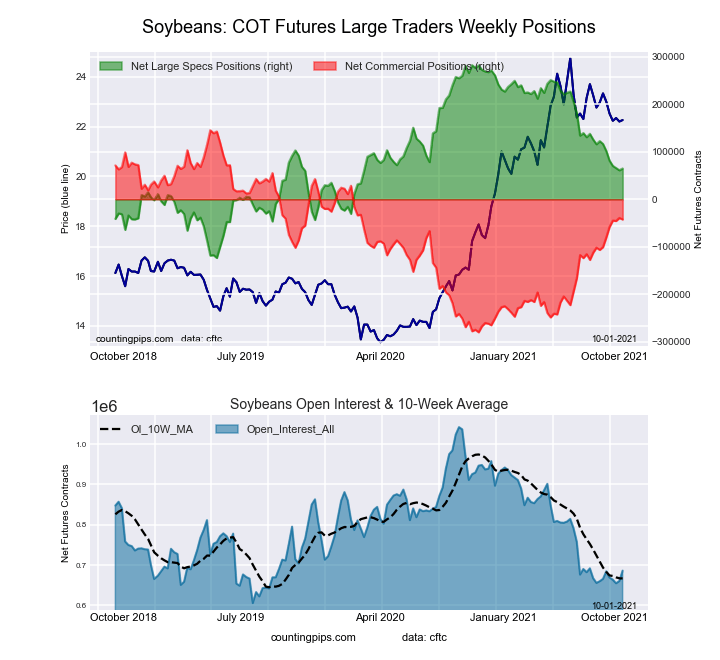
This week’s current strength score (the trader positioning range over the past three years, measured from 0 to 100) shows the speculators are currently Bearish with a score of 46.4 percent. The commercials are Bullish with a score of 55.8 percent and the small traders (not shown in chart) are Bearish with a score of 35.0 percent.
| SOYBEANS Futures Statistics | SPECULATORS | COMMERCIALS | SMALL TRADERS |
| – Percent of Open Interest Longs: | 20.6 | 56.9 | 7.1 |
| – Percent of Open Interest Shorts: | 11.1 | 63.1 | 10.4 |
| – Net Position: | 64,720 | -42,564 | -22,156 |
| – Gross Longs: | 141,105 | 390,372 | 49,015 |
| – Gross Shorts: | 76,385 | 432,936 | 71,171 |
| – Long to Short Ratio: | 1.8 to 1 | 0.9 to 1 | 0.7 to 1 |
| NET POSITION TREND: | |||
| – COT Index Score (3 Year Range Pct): | 46.4 | 55.8 | 35.0 |
| – COT Index Reading (3 Year Range): | Bearish | Bullish | Bearish |
| NET POSITION MOVEMENT INDEX: | |||
| – 6-Week Change in Strength Index: | -12.7 | 13.7 | -10.5 |
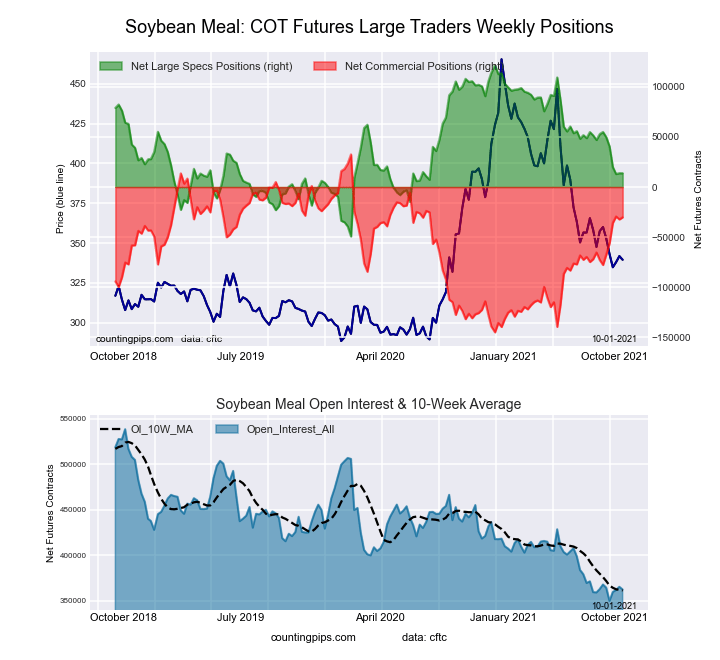
This week’s current strength score (the trader positioning range over the past three years, measured from 0 to 100) shows the speculators are currently Bearish with a score of 36.9 percent. The commercials are Bullish with a score of 64.6 percent and the small traders (not shown in chart) are Bearish with a score of 36.7 percent.
| SOYBEAN MEAL Futures Statistics | SPECULATORS | COMMERCIALS | SMALL TRADERS |
| – Percent of Open Interest Longs: | 21.5 | 49.1 | 12.2 |
| – Percent of Open Interest Shorts: | 17.7 | 57.4 | 7.6 |
| – Net Position: | 13,799 | -30,286 | 16,487 |
| – Gross Longs: | 77,998 | 177,632 | 44,078 |
| – Gross Shorts: | 64,199 | 207,918 | 27,591 |
| – Long to Short Ratio: | 1.2 to 1 | 0.9 to 1 | 1.6 to 1 |
| NET POSITION TREND: | |||
| – COT Index Score (3 Year Range Pct): | 36.9 | 64.6 | 36.7 |
| – COT Index Reading (3 Year Range): | Bearish | Bullish | Bearish |
| NET POSITION MOVEMENT INDEX: | |||
| – 6-Week Change in Strength Index: | -24.1 | 26.8 | -25.5 |
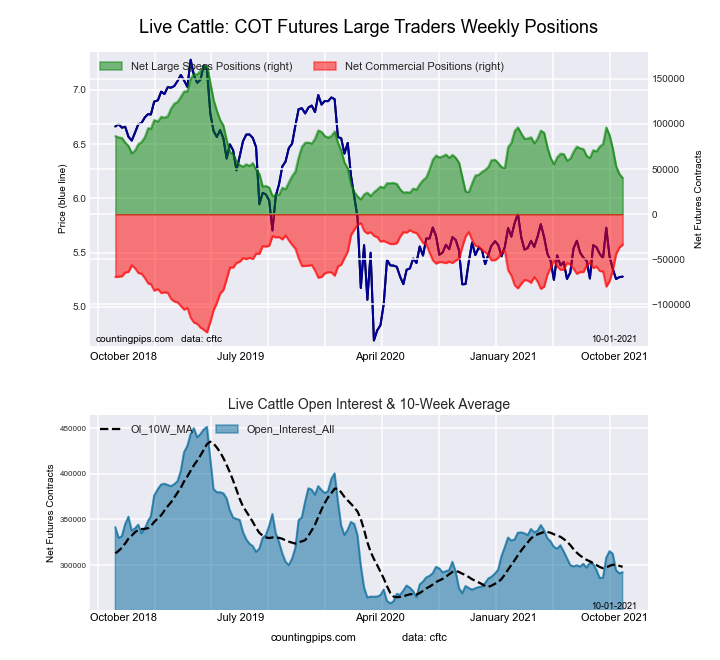
This week’s current strength score (the trader positioning range over the past three years, measured from 0 to 100) shows the speculators are currently Bearish-Extreme with a score of 16.0 percent. The commercials are Bullish-Extreme with a score of 80.2 percent and the small traders (not shown in chart) are Bullish with a score of 71.5 percent.
| LIVE CATTLE Futures Statistics | SPECULATORS | COMMERCIALS | SMALL TRADERS |
| – Percent of Open Interest Longs: | 31.7 | 43.5 | 10.6 |
| – Percent of Open Interest Shorts: | 17.9 | 55.1 | 12.8 |
| – Net Position: | 40,163 | -33,747 | -6,416 |
| – Gross Longs: | 92,493 | 127,134 | 31,023 |
| – Gross Shorts: | 52,330 | 160,881 | 37,439 |
| – Long to Short Ratio: | 1.8 to 1 | 0.8 to 1 | 0.8 to 1 |
| NET POSITION TREND: | |||
| – COT Index Score (3 Year Range Pct): | 16.0 | 80.2 | 71.5 |
| – COT Index Reading (3 Year Range): | Bearish-Extreme | Bullish-Extreme | Bullish |
| NET POSITION MOVEMENT INDEX: | |||
| – 6-Week Change in Strength Index: | -25.3 | 24.6 | 19.3 |
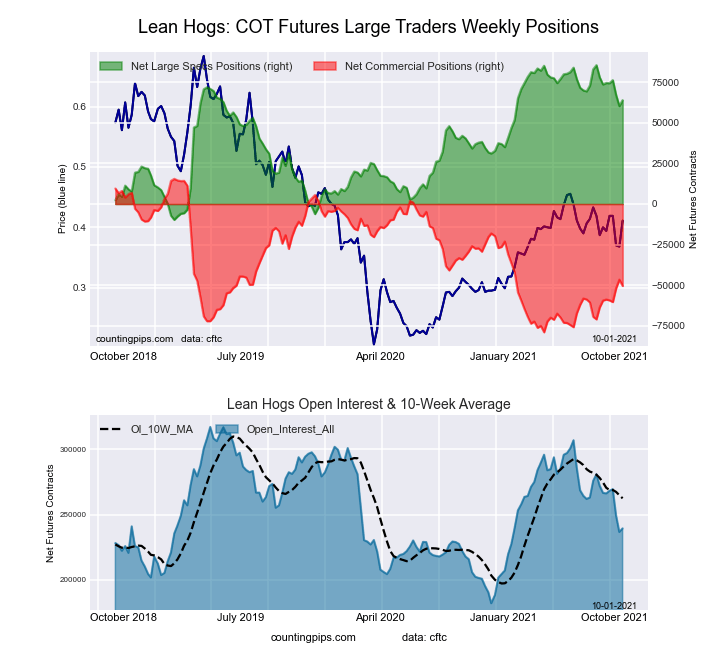
This week’s current strength score (the trader positioning range over the past three years, measured from 0 to 100) shows the speculators are currently Bullish with a score of 77.4 percent. The commercials are Bearish with a score of 30.2 percent and the small traders (not shown in chart) are Bearish-Extreme with a score of 14.0 percent.
| LEAN HOGS Futures Statistics | SPECULATORS | COMMERCIALS | SMALL TRADERS |
| – Percent of Open Interest Longs: | 42.4 | 32.1 | 7.8 |
| – Percent of Open Interest Shorts: | 15.6 | 53.2 | 13.4 |
| – Net Position: | 64,023 | -50,557 | -13,466 |
| – Gross Longs: | 101,460 | 76,873 | 18,690 |
| – Gross Shorts: | 37,437 | 127,430 | 32,156 |
| – Long to Short Ratio: | 2.7 to 1 | 0.6 to 1 | 0.6 to 1 |
| NET POSITION TREND: | |||
| – COT Index Score (3 Year Range Pct): | 77.4 | 30.2 | 14.0 |
| – COT Index Reading (3 Year Range): | Bullish | Bearish | Bearish-Extreme |
| NET POSITION MOVEMENT INDEX: | |||
| – 6-Week Change in Strength Index: | -10.2 | 9.5 | 3.2 |
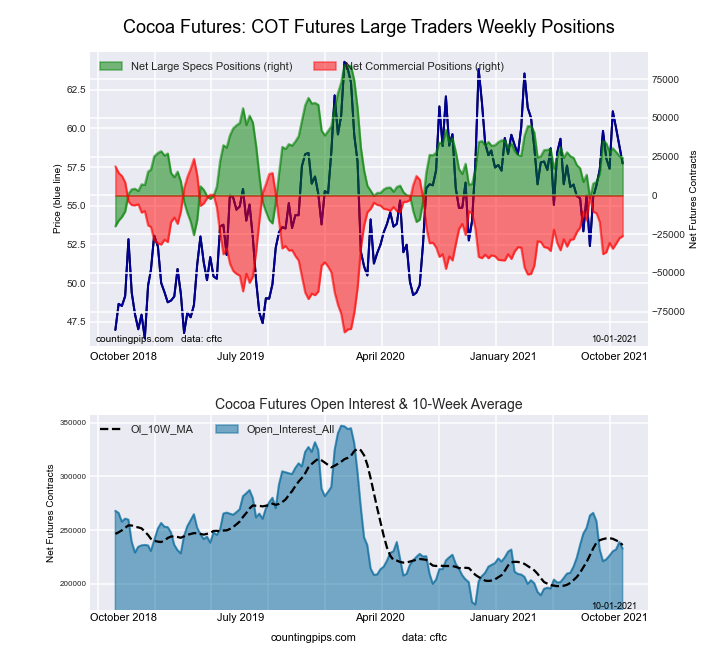
This week’s current strength score (the trader positioning range over the past three years, measured from 0 to 100) shows the speculators are currently Bearish with a score of 45.5 percent. The commercials are Bullish with a score of 55.5 percent and the small traders (not shown in chart) are Bearish with a score of 30.3 percent.
| COCOA Futures Statistics | SPECULATORS | COMMERCIALS | SMALL TRADERS |
| – Percent of Open Interest Longs: | 28.4 | 53.6 | 4.2 |
| – Percent of Open Interest Shorts: | 17.9 | 64.9 | 3.4 |
| – Net Position: | 24,276 | -26,194 | 1,918 |
| – Gross Longs: | 65,973 | 124,722 | 9,712 |
| – Gross Shorts: | 41,697 | 150,916 | 7,794 |
| – Long to Short Ratio: | 1.6 to 1 | 0.8 to 1 | 1.2 to 1 |
| NET POSITION TREND: | |||
| – COT Index Score (3 Year Range Pct): | 45.5 | 55.5 | 30.3 |
| – COT Index Reading (3 Year Range): | Bearish | Bullish | Bearish |
| NET POSITION MOVEMENT INDEX: | |||
| – 6-Week Change in Strength Index: | -10.0 | 10.4 | -8.0 |
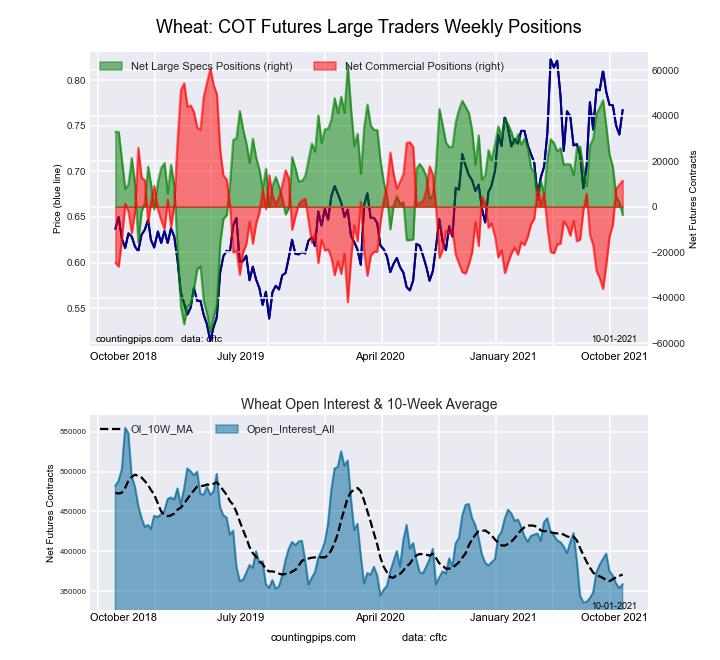
This week’s current strength score (the trader positioning range over the past three years, measured from 0 to 100) shows the speculators are currently Bearish with a score of 43.9 percent. The commercials are Bullish with a score of 52.0 percent and the small traders (not shown in chart) are Bullish with a score of 64.1 percent.
| WHEAT Futures Statistics | SPECULATORS | COMMERCIALS | SMALL TRADERS |
| – Percent of Open Interest Longs: | 23.7 | 44.1 | 8.4 |
| – Percent of Open Interest Shorts: | 24.7 | 40.9 | 10.6 |
| – Net Position: | -3,645 | 11,488 | -7,843 |
| – Gross Longs: | 84,860 | 158,150 | 30,206 |
| – Gross Shorts: | 88,505 | 146,662 | 38,049 |
| – Long to Short Ratio: | 1.0 to 1 | 1.1 to 1 | 0.8 to 1 |
| NET POSITION TREND: | |||
| – COT Index Score (3 Year Range Pct): | 43.9 | 52.0 | 64.1 |
| – COT Index Reading (3 Year Range): | Bearish | Bullish | Bullish |
| NET POSITION MOVEMENT INDEX: | |||
| – 6-Week Change in Strength Index: | -43.0 | 46.3 | 13.7 |
Article By InvestMacro.com – Receive our weekly COT Reports by Email
*COT Report: The COT data, released weekly to the public each Friday, is updated through the most recent Tuesday (data is 3 days old) and shows a quick view of how large speculators or non-commercials (for-profit traders) were positioned in the futures markets. Open interest indicates the number of currently open (at time of data collection) contracts still in the markets.
The CFTC categorizes trader positions according to commercial hedgers (traders who use futures contracts for hedging as part of the business), non-commercials (large traders who speculate to realize trading profits) and nonreportable traders (usually small traders/speculators).
Find CFTC criteria here: (http://www.cftc.gov/MarketReports/CommitmentsofTraders/ExplanatoryNotes/index.htm).
By InvestMacro Here are the latest charts and statistics for the Commitment of Traders (COT)…
By InvestMacro The latest update for the weekly Commitment of Traders (COT) report was released…
By InvestMacro Here are the latest charts and statistics for the Commitment of Traders (COT)…
By InvestMacro Here are the latest charts and statistics for the Commitment of Traders (COT)…
By InvestMacro Here are the latest charts and statistics for the Commitment of Traders (COT)…
By InvestMacro Here are the latest charts and statistics for the Commitment of Traders (COT)…
This website uses cookies.