By CountingPips.com COT Home | Data Tables | Data Downloads | Newsletter
Here are the latest charts and statistics for the Commitment of Traders (COT) data published by the Commodities Futures Trading Commission (CFTC).
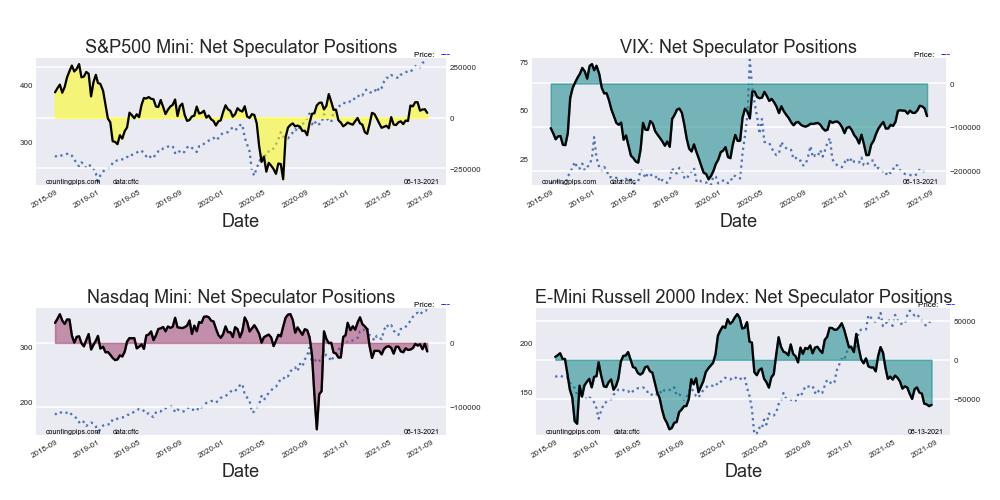
The latest COT data is updated through Tuesday August 10 2021 and shows a quick view of how large traders (for-profit speculators and commercial entities) were positioned in the futures markets.
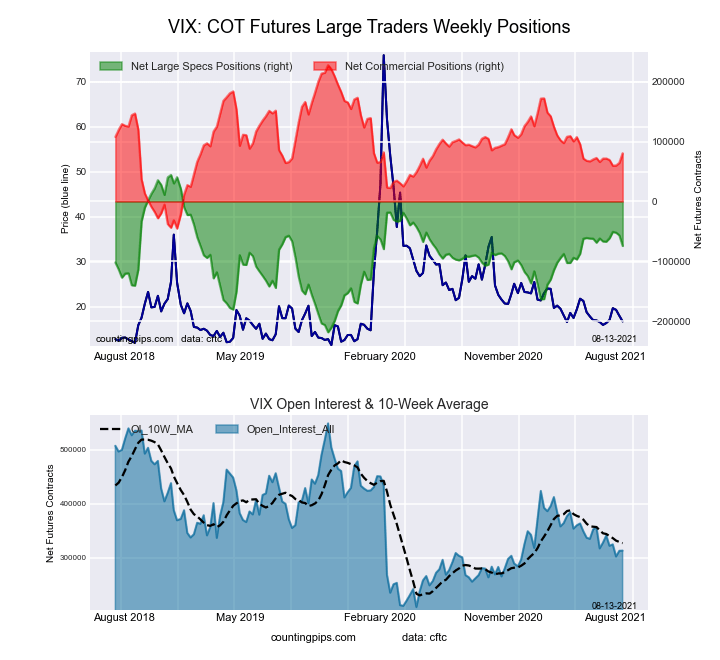
This week’s current strength score (the trader positioning range over the past three years, measured from 0 to 100) shows the speculators are currently Bullish with a score of 54.9 percent. The commercials are Bearish with a score of 46.1 percent and the small traders (not shown in chart) are Bearish with a score of 32.8 percent.
Free Reports:
| VIX Volatility Futures Statistics | SPECULATORS | COMMERCIALS | SMALL TRADERS |
| – Percent of Open Interest Longs: | 18.8 | 55.0 | 6.9 |
| – Percent of Open Interest Shorts: | 42.5 | 29.3 | 8.9 |
| – Net Position: | -74,251 | 80,481 | -6,230 |
| – Gross Longs: | 58,742 | 172,327 | 21,703 |
| – Gross Shorts: | 132,993 | 91,846 | 27,933 |
| – Long to Short Ratio: | 0.4 to 1 | 1.9 to 1 | 0.8 to 1 |
| NET POSITION TREND: | |||
| – COT Index Score (3 Year Range Pct): | 54.9 | 46.1 | 32.8 |
| – COT Index Reading (3 Year Range): | Bullish | Bearish | Bearish |
| NET POSITION MOVEMENT INDEX: | |||
| – 6-Week Change in Strength Index: | -2.9 | 3.3 | -5.4 |
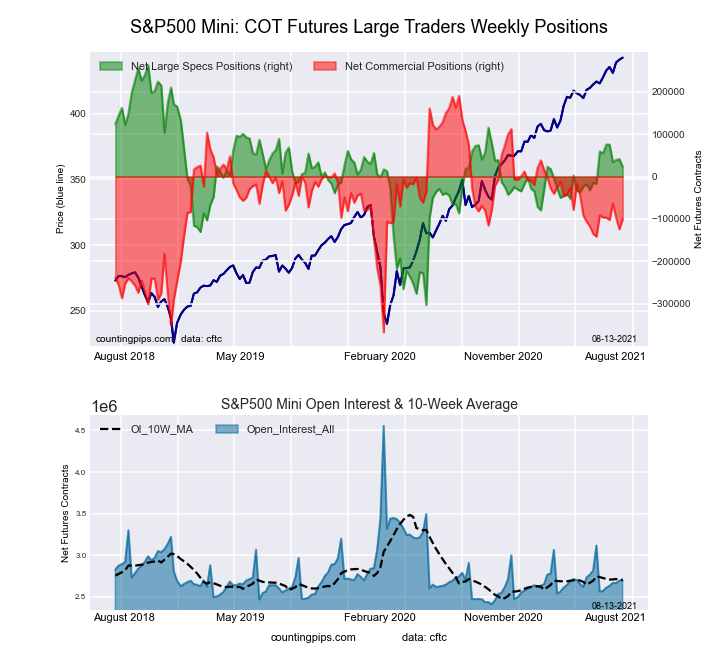
This week’s current strength score (the trader positioning range over the past three years, measured from 0 to 100) shows the speculators are currently Bullish with a score of 57.6 percent. The commercials are Bearish with a score of 47.9 percent and the small traders (not shown in chart) are Bearish with a score of 42.6 percent.
| S&P500 Mini Futures Statistics | SPECULATORS | COMMERCIALS | SMALL TRADERS |
| – Percent of Open Interest Longs: | 16.3 | 68.2 | 12.1 |
| – Percent of Open Interest Shorts: | 15.4 | 71.9 | 9.3 |
| – Net Position: | 23,111 | -100,445 | 77,334 |
| – Gross Longs: | 438,866 | 1,839,250 | 327,602 |
| – Gross Shorts: | 415,755 | 1,939,695 | 250,268 |
| – Long to Short Ratio: | 1.1 to 1 | 0.9 to 1 | 1.3 to 1 |
| NET POSITION TREND: | |||
| – COT Index Score (3 Year Range Pct): | 57.6 | 47.9 | 42.6 |
| – COT Index Reading (3 Year Range): | Bullish | Bearish | Bearish |
| NET POSITION MOVEMENT INDEX: | |||
| – 6-Week Change in Strength Index: | -5.7 | -0.7 | 7.5 |
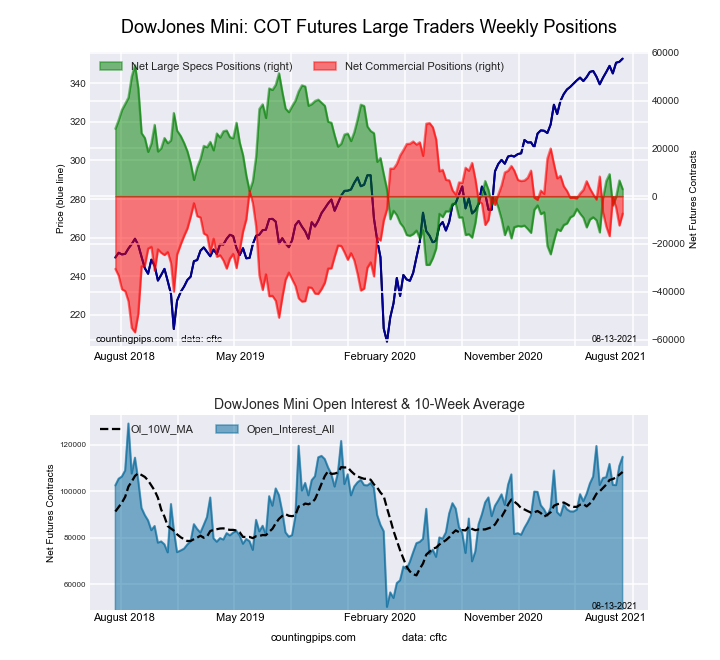
This week’s current strength score (the trader positioning range over the past three years, measured from 0 to 100) shows the speculators are currently Bearish with a score of 37.9 percent. The commercials are Bullish with a score of 56.7 percent and the small traders (not shown in chart) are Bullish with a score of 62.1 percent.
| Dow Jones Mini Futures Statistics | SPECULATORS | COMMERCIALS | SMALL TRADERS |
| – Percent of Open Interest Longs: | 40.9 | 41.4 | 15.3 |
| – Percent of Open Interest Shorts: | 38.3 | 47.7 | 11.5 |
| – Net Position: | 2,888 | -7,310 | 4,422 |
| – Gross Longs: | 46,893 | 47,483 | 17,584 |
| – Gross Shorts: | 44,005 | 54,793 | 13,162 |
| – Long to Short Ratio: | 1.1 to 1 | 0.9 to 1 | 1.3 to 1 |
| NET POSITION TREND: | |||
| – COT Index Score (3 Year Range Pct): | 37.9 | 56.7 | 62.1 |
| – COT Index Reading (3 Year Range): | Bearish | Bullish | Bullish |
| NET POSITION MOVEMENT INDEX: | |||
| – 6-Week Change in Strength Index: | 4.4 | -0.5 | -17.3 |
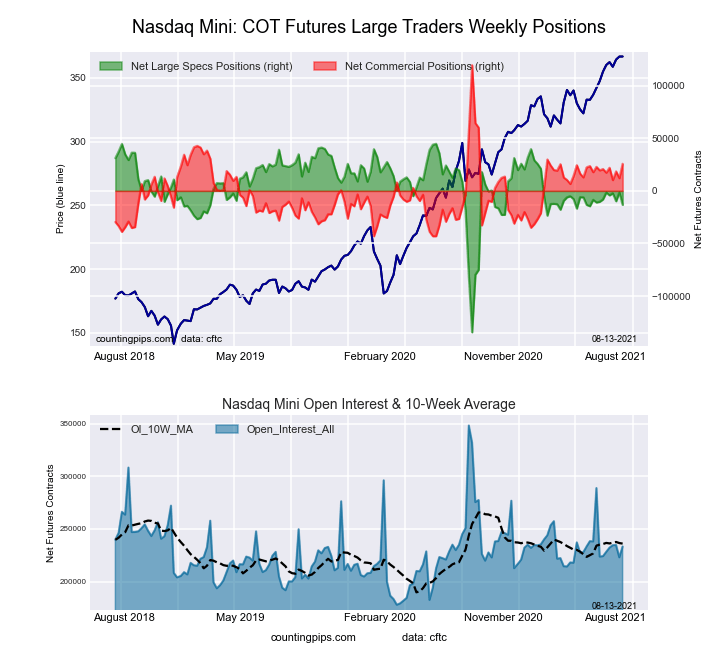
This week’s current strength score (the trader positioning range over the past three years, measured from 0 to 100) shows the speculators are currently Bullish with a score of 67.6 percent. The commercials are Bearish with a score of 42.3 percent and the small traders (not shown in chart) are Bearish-Extreme with a score of 16.1 percent.
| Nasdaq Mini Futures Statistics | SPECULATORS | COMMERCIALS | SMALL TRADERS |
| – Percent of Open Interest Longs: | 25.1 | 57.2 | 14.6 |
| – Percent of Open Interest Shorts: | 30.8 | 46.2 | 19.9 |
| – Net Position: | -13,269 | 25,706 | -12,437 |
| – Gross Longs: | 58,502 | 133,533 | 34,086 |
| – Gross Shorts: | 71,771 | 107,827 | 46,523 |
| – Long to Short Ratio: | 0.8 to 1 | 1.2 to 1 | 0.7 to 1 |
| NET POSITION TREND: | |||
| – COT Index Score (3 Year Range Pct): | 67.6 | 42.3 | 16.1 |
| – COT Index Reading (3 Year Range): | Bullish | Bearish | Bearish-Extreme |
| NET POSITION MOVEMENT INDEX: | |||
| – 6-Week Change in Strength Index: | -2.9 | 3.1 | 0.4 |
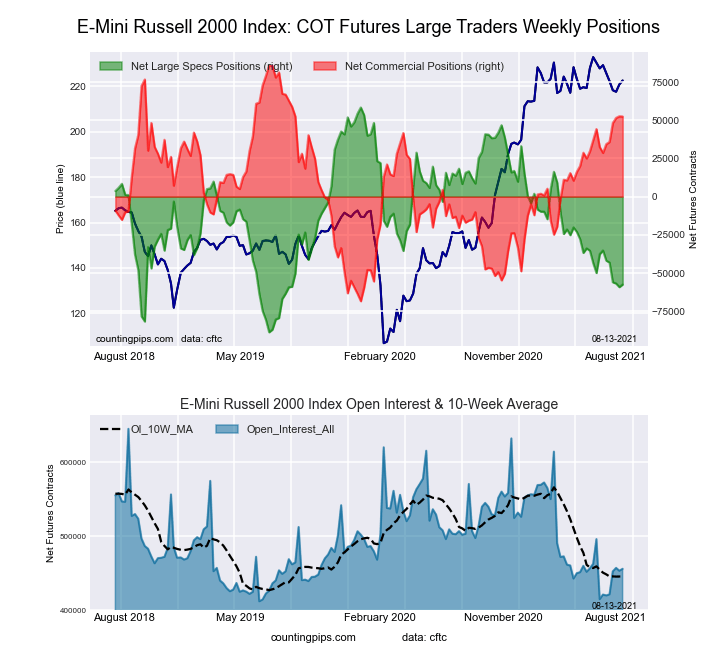
This week’s current strength score (the trader positioning range over the past three years, measured from 0 to 100) shows the speculators are currently Bearish with a score of 21.2 percent. The commercials are Bullish with a score of 78.3 percent and the small traders (not shown in chart) are Bearish with a score of 47.4 percent.
| Russell 2000 Mini Futures Statistics | SPECULATORS | COMMERCIALS | SMALL TRADERS |
| – Percent of Open Interest Longs: | 13.8 | 79.1 | 6.0 |
| – Percent of Open Interest Shorts: | 26.4 | 67.6 | 4.9 |
| – Net Position: | -57,535 | 52,438 | 5,097 |
| – Gross Longs: | 62,990 | 360,431 | 27,283 |
| – Gross Shorts: | 120,525 | 307,993 | 22,186 |
| – Long to Short Ratio: | 0.5 to 1 | 1.2 to 1 | 1.2 to 1 |
| NET POSITION TREND: | |||
| – COT Index Score (3 Year Range Pct): | 21.2 | 78.3 | 47.4 |
| – COT Index Reading (3 Year Range): | Bearish | Bullish | Bearish |
| NET POSITION MOVEMENT INDEX: | |||
| – 6-Week Change in Strength Index: | -15.2 | 15.4 | -4.3 |
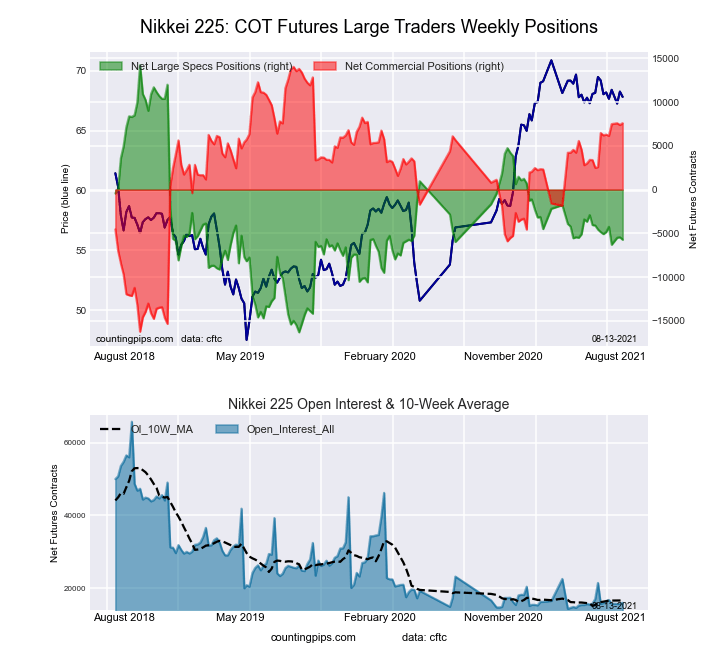
This week’s current strength score (the trader positioning range over the past three years, measured from 0 to 100) shows the speculators are currently Bearish with a score of 34.7 percent. The commercials are Bullish with a score of 78.7 percent and the small traders (not shown in chart) are Bearish-Extreme with a score of 2.5 percent.
| Nikkei Stock Average Futures Statistics | SPECULATORS | COMMERCIALS | SMALL TRADERS |
| – Percent of Open Interest Longs: | 14.5 | 62.4 | 23.1 |
| – Percent of Open Interest Shorts: | 50.2 | 15.0 | 34.8 |
| – Net Position: | -5,722 | 7,588 | -1,866 |
| – Gross Longs: | 2,314 | 9,987 | 3,704 |
| – Gross Shorts: | 8,036 | 2,399 | 5,570 |
| – Long to Short Ratio: | 0.3 to 1 | 4.2 to 1 | 0.7 to 1 |
| NET POSITION TREND: | |||
| – COT Index Score (3 Year Range Pct): | 34.7 | 78.7 | 2.5 |
| – COT Index Reading (3 Year Range): | Bearish | Bullish | Bearish-Extreme |
| NET POSITION MOVEMENT INDEX: | |||
| – 6-Week Change in Strength Index: | -2.1 | 4.6 | -8.3 |
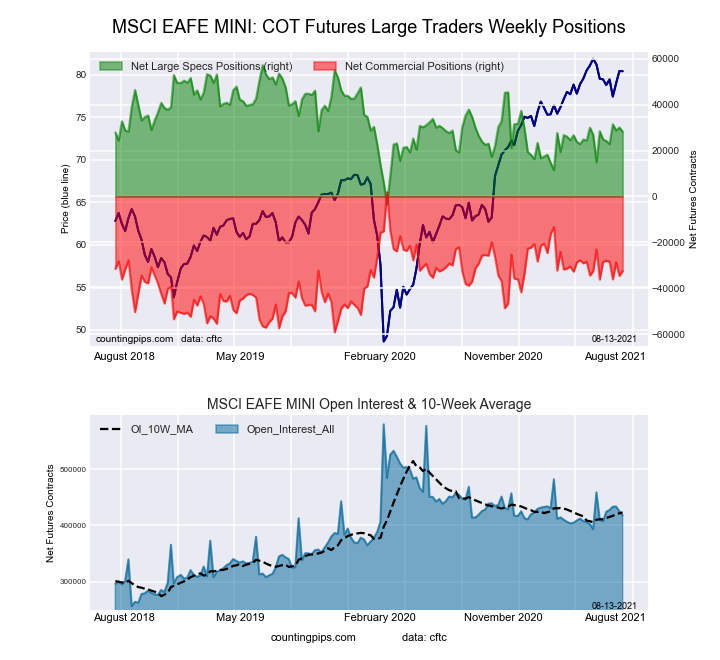
This week’s current strength score (the trader positioning range over the past three years, measured from 0 to 100) shows the speculators are currently Bullish with a score of 52.2 percent. The commercials are Bearish with a score of 43.7 percent and the small traders (not shown in chart) are Bullish with a score of 54.9 percent.
| MSCI EAFE Mini Futures Statistics | SPECULATORS | COMMERCIALS | SMALL TRADERS |
| – Percent of Open Interest Longs: | 10.2 | 87.0 | 2.5 |
| – Percent of Open Interest Shorts: | 3.5 | 94.8 | 1.4 |
| – Net Position: | 28,200 | -32,497 | 4,297 |
| – Gross Longs: | 42,623 | 363,434 | 10,247 |
| – Gross Shorts: | 14,423 | 395,931 | 5,950 |
| – Long to Short Ratio: | 3.0 to 1 | 0.9 to 1 | 1.7 to 1 |
| NET POSITION TREND: | |||
| – COT Index Score (3 Year Range Pct): | 52.2 | 43.7 | 54.9 |
| – COT Index Reading (3 Year Range): | Bullish | Bearish | Bullish |
| NET POSITION MOVEMENT INDEX: | |||
| – 6-Week Change in Strength Index: | 5.5 | -6.5 | 5.9 |
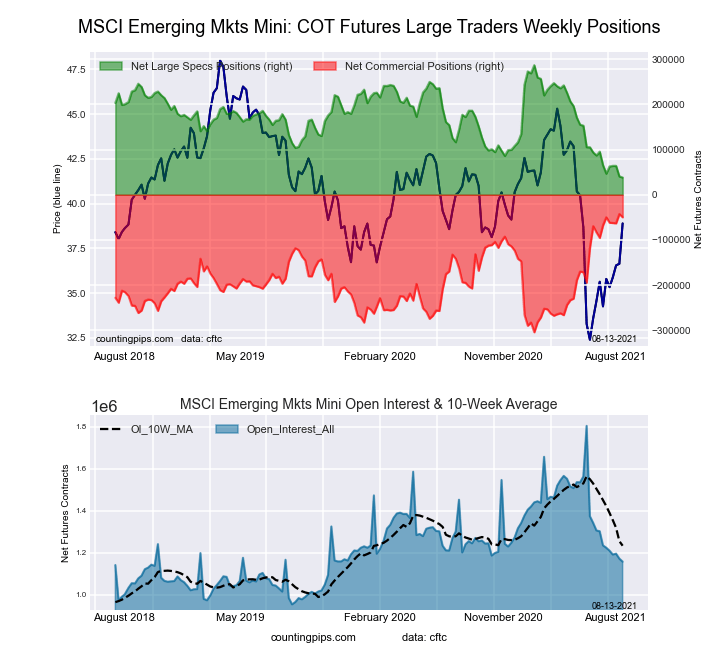
This week’s current strength score (the trader positioning range over the past three years, measured from 0 to 100) shows the speculators are currently Bearish-Extreme with a score of 0.0 percent. The commercials are Bullish-Extreme with a score of 97.2 percent and the small traders (not shown in chart) are Bearish with a score of 40.4 percent.
| MSCI Emerging Mkts Mini Futures Statistics | SPECULATORS | COMMERCIALS | SMALL TRADERS |
| – Percent of Open Interest Longs: | 14.3 | 82.2 | 2.4 |
| – Percent of Open Interest Shorts: | 11.0 | 86.5 | 1.3 |
| – Net Position: | 38,211 | -49,886 | 11,675 |
| – Gross Longs: | 165,150 | 950,685 | 27,250 |
| – Gross Shorts: | 126,939 | 1,000,571 | 15,575 |
| – Long to Short Ratio: | 1.3 to 1 | 1.0 to 1 | 1.7 to 1 |
| NET POSITION TREND: | |||
| – COT Index Score (3 Year Range Pct): | 0.0 | 97.2 | 40.4 |
| – COT Index Reading (3 Year Range): | Bearish-Extreme | Bullish-Extreme | Bearish |
| NET POSITION MOVEMENT INDEX: | |||
| – 6-Week Change in Strength Index: | -11.0 | 6.8 | 7.3 |
Article By CountingPips.com – Receive our weekly COT Reports by Email
*COT Report: The COT data, released weekly to the public each Friday, is updated through the most recent Tuesday (data is 3 days old) and shows a quick view of how large speculators or non-commercials (for-profit traders) were positioned in the futures markets.
The CFTC categorizes trader positions according to commercial hedgers (traders who use futures contracts for hedging as part of the business), non-commercials (large traders who speculate to realize trading profits) and nonreportable traders (usually small traders/speculators).
Find CFTC criteria here: (http://www.cftc.gov/MarketReports/CommitmentsofTraders/ExplanatoryNotes/index.htm).
By InvestMacro Here are the latest charts and statistics for the Commitment of Traders (COT)…
By InvestMacro The latest update for the weekly Commitment of Traders (COT) report was released…
By InvestMacro Here are the latest charts and statistics for the Commitment of Traders (COT)…
By InvestMacro Here are the latest charts and statistics for the Commitment of Traders (COT)…
By InvestMacro Here are the latest charts and statistics for the Commitment of Traders (COT)…
By InvestMacro Here are the latest charts and statistics for the Commitment of Traders (COT)…
This website uses cookies.