By CountingPips.com COT Home | Data Tables | Data Downloads | Newsletter
Here are the latest charts and statistics for the Commitment of Traders (COT) data published by the Commodities Futures Trading Commission (CFTC).
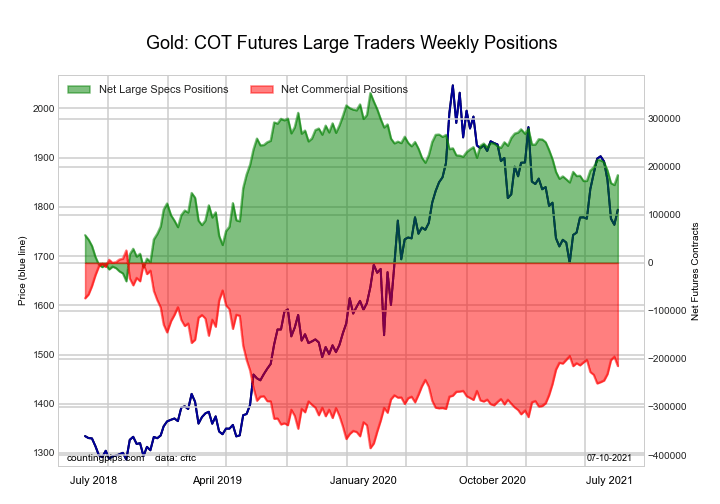
The latest COT data is updated through Tuesday July 6th 2021 and shows a quick view of how large traders (for-profit speculators and commercial entities) were positioned in the futures markets.
This week’s current strength score (the trader positioning range over the past three years, measured from 0 to 100) shows the speculators are currently Bullish with a score of 56.4 percent. The commercials are Bearish with a score of 41.5 percent and the small traders (not shown in chart) are Bullish with a score of 61.0 percent.
| Gold Futures Statistics | SPECULATORS | COMMERCIALS | SMALL TRADERS |
| – Percent of Open Interest Longs: | 58.1 | 23.1 | 10.7 |
| – Percent of Open Interest Shorts: | 18.8 | 69.2 | 3.9 |
| – Net Position: | 182,821 | -214,726 | 31,905 |
| – Gross Longs: | 270,545 | 107,675 | 49,928 |
| – Gross Shorts: | 87,724 | 322,401 | 18,023 |
| – Long to Short Ratio: | 3.1 to 1 | 0.3 to 1 | 2.8 to 1 |
| NET POSITION TREND: | |||
| – COT Index Score (3 Year Range Pct): | 56.4 | 41.5 | 61.0 |
| – COT Index Reading (3 Year Range): | Bullish | Bearish | Bullish |
| NET POSITION MOVEMENT INDEX: | |||
| – 6-Week Change in Strength Index: | -8.1 | 8.8 | -10.6 |
Free Reports:
This week’s current strength score (the trader positioning range over the past three years, measured from 0 to 100) shows the speculators are currently Bullish with a score of 68.8 percent. The commercials are Bearish with a score of 32.7 percent and the small traders (not shown in chart) are Bearish with a score of 49.4 percent.
| Silver Futures Statistics | SPECULATORS | COMMERCIALS | SMALL TRADERS |
| – Percent of Open Interest Longs: | 48.8 | 27.9 | 17.9 |
| – Percent of Open Interest Shorts: | 20.5 | 68.1 | 6.0 |
| – Net Position: | 44,488 | -63,097 | 18,609 |
| – Gross Longs: | 76,790 | 43,915 | 28,067 |
| – Gross Shorts: | 32,302 | 107,012 | 9,458 |
| – Long to Short Ratio: | 2.4 to 1 | 0.4 to 1 | 3.0 to 1 |
| NET POSITION TREND: | |||
| – COT Index Score (3 Year Range Pct): | 68.8 | 32.7 | 49.4 |
| – COT Index Reading (3 Year Range): | Bullish | Bearish | Bearish |
| NET POSITION MOVEMENT INDEX: | |||
| – 6-Week Change in Strength Index: | -5.6 | 8.0 | -19.2 |
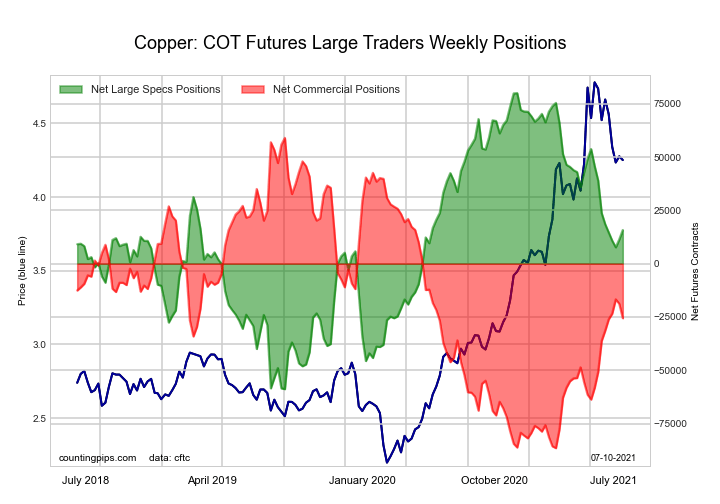
This week’s current strength score (the trader positioning range over the past three years, measured from 0 to 100) shows the speculators are currently Bullish with a score of 53.7 percent. The commercials are Bearish with a score of 41.9 percent and the small traders (not shown in chart) are Bullish-Extreme with a score of 82.0 percent.
| Copper Futures Statistics | SPECULATORS | COMMERCIALS | SMALL TRADERS |
| – Percent of Open Interest Longs: | 41.6 | 37.4 | 10.6 |
| – Percent of Open Interest Shorts: | 33.8 | 50.0 | 5.8 |
| – Net Position: | 15,773 | -25,582 | 9,809 |
| – Gross Longs: | 84,324 | 75,804 | 21,489 |
| – Gross Shorts: | 68,551 | 101,386 | 11,680 |
| – Long to Short Ratio: | 1.2 to 1 | 0.7 to 1 | 1.8 to 1 |
| NET POSITION TREND: | |||
| – COT Index Score (3 Year Range Pct): | 53.7 | 41.9 | 82.0 |
| – COT Index Reading (3 Year Range): | Bullish | Bearish | Bullish-Extreme |
| NET POSITION MOVEMENT INDEX: | |||
| – 6-Week Change in Strength Index: | -5.7 | 7.3 | -15.5 |
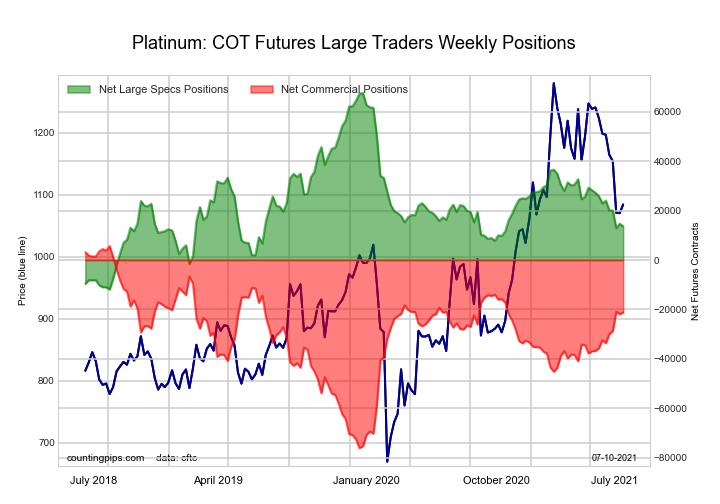
This week’s current strength score (the trader positioning range over the past three years, measured from 0 to 100) shows the speculators are currently Bearish with a score of 32.1 percent. The commercials are Bullish with a score of 67.2 percent and the small traders (not shown in chart) are Bullish with a score of 68.2 percent.
| Platinum Futures Statistics | SPECULATORS | COMMERCIALS | SMALL TRADERS |
| – Percent of Open Interest Longs: | 51.2 | 28.5 | 18.0 |
| – Percent of Open Interest Shorts: | 26.7 | 66.7 | 4.3 |
| – Net Position: | 13,576 | -21,181 | 7,605 |
| – Gross Longs: | 28,390 | 15,797 | 9,993 |
| – Gross Shorts: | 14,814 | 36,978 | 2,388 |
| – Long to Short Ratio: | 1.9 to 1 | 0.4 to 1 | 4.2 to 1 |
| NET POSITION TREND: | |||
| – COT Index Score (3 Year Range Pct): | 32.1 | 67.2 | 68.2 |
| – COT Index Reading (3 Year Range): | Bearish | Bullish | Bullish |
| NET POSITION MOVEMENT INDEX: | |||
| – 6-Week Change in Strength Index: | -11.8 | 13.7 | -25.6 |
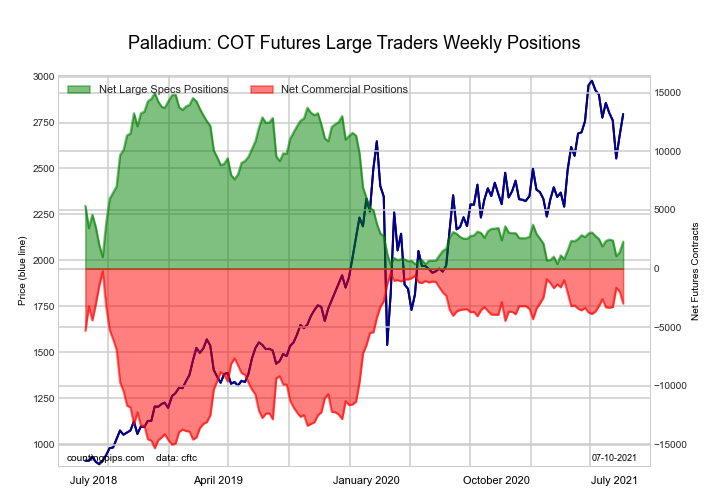
This week’s current strength score (the trader positioning range over the past three years, measured from 0 to 100) shows the speculators are currently Bearish-Extreme with a score of 13.7 percent. The commercials are Bullish-Extreme with a score of 81.7 percent and the small traders (not shown in chart) are Bullish-Extreme with a score of 84.4 percent.
| Palladium Futures Statistics | SPECULATORS | COMMERCIALS | SMALL TRADERS |
| – Percent of Open Interest Longs: | 52.7 | 30.0 | 15.0 |
| – Percent of Open Interest Shorts: | 30.0 | 59.4 | 8.4 |
| – Net Position: | 2,303 | -2,976 | 673 |
| – Gross Longs: | 5,334 | 3,030 | 1,518 |
| – Gross Shorts: | 3,031 | 6,006 | 845 |
| – Long to Short Ratio: | 1.8 to 1 | 0.5 to 1 | 1.8 to 1 |
| NET POSITION TREND: | |||
| – COT Index Score (3 Year Range Pct): | 13.7 | 81.7 | 84.4 |
| – COT Index Reading (3 Year Range): | Bearish-Extreme | Bullish-Extreme | Bullish-Extreme |
| NET POSITION MOVEMENT INDEX: | |||
| – 6-Week Change in Strength Index: | 2.8 | -2.5 | -1.9 |
Article By CountingPips.com – Receive our weekly COT Reports by Email
*COT Report: The COT data, released weekly to the public each Friday, is updated through the most recent Tuesday (data is 3 days old) and shows a quick view of how large speculators or non-commercials (for-profit traders) were positioned in the futures markets.
The CFTC categorizes trader positions according to commercial hedgers (traders who use futures contracts for hedging as part of the business), non-commercials (large traders who speculate to realize trading profits) and nonreportable traders (usually small traders/speculators).
Find CFTC criteria here: (http://www.cftc.gov/MarketReports/CommitmentsofTraders/ExplanatoryNotes/index.htm).
By InvestMacro Here are the latest charts and statistics for the Commitment of Traders (COT)…
By ForexTime FXTM’s USDInd ↑ 2% MTD Dollar best performing G10 currency MTD Geopolitical risk…
By JustMarkets The US stock market concluded Thursday’s session in the red as the escalating…
By Analytical Department RoboForex EUR/USD is holding near 1.1620 on Friday, with the US dollar…
By JustMarkets The US stock market rose on Wednesday. By the end of the day,…
By Daniele D'Alvia, Queen Mary University of London When a conflict escalates, financial markets respond…
This website uses cookies.