By CountingPips.com COT Home | Data Tables | Data Downloads | Newsletter
Here are the latest charts and statistics for the Commitment of Traders (COT) data published by the Commodities Futures Trading Commission (CFTC).
The latest COT data is updated through Tuesday June 22 2021 and shows a quick view of how large traders (for-profit speculators and commercial entities) were positioned in the futures markets.
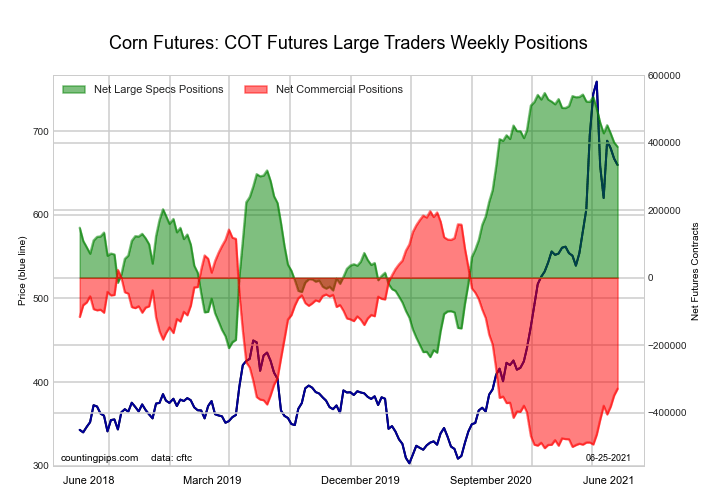
This week’s current strength score (the trader positioning range over the past three years, measured from 0 to 100) shows the speculators are currently Bullish with a score of 79.7 percent. The commercials are Bearish with a score of 25.1 percent and the small traders (not shown in chart) are Bearish-Extreme with a score of 2.0 percent.
| CORN Futures Statistics | SPECULATORS | COMMERCIALS | SMALL TRADERS |
| – Percent of Open Interest Longs: | 29.3 | 48.5 | 8.2 |
| – Percent of Open Interest Shorts: | 5.5 | 68.7 | 11.9 |
| – Net Position: | 388,411 | -328,959 | -59,452 |
| – Gross Longs: | 478,631 | 791,994 | 134,086 |
| – Gross Shorts: | 90,220 | 1,120,953 | 193,538 |
| – Long to Short Ratio: | 5.3 to 1 | 0.7 to 1 | 0.7 to 1 |
| NET POSITION TREND: | |||
| – COT Index Score (3 Year Range Pct): | 79.7 | 25.1 | 2.0 |
| – COT Index Reading (3 Year Range): | Bullish | Bearish | Bearish-Extreme |
| NET POSITION MOVEMENT INDEX: | |||
| – 6-Week Change in Strength Index: | -14.4 | 19.3 | -14.4 |
Free Reports:
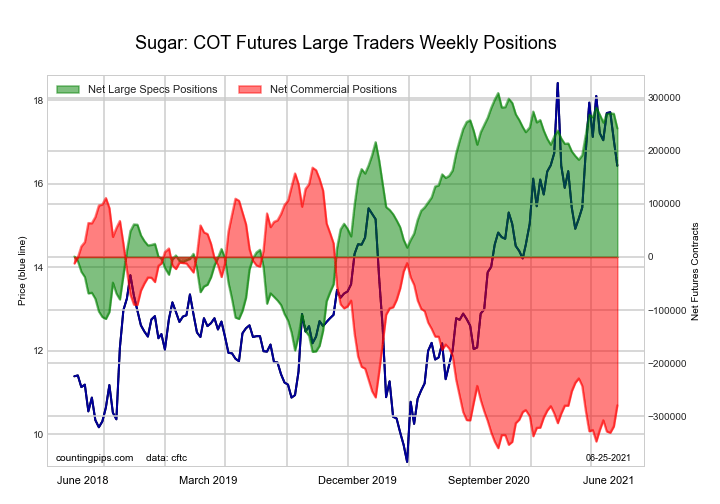
This week’s current strength score (the trader positioning range over the past three years, measured from 0 to 100) shows the speculators are currently Bullish-Extreme with a score of 86.3 percent. The commercials are Bearish-Extreme with a score of 15.3 percent and the small traders (not shown in chart) are Bullish with a score of 53.7 percent.
| SUGAR Futures Statistics | SPECULATORS | COMMERCIALS | SMALL TRADERS |
| – Percent of Open Interest Longs: | 30.5 | 45.9 | 9.0 |
| – Percent of Open Interest Shorts: | 4.3 | 76.1 | 5.0 |
| – Net Position: | 241,991 | -279,035 | 37,044 |
| – Gross Longs: | 282,164 | 425,054 | 83,620 |
| – Gross Shorts: | 40,173 | 704,089 | 46,576 |
| – Long to Short Ratio: | 7.0 to 1 | 0.6 to 1 | 1.8 to 1 |
| NET POSITION TREND: | |||
| – COT Index Score (3 Year Range Pct): | 86.3 | 15.3 | 53.7 |
| – COT Index Reading (3 Year Range): | Bullish-Extreme | Bearish-Extreme | Bullish |
| NET POSITION MOVEMENT INDEX: | |||
| – 6-Week Change in Strength Index: | -8.1 | 12.9 | -35.6 |
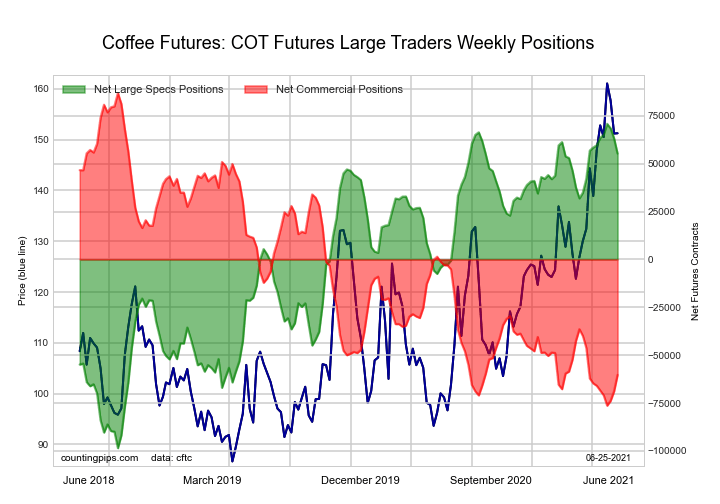
This week’s current strength score (the trader positioning range over the past three years, measured from 0 to 100) shows the speculators are currently Bullish-Extreme with a score of 90.8 percent. The commercials are Bearish-Extreme with a score of 9.8 percent and the small traders (not shown in chart) are Bearish with a score of 23.4 percent.
| COFFEE Futures Statistics | SPECULATORS | COMMERCIALS | SMALL TRADERS |
| – Percent of Open Interest Longs: | 30.9 | 46.9 | 4.5 |
| – Percent of Open Interest Shorts: | 10.2 | 69.5 | 2.6 |
| – Net Position: | 55,220 | -60,290 | 5,070 |
| – Gross Longs: | 82,447 | 125,020 | 12,103 |
| – Gross Shorts: | 27,227 | 185,310 | 7,033 |
| – Long to Short Ratio: | 3.0 to 1 | 0.7 to 1 | 1.7 to 1 |
| NET POSITION TREND: | |||
| – COT Index Score (3 Year Range Pct): | 90.8 | 9.8 | 23.4 |
| – COT Index Reading (3 Year Range): | Bullish-Extreme | Bearish-Extreme | Bearish |
| NET POSITION MOVEMENT INDEX: | |||
| – 6-Week Change in Strength Index: | -2.6 | 3.5 | -8.9 |
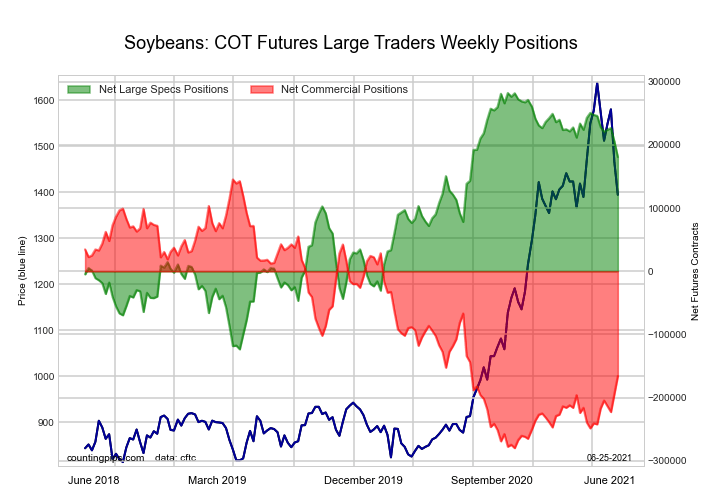
This week’s current strength score (the trader positioning range over the past three years, measured from 0 to 100) shows the speculators are currently Bullish with a score of 75.1 percent. The commercials are Bearish with a score of 26.8 percent and the small traders (not shown in chart) are Bearish with a score of 46.9 percent.
| SOYBEANS Futures Statistics | SPECULATORS | COMMERCIALS | SMALL TRADERS |
| – Percent of Open Interest Longs: | 31.5 | 48.4 | 6.8 |
| – Percent of Open Interest Shorts: | 7.7 | 70.3 | 8.8 |
| – Net Position: | 180,948 | -165,947 | -15,001 |
| – Gross Longs: | 238,976 | 366,569 | 51,734 |
| – Gross Shorts: | 58,028 | 532,516 | 66,735 |
| – Long to Short Ratio: | 4.1 to 1 | 0.7 to 1 | 0.8 to 1 |
| NET POSITION TREND: | |||
| – COT Index Score (3 Year Range Pct): | 75.1 | 26.8 | 46.9 |
| – COT Index Reading (3 Year Range): | Bullish | Bearish | Bearish |
| NET POSITION MOVEMENT INDEX: | |||
| – 6-Week Change in Strength Index: | -16.0 | 17.9 | -18.6 |
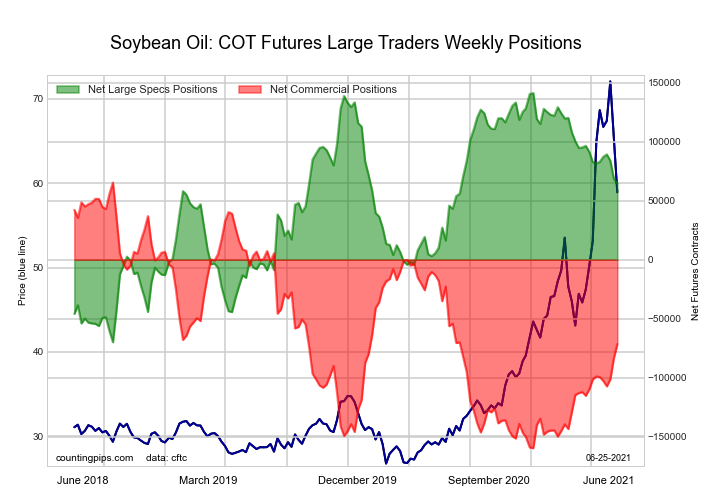
This week’s current strength score (the trader positioning range over the past three years, measured from 0 to 100) shows the speculators are currently Bullish with a score of 63.9 percent. The commercials are Bearish with a score of 39.2 percent and the small traders (not shown in chart) are Bearish with a score of 37.8 percent.
| SOYBEAN OIL Futures Statistics | SPECULATORS | COMMERCIALS | SMALL TRADERS |
| – Percent of Open Interest Longs: | 19.9 | 50.8 | 7.0 |
| – Percent of Open Interest Shorts: | 7.1 | 64.8 | 5.7 |
| – Net Position: | 64,908 | -71,439 | 6,531 |
| – Gross Longs: | 101,398 | 259,448 | 35,732 |
| – Gross Shorts: | 36,490 | 330,887 | 29,201 |
| – Long to Short Ratio: | 2.8 to 1 | 0.8 to 1 | 1.2 to 1 |
| NET POSITION TREND: | |||
| – COT Index Score (3 Year Range Pct): | 63.9 | 39.2 | 37.8 |
| – COT Index Reading (3 Year Range): | Bullish | Bearish | Bearish |
| NET POSITION MOVEMENT INDEX: | |||
| – 6-Week Change in Strength Index: | -8.0 | 12.2 | -39.6 |
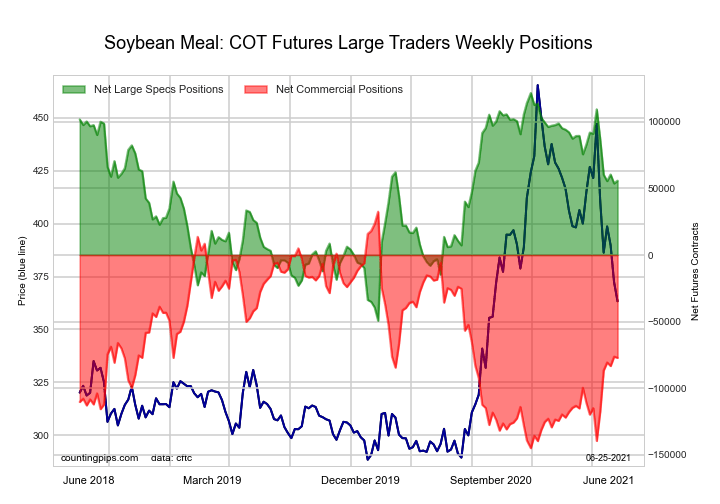
This week’s current strength score (the trader positioning range over the past three years, measured from 0 to 100) shows the speculators are currently Bullish with a score of 61.5 percent. The commercials are Bearish with a score of 38.2 percent and the small traders (not shown in chart) are Bullish with a score of 56.5 percent.
| SOYBEAN MEAL Futures Statistics | SPECULATORS | COMMERCIALS | SMALL TRADERS |
| – Percent of Open Interest Longs: | 22.6 | 52.5 | 12.0 |
| – Percent of Open Interest Shorts: | 8.6 | 71.9 | 6.6 |
| – Net Position: | 55,794 | -77,209 | 21,415 |
| – Gross Longs: | 89,916 | 209,524 | 47,835 |
| – Gross Shorts: | 34,122 | 286,733 | 26,420 |
| – Long to Short Ratio: | 2.6 to 1 | 0.7 to 1 | 1.8 to 1 |
| NET POSITION TREND: | |||
| – COT Index Score (3 Year Range Pct): | 61.5 | 38.2 | 56.5 |
| – COT Index Reading (3 Year Range): | Bullish | Bearish | Bullish |
| NET POSITION MOVEMENT INDEX: | |||
| – 6-Week Change in Strength Index: | -31.4 | 35.1 | -35.3 |
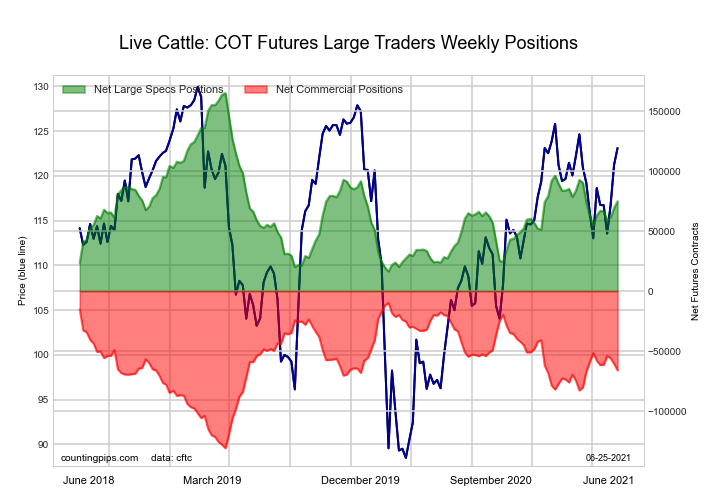
This week’s current strength score (the trader positioning range over the past three years, measured from 0 to 100) shows the speculators are currently Bearish with a score of 39.3 percent. The commercials are Bullish with a score of 53.6 percent and the small traders (not shown in chart) are Bullish with a score of 65.4 percent.
| LIVE CATTLE Futures Statistics | SPECULATORS | COMMERCIALS | SMALL TRADERS |
| – Percent of Open Interest Longs: | 39.4 | 38.0 | 9.1 |
| – Percent of Open Interest Shorts: | 14.4 | 60.0 | 12.0 |
| – Net Position: | 74,914 | -65,988 | -8,926 |
| – Gross Longs: | 118,184 | 113,906 | 27,178 |
| – Gross Shorts: | 43,270 | 179,894 | 36,104 |
| – Long to Short Ratio: | 2.7 to 1 | 0.6 to 1 | 0.8 to 1 |
| NET POSITION TREND: | |||
| – COT Index Score (3 Year Range Pct): | 39.3 | 53.6 | 65.4 |
| – COT Index Reading (3 Year Range): | Bearish | Bullish | Bullish |
| NET POSITION MOVEMENT INDEX: | |||
| – 6-Week Change in Strength Index: | 7.9 | -6.7 | -8.8 |
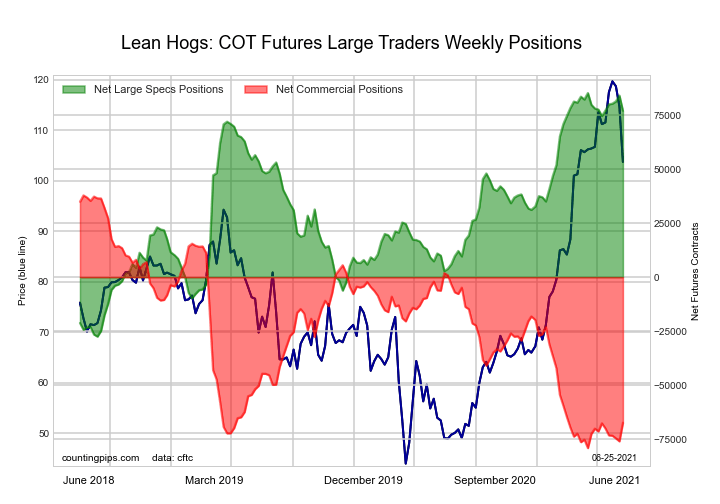
This week’s current strength score (the trader positioning range over the past three years, measured from 0 to 100) shows the speculators are currently Bullish-Extreme with a score of 92.7 percent. The commercials are Bearish-Extreme with a score of 10.0 percent and the small traders (not shown in chart) are Bearish with a score of 32.2 percent.
| LEAN HOGS Futures Statistics | SPECULATORS | COMMERCIALS | SMALL TRADERS |
| – Percent of Open Interest Longs: | 40.6 | 30.2 | 7.9 |
| – Percent of Open Interest Shorts: | 13.6 | 53.8 | 11.2 |
| – Net Position: | 76,976 | -67,377 | -9,599 |
| – Gross Longs: | 115,935 | 86,344 | 22,515 |
| – Gross Shorts: | 38,959 | 153,721 | 32,114 |
| – Long to Short Ratio: | 3.0 to 1 | 0.6 to 1 | 0.7 to 1 |
| NET POSITION TREND: | |||
| – COT Index Score (3 Year Range Pct): | 92.7 | 10.0 | 32.2 |
| – COT Index Reading (3 Year Range): | Bullish-Extreme | Bearish-Extreme | Bearish |
| NET POSITION MOVEMENT INDEX: | |||
| – 6-Week Change in Strength Index: | 2.1 | 0.2 | -12.5 |
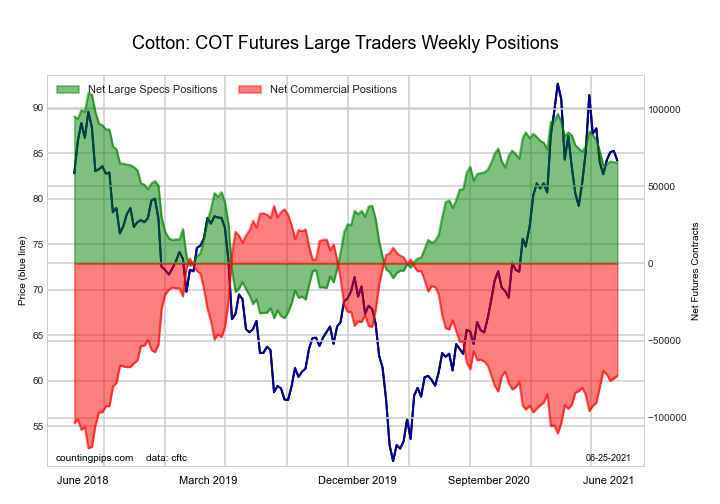
This week’s current strength score (the trader positioning range over the past three years, measured from 0 to 100) shows the speculators are currently Bullish with a score of 69.0 percent. The commercials are Bearish with a score of 29.8 percent and the small traders (not shown in chart) are Bullish with a score of 62.1 percent.
| COTTON Futures Statistics | SPECULATORS | COMMERCIALS | SMALL TRADERS |
| – Percent of Open Interest Longs: | 36.5 | 44.8 | 7.1 |
| – Percent of Open Interest Shorts: | 5.2 | 79.8 | 3.4 |
| – Net Position: | 65,170 | -72,814 | 7,644 |
| – Gross Longs: | 75,914 | 93,021 | 14,702 |
| – Gross Shorts: | 10,744 | 165,835 | 7,058 |
| – Long to Short Ratio: | 7.1 to 1 | 0.6 to 1 | 2.1 to 1 |
| NET POSITION TREND: | |||
| – COT Index Score (3 Year Range Pct): | 69.0 | 29.8 | 62.1 |
| – COT Index Reading (3 Year Range): | Bullish | Bearish | Bullish |
| NET POSITION MOVEMENT INDEX: | |||
| – 6-Week Change in Strength Index: | -10.3 | 11.1 | -15.4 |
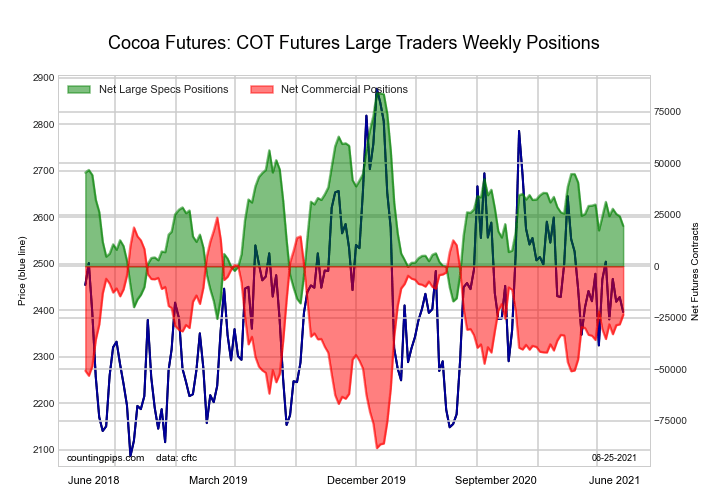
This week’s current strength score (the trader positioning range over the past three years, measured from 0 to 100) shows the speculators are currently Bearish with a score of 41.2 percent. The commercials are Bullish with a score of 57.8 percent and the small traders (not shown in chart) are Bullish with a score of 53.7 percent.
| COCOA Futures Statistics | SPECULATORS | COMMERCIALS | SMALL TRADERS |
| – Percent of Open Interest Longs: | 28.3 | 46.7 | 5.4 |
| – Percent of Open Interest Shorts: | 19.5 | 57.2 | 3.7 |
| – Net Position: | 19,604 | -23,581 | 3,977 |
| – Gross Longs: | 63,381 | 104,656 | 12,213 |
| – Gross Shorts: | 43,777 | 128,237 | 8,236 |
| – Long to Short Ratio: | 1.4 to 1 | 0.8 to 1 | 1.5 to 1 |
| NET POSITION TREND: | |||
| – COT Index Score (3 Year Range Pct): | 41.2 | 57.8 | 53.7 |
| – COT Index Reading (3 Year Range): | Bearish | Bullish | Bullish |
| NET POSITION MOVEMENT INDEX: | |||
| – 6-Week Change in Strength Index: | -4.2 | 6.3 | -28.2 |
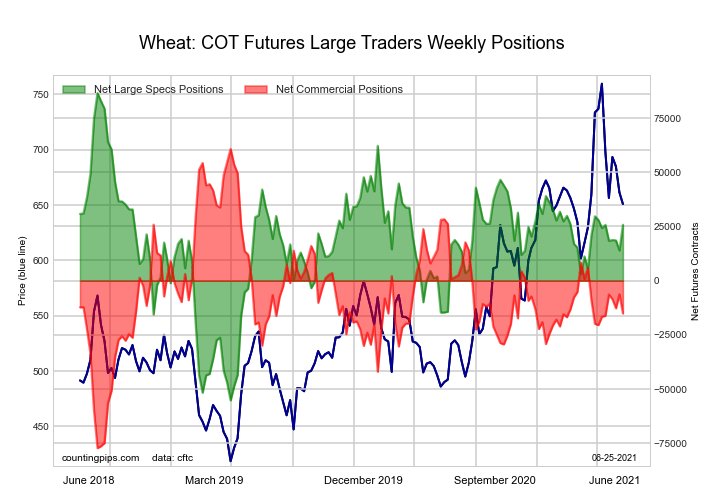
This week’s current strength score (the trader positioning range over the past three years, measured from 0 to 100) shows the speculators are currently Bullish with a score of 57.1 percent. The commercials are Bearish with a score of 45.0 percent and the small traders (not shown in chart) are Bullish with a score of 50.5 percent.
| WHEAT Futures Statistics | SPECULATORS | COMMERCIALS | SMALL TRADERS |
| – Percent of Open Interest Longs: | 29.0 | 37.2 | 7.2 |
| – Percent of Open Interest Shorts: | 22.3 | 41.1 | 10.0 |
| – Net Position: | 25,806 | -15,106 | -10,700 |
| – Gross Longs: | 112,624 | 144,499 | 28,005 |
| – Gross Shorts: | 86,818 | 159,605 | 38,705 |
| – Long to Short Ratio: | 1.3 to 1 | 0.9 to 1 | 0.7 to 1 |
| NET POSITION TREND: | |||
| – COT Index Score (3 Year Range Pct): | 57.1 | 45.0 | 50.5 |
| – COT Index Reading (3 Year Range): | Bullish | Bearish | Bullish |
| NET POSITION MOVEMENT INDEX: | |||
| – 6-Week Change in Strength Index: | 1.0 | 1.1 | -14.4 |
Article By CountingPips.com – Receive our weekly COT Reports by Email
*COT Report: The COT data, released weekly to the public each Friday, is updated through the most recent Tuesday (data is 3 days old) and shows a quick view of how large speculators or non-commercials (for-profit traders) were positioned in the futures markets.
The CFTC categorizes trader positions according to commercial hedgers (traders who use futures contracts for hedging as part of the business), non-commercials (large traders who speculate to realize trading profits) and nonreportable traders (usually small traders/speculators).
Find CFTC criteria here: (http://www.cftc.gov/MarketReports/CommitmentsofTraders/ExplanatoryNotes/index.htm).
Source: Stephen McBride (7/27/26) Stephen McBride of RiskHedge shares his thoughts on the potential for…
By JustMarkets The US equity indices showed mixed performance on Monday ahead of the Federal…
By Analytical Department RoboForex Gold fell to 4,047 USD per ounce on Tuesday, erasing gains…
By JustMarkets The US equity indices ended Friday’s session mixed. The Dow Jones (US30) gained…
By Analytical Department RoboForex EUR/USD enters the final week of July at 1.1369. Friday's modest…
By InvestMacro Here are the latest charts and statistics for the Commitment of Traders (COT)…
This website uses cookies.