The BAN Hotlist trade setups show incredible success at the start of 2021, learn how you can too!

By TheTechnicalTraders 

Even though our BAN Trader Pro strategy and systems have just been released to members, the early price rotation in 2021 has shown how powerful it can be in the first week.  Early 2021 BAN Hotlist triggers, used as discretionary trading signals for members, have caught some incredible early success recently.

The BAN Trader Pro system allocates trading capital into four high momentum ETFs with each new leg up in the stock market that meets the BAN trigger setup.  This allows BAN Trader Pro members to capitalize on the strongest sectors presenting the highest BAN momentum ranking.  We are able to target stronger trends with reduced draw-downs and risks by focusing on the best assets to own (BAN: Best Asset Now) and trading only the best assets when proper alignment between the market and these momentum sector BAN setups occur.

How to Benefit Using BAN Trader Pro Hotlist

One of the best-added values for our BAN Trader Pro members is the BAN Hotlist. This is a daily list of the BAN sector setups which also includes new BAN triggers that fall somewhere below the top ten BAN ranking sectors.  This allows our BAN Trader Pro members to make additional trades, as they like, or use the information from the BAN Hotlist to compliment their own strategies. as a discretionary trade. These explosive trade setups coupled with our detailed position management guidelines packs a powerful punch for the growth of any account using them.

The following screen capture of our current BAN Trade Pro Hotlist (blurred to protect Member-only content), highlights how to view the best ETFs to own at any given time and all market conditions. The focus is on the top 10 sectoral ETFs, and we look for the long-term STAGE analysis to be BULLISH, the short-term TREND to be UP, and overall stock market sentiment to be RISK-ON, which means investors are taking risks and betting on high growth in these sectors. As you can see there have been a lot of great opportunities recently that get delivered our BAN Hotlist to our premium subscribers every day.

The strength of the BAN Trader Pro technology is the ability to catch strong momentum/trend trades in an “aligned” market trend format across various market sectors.  We call this the Best Asset Now (BAN) system for a reason.  The higher the ranking of the BAN technology, the stronger the potential future trends.  When a symbol moves up the BAN Trade Hotlist, it is growing in strength and momentum. This is where we look for the best BAN trade setups when the stock market gives us a new buy signal for a major leg higher.

The additional BAN trade signals that fall below a new major market buy signal, and the end of the stock market trend are power setups for 7-15% moves within a couple weeks of a new trigger. We only want to trade the best assets in the strongest trends. Our members are given the BAN Trader Pro Hotlist every morning before the opening bell.  This allows them to make their own trading decisions using the BAN setups and to execute any valid BAN trade they want when looking for another trade to keep their portfolio working hard for them.

Daily & 10-Minute Chart of BAN Trades

The following daily and 10-minute chart of the BAN trade trigger was generated at the end of the trading day as all signals are (EOD).

This is another BAN trade trigger, generated 21 days ago and it has moved up 13.47% and its likely going much higher.

2021 is going to be an incredible year for BAN Trader subscribers because of the big trends, high volatility, stimulus, and policies with the Biden administration. The time is now to learn and trade the Best Assets Now Hotlist using our proven sector rotation strategy. Our BAN Trader Pro strategy is proving to be an incredible advancement that allows us to dominate and generate Alpha. We urge you to take advantage of the BAN Trader Pro technology and prepare for the big trends that we expect to continue throughout all of 2021 and into 2022 and beyond.

I am teaching my BAN trading strategy this week in a 1-hour FREE webinar. The webinar is 100% educational and you will get everything you need to trade my powerful strategy on your own, with no proprietary trading tools or indicators, and with no strings attached. Learn this strategy now and join me in my webinar at https://joinnow.live/s/ClJSoP.

I believe every trader needs an edge to gain an advantage in the markets and that is exactly what I deliver in my webinar. Make 2021 your year to own the markets… all it will cost you is one hour of your time!

Happy Trading!

Chris Vermeulen
Chief Market Strategist
www.TheTechnicalTraders.com

What A Democratic Sweep Of Congress Means For The Markets

By Orbex

The media attention has focused on the drama in the US Capitol over the last couple of days. As a result, the more relevant event for the markets has gone a little bit under the radar.

After securing the Presidency, Democrats have taken control of the Legislature by the narrowest of margins. And the markets have already started to react.

But there are implications for how currencies and stocks will behave going forward.

The latest developments include a series of speeches by Fed officials that underscore the market relevance of the political change in Washington.

Bostic was perhaps the most dramatic. He said that the Fed might raise rates sooner than expected. The consensus among the market has been for some revision to Fed policy in 2023.

So, “sooner” would presumably be next year.

Mester and Daily also commented on their outlook. They suggested that they saw a better than anticipated recovery in the second half of the year.

Although not specifically addressing the issue of rates, they did not affirm the prior standing line that rates would stay low until needed.

Higher interest rates, so why higher stock market?

Yesterday, President-Elect Biden repeated his pre-election initiative for a third stimulus package.

He said he was looking for as much as $3.0T in new spending. This would already include the balance of the $2,000 stimulus checks.

So far, there hasn’t been any official announcement of what would be in the “tax and infrastructure” package. But the total is above what most analysts had anticipated.

Increased spending has obstacles, however.

The Democrats have a very slim majority. And legally, they would need a majority of 60 Senators to approve any increase in spending.

Democrats only have 50.

What could hit the markets potentially is if Republicans dig in their heels to oppose a spending increase, and Democrats then move to get rid of the 60 majority requirement.

Moderate Democrats have assured they wouldn’t vote for such a measure. However, nothing is set in stone in politics. Most analysts think it’s very unlikely, but it’s something traders ought to be aware of after Jan 20th.

Republicans are likely to support some manner of stimulus spending, and it’s possible that in reality, both sides will compromise on a lower amount.

Despite Biden’s announcement, most analysts still see between $700-800B in stimulus spending. This is aside from the $464B implied from the addition of the stimulus check top-up.

Can taxes go up?

Democrats don’t have a majority sufficient to increase government spending. That said, it is possible for their majority to pass tax modifications through a process called “budget reconciliation”.

Trump’s tax cuts were passed through this mechanism. So, Biden tax hikes can also pass in the same manner. Analysts are looking at potential increases in:

  • the top marginal tax rate to 39.5% (return to 2016 levels),
  • capital gains tax,
  • “green” taxes.

As for individual stocks, following the events on Capitol Hill, Biden is reportedly under increasing pressure to push for regulation of social media companies.

On the one hand, some analysts believe that government guidelines for social media would help the firms avoid controversies and further advertising boycotts. (The “Adpocalypse 3.0”, as it has been called in reference to the 2017 move by advertisers against YouTube content policies.)

On the other hand, there are other members of the Democrat caucus that are pushing for breaking up major social media companies, particularly targeting Facebook.

Democrats don’t have a “supermajority” in Congress that would allow them to pass legislation unimpeded.

They are in a much better bargaining position with a marginal majority. However, most major legislation requires more of a majority than they have.

It allows for faster confirmation of the Cabinet, officials, judges, and other administrative and regulatory activity. But likely, major legislation will be as slow as always.

By Orbex

Metals Rally Capped By USD Recovery

By Orbex

Gold

Gold prices started the week on a positive note. However, they reversed lower midweek as the US dollar made a comeback.

The greenback rallied in response to the Georgia run-off results. The election outcome removed political uncertainty as both Democrat candidates won their races.

The Democrats now have control of the Senate along with the House of Representatives and the White House.

Despite the Trump riots at Capitol Hill, the markets now have confirmation that Joe Biden will be entering office on January 20th.

Gold has also come under pressure this week from the rally in equities markets. These exploded higher in response to the election news.

Traders are now firmly focused on fiscal stimulus expectations with both Joe Biden and Nancy Pelosi pledging to deliver sweeping packages.

The FOMC minutes midweek showed that policymakers at the Fed voted unanimously to keep asset purchases in place.

Despite the uptick in the dollar this week, the outlook for gold looks tilted higher. This comes as the dollar is poised for continued downside in light of the current easing expectations and the uncertainty around the COVID pandemic.

Gold Reverses Midweek

Following the breakout above the bearish trend line from 2020 highs, gold prices ran into selling pressure ahead of the 1980.66 level resistance.

Price has since slipped back below the 1919.92 support. However, it is being held up by the retest of the broken bearish trend line from 2020 highs.

While above here, the near-term bias remains bullish.

Silver

Silver prices tracked the moves lower in gold this week. Price reversed from initial gains as the resurgent dollar capped the rally in metals.

XAG prices have been moving broadly higher over recent weeks as the uptick in equities prices, as well as better manufacturing data around the globe, has helped improve the demand outlook for silver.

Silver Breakout Continues

Silver prices continue to trade higher within the broad bullish channel which has framed the rally off 2020 lows. Price recently broke above the bearish trend line from 2020 highs and above the 26.00 resistance.

While price holds above the 26.00 level, the near term bias remains bullish with bulls looking for a break above the 29.04 level next.

By Orbex

Democrats Seek Trump Removal

By Orbex

Greenback Enjoys its Best Day this Year

The dollar index reacted to the victory in Georgia for the Democrats as it closed 0.52% higher on Thursday.

The immediate impact is that the new administration will unveil a large stimulus package which generally would be negative for the dollar. However, it could also help speed up the recovery, which could force the Federal Reserve to hike interest rates.

In addition to yesterday’s riots, lawmakers have pressured Trump to leave the White House before Biden’s inauguration in less than 2 weeks.

Bulls will now be looking for the 93 handle as we await the first NFP data for 2021.

WHO Urges Tighter Restrictions

The euro closed 0.44% lower yesterday as it failed to hold on to the 1.23 barrier.

The World Health Organisation’s European director stated that 22 of the bloc’s countries had cases of the new Covid-19 variant, which is an alarming situation.

This can only lead to one thing, further lockdowns and stricter measures.

With more vaccinations being certified, will the rollouts happen quickly and effectively enough before another wave occurs?

No End in Sight for UK Lockdowns

The pound slipped 0.32% lower on Thursday as it crashed through the 1.36 ceiling.

Prime Minister Johnson gave another televised address stating the reasoning behind further restrictions but gave no clues as to when normality will return.

This comes as problems grow at UK ports with backlogs and delays, as new trade barriers are imposed after last month’s trade deal with the EU.

Indexes Close at New Records

Stocks were upbeat yesterday as congress confirmed President-elect Joe Biden’s election win, offering the prospect of more fiscal aid.

The Nasdaq was the front runner, as it closed 2% higher.

Investors will now focus on the prospect of a more aggressive fiscal agenda under a new Biden administration, as the clock counts down to the inauguration date.

Gold Keeps Slipping

Gold closed 0.27% lower on Thursday as risk-on sentiment remained.

Some economists declared that the big push for the yellow metal is well and truly behind us, as further vaccination rollouts will weigh heavy on the price.

However, depending on the speed and effectiveness of the vacciness, could we see another push to $2,000 anytime soon?

Oil Shifts Past $51

Prices of WTI surpassed the $51 mark during yesterday’s session.

The rally came after the recent announcement by Saudi Arabia, the world’s largest oil export, to cut its domestic production by around 1 million bpd for the next two months.

With vaccination optimism in full swing, how long will this rally continue for?

By Orbex

The Analytical Overview of the Main Currency Pairs on 2021.01.08

by JustForex

The EUR/USD currency pair

Technical indicators of the currency pair:
  • Prev Open: 1.2324
  • Prev Close: 1.2271
  • % chg. over the last day: -0.43%

EUR/USD is gradually slowing down the northern movement. It wasn’t possible to renew the highs on January 6, but the pair still remains above the first support levels. After negative statistics from the service sector, the 10-year bonds yield spread fell sharply. German Bonds lost about 50 basis points against American Treasuries in 24 hours, which is a strong change in the difference.

Trading recommendations
  • Support levels: 1.2241, 1.2216
  • Resistance levels: 1.2349, 1.2414

The main scenario for trading EUR/USD is selling. Euro failed to overcome the resistance level, bouncing back to the support level, and breaking it through. The price has consolidated below the moving averages, which indicates the dominance of bears. The rest of the indicators also changed to the south. The MACD has fixed below zero and indicates convergence at the minimum values. The ADX reacted to the decline, but not significantly, which indicates low downward movement potential. Fixing the price below 1.2241 will strengthen the southern signal.

Alternative scenario: if the price can fix above the level of 1.2294, the pair may return to the highs of 1.2349.

EUR/USD
News feed for 2021.01.08:
  • – Nonfarm Payrolls Сhange (Dec) at 16:30 (GMT+2);
  • – Average Hourly Earnings (m/m) (Dec) at 16:30 (GMT+2);
  • – Unemployment rate (Dec) at 16:30 (GMT+2).

The GBP/USD currency pair

Technical indicators of the currency pair:
  • Prev Open: 1.3603
  • Prev Close: 1.3560
  • % chg. over the last day: -0.32%

Bullish sentiments are gradually falling in sterling. The continuing decline in business activity in the services sector indicates a negative end to the year. GDP estimates for Q4 2020 may be lower than expected. Factors indicating that sterling is overvalued are gradually emerging. Dollar bulls play into the hands of bears in sterling. After positive data from the manufacturing sector and services, the dollar index is showing an uptrend.

Trading recommendations
  • Support levels: 1.3541, 1.3428
  • Resistance levels: 1.3670, 1.3702

The main scenario in GBP/USD is range trading. This week the pair didn’t go beyond the significant resistance level. However, the pound is also bouncing off the support. The formed local “double bottom” gives a technically significant level. A break-through at the level of 1.3541 will be a strong sell signal. In the meantime, all indicators are in a calm state. The ADX and MACD indicate flat. The moving averages give only a small bearish signal.

Alternative scenario: if the pair fixes above 1.3702, the growth is likely to resume. A break-through at 1.3541 could turn the pair completely south.

GBP/USD
News feed for 2021.01.08:
  • – Nonfarm Payrolls Сhange (Dec) at 16:30 (GMT+2);
  • – Average Hourly Earnings (m/m) (Dec) at 16:30 (GMT+2);
  • – Unemployment rate (Dec) at 16:30 (GMT+2).

The USD/JPY currency pair

Technical indicators of the currency pair:
  • Prev Open: 103.03
  • Prev Close: 103.80
  • % chg. over the last day: +0.74%

On Wednesday and Thursday, the currency pair surprised with rapid movements. The lack of reaction to any events was suddenly replaced by a fast northern movement following the stock market, which was able to renew highs. The service sector data in the US cheered the bulls. However, the important resistance hasn’t yet been overcome.

Trading recommendations
  • Support levels: 102.89, 102.59
  • Resistance levels: 103.90, 104.76

The main scenario is risk-averse purchases. The bearish scenario was temporarily canceled by the break-through of the first resistance level. At the second important level, there was only a puncture. It’s too early to talk about a U-turn. It’s necessary to monitor whether the price will fix above the level of 103.90. Today’s NFP data may decide the way forward. The ADX showed high potential for the northern movement, while the MACD demonstrated convergence on growth.

An alternative scenario assumes the price-fixing below 103.42. In this case, the pair may fall to 102.89.

USD/JPY
News feed for 2021.01.08:
  • – Nonfarm Payrolls Сhange (Dec) at 16:30 (GMT+2);
  • – Average Hourly Earnings (m/m) (Dec) at 16:30 (GMT+2);
  • – Unemployment rate (Dec) at 16:30 (GMT+2).

The USD/CAD currency pair

Technical indicators of the currency pair:
  • Prev Open: 1.2673
  • Prev Close: 1.2685
  • % chg. over the last day: +0.09%

As a result of the past two days, mixed signals were received. The rise in oil prices puts upward pressure on the Canadian currency. At the same time, the growth of the US dollar is trying to pull the pair up. As a result, the pair shows only a slight increase in price, updating the highs of the previous day. But daily candles leave long shadows at the top.

Trading recommendations
  • Support levels: 1.2630, 1.2523
  • Resistance levels: 1.2797, 1.2875

The main scenario is trading in a sideways range. A quick bounce of quotations to the north led to nothing. The moving averages were broken, but no consolidation took place. The MACD is near zero. The ADX isn’t much reacting to the movements in both directions. The pair is likely to get stuck near the current price and start consolidating.

Alternative scenario: if the price can fix above 1.2737, the pair may return to 1.2797 and reverse the south trend. A break-through of 1.2630 will indicate a continuation of the southern trend.

USD/CAD
News feed for 2021.01.08:
  • – Nonfarm Payrolls Сhange (Dec) at 16:30 (GMT+2);
  • – Average Hourly Earnings (m/m) (Dec) at 16:30 (GMT+2);
  • – Unemployment rate (Dec) at 16:30 (GMT+2).

by JustForex


This article reflects a personal opinion and should not be interpreted as an investment advice, and/or offer, and/or a persistent request for carrying out financial transactions, and/or a guarantee, and/or a forecast of future events.

Treasury yields continue to grow steadily following commodity prices and positive US data

by JustForex

10-year bonds yield continues to rise and surpassed the 1.10% mark yesterday. Investors are positive about the expansion of stimulus measures for the economy after the Congressional elections. The Democratic victory is expected to increase welfare benefits from $600 to $2,000.

The dollar index rose following the bonds. Positive statistics this week cheered the bulls. According to ISM, the manufacturing sector showed positive dynamics at first. Now the service sector has distinguished itself with high indicators. According to the Institute for Supply Management, the service index rose over the month to 57.2 from 55.9 in November. The December marker exceeded all economists’ forecasts. Values above 50 indicate expansion.

The acceleration in the growth of companies that contribute to the economy the most is surprising considering the rise in coronavirus infections and tightening restrictions for businesses in some states.

In December, fourteen service sectors showed growth, primarily due to management companies and support services, wholesale and retail sellers, and medical services. There was a contraction in the hotel and catering sectors. Negative indicators are also observed in the field of entertainment and leisure.

Index of employment was the only weak link in the report. There was a contraction for the first time in four months. The index fell to 48.2. Shortly before the release of data on the US labor market, this is the only negative moment for the market confirming weak expectations. In the American session, one can probably expect high volatility in the stock, credit, and foreign exchange markets.

Currently, the stock market and the dollar index are demonstrating positive dynamics:

S&P 500 (F) 3,808.88 +13.38 (+0.35%)

Dow Jones 31,041.13 +211.73 (+0.69%)

DAX 14,122.95 +154.71 (+1.11%)

FTSE 100 6,873.35 +16.39 (+0.24%)

USD Index 90.037 +0.246 (+0.27%)

Important events:
  • – Nonfarm Payrolls Сhange (Dec) at 16:30 (GMT+2);
  • – Average Hourly Earnings (m/m) (Dec) at 16:30 (GMT+2);
  • – Unemployment rate (Dec) at 16:30 (GMT+2).

by JustForex


This article reflects a personal opinion and should not be interpreted as an investment advice, and/or offer, and/or a persistent request for carrying out financial transactions, and/or a guarantee, and/or a forecast of future events.

Stocks set for more record highs

By Han Tan, Market Analyst, ForexTime

So much for a slow start to the new year. From a pair of tense Senate runoffs, to a mob breaching Capitol Hill, and even a shock supply cut from Saudi Arabia, global investors have had plenty to take in this week.

Yet, the buying momentum in stocks has shown its resilience.

After overcoming the slight wobble on Monday, US equity benchmarks have since posted new record highs on Thursday, with futures contracts still in the green at the time of writing. The MSCI ACWI index, which measures the overall performance of stocks across emerging and developed markets, also registered its highest ever close yesterday. Asian equity benchmarks are climbing on Friday, with the MSCI Asia Pacific index advancing some two percent already so far this year.

Reasons aplenty to look up

Stock market bulls have many reasons to expect further gains. Investors are getting more comfortable wading further out into risk-on waters, considering that the spillover from 2020’s downside risks have abated, be they Brexit concerns, or the US election cycle (with outgoing US President Donald Trump finally stating his intent for a smooth transition).

Now, investors are gravitating towards the increased likelihood of more incoming US fiscal stimulus in light of the Democrats’ sweep of the Georgia Senate runoffs. The latest FOMC meeting minutes underscore policymakers’ will to hold fast to its supportive stance. The Covid-19 vaccine continues its global rollout, with Moderna’s vaccine receiving the EU’s blessing this week.

Such elements are fostering a highly supportive environment for global equities, affording investors the luxury of looking past the persistent pandemic woes.

Dollar bears likely unfazed by US hiring slowdown

Fundamentally-driven investors will be focusing on the US non-farm payrolls release later today, amid expectations for a mere increase of 50,000 jobs in December. Such figures would be a far cry from the millions of jobs that were restored in the months after the initial national lockdown was ended. A December NFP print of 50,000 would also be a mere one-fifth of the jobs added in the month prior, signaling that the post-lockdown recovery is stalling.

Still, the dissemination of more fiscal stimulus under the incoming Biden administration should help tide the US economy over. After all, the president-elect did vow this week to mail out those US$2,000 checks would be sent out “immediately” if Democrats won the Georgia Senate runoffs, which they did.

With such expectations intact, the Dollar index may not have much legs left in its recent rebound.

Gold supported by hopes of faster US inflation

10-year Treasury yields breaching the psychologically-important one percent mark this week, along with the Dollar’s rebound, have dealt a slight setback to Gold prices. Yet, the precious metal is still trading above the psychologically-important $1900 level, and remains on course for a sixth straight weekly gain.

Bullion remains supported by the reflation trade, amid expectations that Democrats’ control of the White House, Senate, and the House should pave the way for more incoming fiscal stimulus that can drive up US inflationary pressures.

However, should December’s non-farm payrolls report later today offer more evidence of a stalling US jobs market, that may dampen Gold prices in the immediate aftermath, while waiting for more inflationary boosters to come through. The Fed’s conveyed tolerance for an inflation overshoot also bodes well for the precious metal’s upside.

Spot Gold still harbours the potential to reclaim the $2000 handle, especially if the precious metal’s tailwinds can gather pace as 2021 unfolds.

Still, as commented by Fed officials this week, there appears to be a risk of a pullback in the Fed’s asset purchasing programme should a US economic outperformance crystalize in the latter part of the year. Another massive yields spike may then trigger the further unwinding of Gold’s recent gains.


Disclaimer: The content in this article comprises personal opinions and should not be construed as containing personal and/or other investment advice and/or an offer of and/or solicitation for any transactions in financial instruments and/or a guarantee and/or prediction of future performance. ForexTime (FXTM), its affiliates, agents, directors, officers or employees do not guarantee the accuracy, validity, timeliness or completeness, of any information or data made available and assume no liability as to any loss arising from any investment based on the same.


Forex-Time-LogoArticle by ForexTime

ForexTime Ltd (FXTM) is an award winning international online forex broker regulated by CySEC 185/12 www.forextime.com

Markets: keep calm and carry on

By Lukman Otunuga, Research Analyst, ForexTime

After the shocking and momentous scenes in Washington yesterday evening, perhaps the two most important things to remember as a trader are that firstly, markets are forward-looking vehicles. They do not focus on the present or past, but on the future. Secondly, markets do have a long history of being unmoved by political violence as rioting and street violence have very little economic effect.

Dollar finds a foothold

Significantly, Congress ended up certifying the presidential election results which means a Democratic sweep in Washington and the prospect of more stimulus spending. Bond yields are higher again which is giving some welcome relief to the Dollar. Although the broader environment over the medium-term remains unchanged, certainly the bid in the greenback is offering some stablisation with its recent heavy losses.

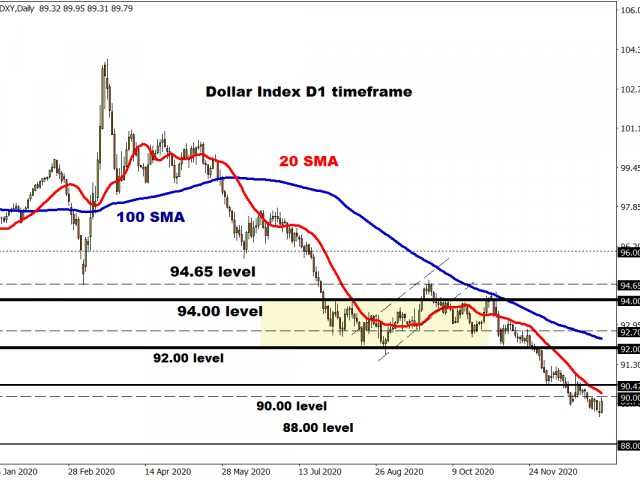
The demand for USD also tallies with its seasonal characteristics as we often see the buck doing better at the start of the year. DXY will need to clear the end of November low around 90.47 to stand any chance of arresting the long-term downtrend and moving back towards the 92 level.

US equities: record highs

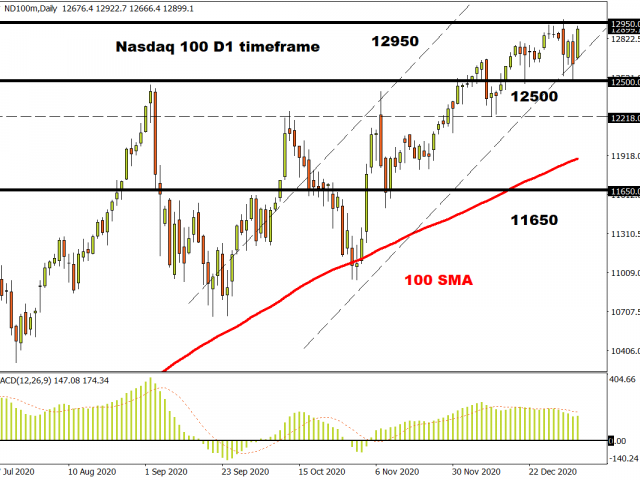
As if to reinforce the point about markets oblivious to political violence, stocks are making new highs as the sheer weight of money coming into risk assets driven by the medium-term optimism continues. Equity markets are very much pricing in better corporate earnings due to the expected economic boost from further fiscal measures. The tech-heavy Nasdaq has erased all its losses from yesterday and is peering into record territory as well. Are markets running ahead of themselves? The myriad of headwinds from last year are certainly no more (think Brexit, stimulus, vaccines…) and the central bank punchbowl is still very full, for now at least!

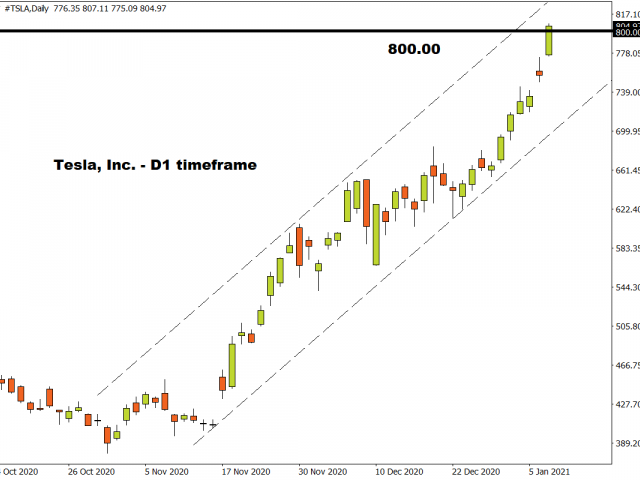
Two assets breaking records fast and catching the eye are Bitcoin and Tesla. The carmaker has now made Elon Musk the richest man in the world, after a 750% rise in the last 12 months. Meanwhile cryptocurrency prices have accelerated higher once again, crossing the stunning level of $1 trillion in total market cap for the first time in history. Bitcoin is approaching $39,000 while Ethereum has also surged higher, breaking back above $1200 for the first time since January 2018.

When certain assets experience such parabolic and explosive moves, technical analysis can be tricky as even the 20.5% correction  on Bitcoin witnessed last week now looks like a blip. Given how more action could on the horizon, it may be wise to hold onto your (crypto)hats while driving in your Tesla !

Disclaimer: The content in this article comprises personal opinions and should not be construed as containing personal and/or other investment advice and/or an offer of and/or solicitation for any transactions in financial instruments and/or a guarantee and/or prediction of future performance. ForexTime (FXTM), its affiliates, agents, directors, officers or employees do not guarantee the accuracy, validity, timeliness or completeness, of any information or data made available and assume no liability as to any loss arising from any investment based on the same.


Forex-Time-LogoArticle by ForexTime

ForexTime Ltd (FXTM) is an award winning international online forex broker regulated by CySEC 185/12 www.forextime.com

Could Alphabet Inc surge 11% higher from key support?

By Admiral Markets

Technology stocks have taken a beating in recent weeks as investors favoured value stocks instead of growth stocks. However, the sector rotation that has taken place is now seeing signs of a turn with new lockdown restrictions and vaccine rollout concerns forcing investors to move back into tech.

Alphabet Inc, the owner of Google, is showing some interesting technical levels on its share price. Over the past few weeks, the company’s stock price has struggled to break through two key levels of support, shown on the daily chart below:

Source: Admiral Markets MetaTrader 5, #GOOG, Daily – Data range: from Apr 9, 2020, to Jan 8, 2021, performed on Jan 8, 2021, at 8:30 am GMT. Please note: Past performance is not a reliable indicator of future results. Last five-year performance: 2020 = +7.89%, 2019 = -5.27%, 2018 = -2.11%, 2017 = +1.48%, 2016 = -3.97%, 2015 = +6.28%. 


The first support level is shown by the black horizontal line. This was created by the swing high at 1,717.99 during August 2020 which caused a temporary sell-off. When the price came back up and broke through it, the price level became a support level with more than four bounces to the upside since.

The second support level is the 50-period exponential moving average (red line). Moving averages are widely used in trending markets and currently confirm the trend is up with the 50-period, 100-period (green line) and 200-period (blue line) all pushing higher.

This week price bounced off both of these support levels for a potential move upwards. Traders will now be looking for additional signs of whether the market will continue its push higher, such as drilling to lower timeframes and viewing cycle formations.

If price can continue, traders may look to the 1,1888.00 price level, which is the 1.272 Fibonacci Extension from the 3 December 2020 swing high to the 21 December swing low, representing a near 11% push higher from December lows.

According to BarChart, there has been a huge shift in bullish analyst ratings for Alphabet stock, as shown below:

Source: BarChart, January 8, 2021


Did you know that you can use the Trading Central Technical Ideas Lookup indicator to find actionable trading ideas on this index and thousands of other instruments across Forex, stocks, indices, commodities and more?

You can get this indicator completely FREE by upgrading your MetaTrader 5 trading platform provided by Admiral Markets UK Ltd to the exclusive Admiral Markets Supreme Edition! You’ll also receive a whole range of advanced trading tools such as correlation and sentiment indicators!

Start your free download by clicking on the banner below:

Download MetaTrader 5 Supreme Edition

INFORMATION ABOUT ANALYTICAL MATERIALS:

The given data provides additional information regarding all analysis, estimates, prognosis, forecasts, market reviews, weekly outlooks or other similar assessments or information (hereinafter “Analysis”) published on the website of Admiral Markets. Before making any investment decisions please pay close attention to the following:

1.This is a marketing communication. The content is published for informative purposes only and is in no way to be construed as investment advice or recommendation. It has not been prepared in accordance with legal requirements designed to promote the independence of investment research, and that it is not subject to any prohibition on dealing ahead of the dissemination of investment research.

2.Any investment decision is made by each client alone whereas Admiral Markets UK Ltd (Admiral Markets) shall not be responsible for any loss or damage arising from any such decision, whether or not based on the content.

3.With view to protecting the interests of our clients and the objectivity of the Analysis, Admiral Markets has established relevant internal procedures for prevention and management of conflicts of interest.

4.The Analysis is prepared by an independent analyst Jitan Solanki, Freelance Contributor (hereinafter “Author”) based on personal estimations.

5.Whilst every reasonable effort is taken to ensure that all sources of the content are reliable and that all information is presented, as much as possible, in an understandable, timely, precise and complete manner, Admiral Markets does not guarantee the accuracy or completeness of any information contained within the Analysis.

6.Any kind of past or modelled performance of financial instruments indicated within the content should not be construed as an express or implied promise, guarantee or implication by Admiral Markets for any future performance. The value of the financial instrument may both increase and decrease and the preservation of the asset value is not guaranteed.

7.Leveraged products (including contracts for difference) are speculative in nature and may result in losses or profit. Before you start trading, please ensure that you fully understand the risks involved.

By Admiral Markets

Can a future ban on gas-powered cars work? An economist explains

By Amitrajeet A. Batabyal, Rochester Institute of Technology 

The U.S. transportation sector is one of the largest contributors of carbon dioxide, the potent driver of climate change.

Transportation accounts for about 28% of total U.S. greenhouse gas emissions and, since 1990, emissions in this sector have increased more than in any other area.

Reducing greenhouse gas emissions by encouraging the use of electric vehicles promises to be an effective strategy to address climate change. That’s because the electric grid is powered by diverse sources, including an increasing amount of renewable energy such as wind and solar.

But with more than 270 million motor vehicles registered in the U.S. and a long tradition of powering cars and trucks with fossil fuels, how will it be possible to make this switch?

On Sept. 23, California Gov. Gavin Newsom announced that after 2035, sales of gas-powered vehicles would be banned in California, a state where more than 50% of greenhouse emissions are generated by transportation. This ban includes gas-electric hybrid vehicles and, more generally, any vehicle with tailpipe emissions.

The governor’s executive order leaves a lot of unanswered questions. Will the proposed ban so far into the future have teeth? What will it actually accomplish if it becomes policy? Can it set the tone for the rest of the country and open the floodgates to a green transportation future?

Multiple cars traveling on a sunny boulevard.
Cars, cars and more cars.
Photo by Florian Wehde on Unsplash

In 2018, electric vehicles comprised nearly 2% of the U.S. market and nearly 8% in California. A ban on the sale of gas-powered cars in California could pave the way for an expansion of electric vehicle purchases and kick into high gear electric vehicle manufacturing and construction of charging stations. Yet this ban, intended to signal and spark decisive change, entails a certain amount of risk.

The implied ‘or else’ of a ban

A politician like Gavin Newsom may use a ban as a strategy because it sounds radical and harsh and implies or creates an ultimatum. By appearing to be tough on polluters, Newsom’s strategy may appeal to voters, particularly in environmentally conscious California.

In the case of climate change, a ban can be useful because, unlike a carbon tax, a ban at a future date doesn’t impose clear costs on consumers today. And, unlike subsidies designed to encourage the use of electric vehicles, bans don’t rely on federal support and, in that way, can be seen as fiscally conservative.

While measures like bans are not supported generally by economists, new research demonstrates that under some circumstances, a ban may make economic sense. For instance, one ban that has generally worked is on the sale and distribution of chlorofluorocarbons (CFCs) in the United States.

In this case, the circumstances depend on the extent to which electric vehicles can replace and are good substitutes for gas-powered vehicles.

If electric vehicles were perfect substitutes for conventional vehicles – the same price and offering equal or better performance – then the market would drive the creation of a nearly fully electric vehicle fleet. It would not be necessary for governments to put a policy into place to prompt people to buy and drive electric vehicles.

On the other hand, if electric vehicles are not substitutes for gas-powered vehicles, then it would be expensive for a government to push consumers to buy electric vehicles.

Illustration of an old Esso gas station.
Climate change overshadows American car culture.
Boston Public Library on Unsplash, CC BY-ND

To a policymaker interested in combating climate change, effective regulatory measures may include putting a price on carbon emissions – rather than enacting a ban – to encourage the market to move toward a future of all-electric vehicles. A carbon tax, which sets a price that emitters must pay for each ton of greenhouse gases they emit, would push the market toward electric vehicles. Currently, 25 countries around the world have a national carbon tax, including Canada, South Africa and Sweden. Emitters want to reduce their emissions to avoid paying the tax. California has a program that caps carbon emissions that similarly raises the cost of emissions.

That said, a carbon tax may be hard to implement in the U.S. because of voter resistance to paying more taxes; voters paying little attention to the benefits of a carbon tax, such as refunds for not emitting a lot; and the existence of a well-organized and -funded opposition. The next best option, then, may be to use a ban rather than a tax.

Impediments to an EV future

With improvements in battery technology in the past decade, electric vehicles are becoming better substitutes for conventional vehicles.

A symbol of an electric car with plug trailing behind.
Electric cars depend on charging stations. Are there enough?
Photo by Ralph Hutter on Unsplash, CC BY-ND

With more charging stations in place, auto manufacturers may find that it makes good business sense to shift more of their research and development to electric vehicle production. With less “range anxiety” over the distance between charging stations, consumers may be more likely to make the electric vehicle purchase decisions that policymakers would like them to make.

Moving away from fossil fuels to electricity may require a radical and risky action like a ban. While not ideal or necessarily even the first best policy instrument to achieve this objective, bans can be powerful change agents for consumers and the private sector.The Conversation

About the Author:

Amitrajeet A. Batabyal, Arthur J. Gosnell Professor of Economics, Rochester Institute of Technology

This article is republished from The Conversation under a Creative Commons license. Read the original article.