Here’s Why Blind Contrarianism Failed in 2020

There is only one instance when the investing crowd is right

By Elliott Wave International

Yes, there are many times when the market’s Elliott wave structure suggests that an investor should take a position “against the crowd,” or put another way, be a contrarian.

Prime examples are at market bottoms and tops.

However, keep this in mind from a classic Global Market Perspective, a monthly Elliott Wave International publication which provides analysis of 50-plus worldwide markets:

[S]trict adherence to the wave model habitually puts wave analysts where they should be: against the market crowd. But not always. At specific points in the market’s wave structure, wave analysts run with the herd.

A prime example of when Elliott wave practitioners have a lot of company is during the most severe part of a bear market. At such times, the Elliott wave model suggests that more downside is likely ahead and the crowd is likewise fully aware that the market is in the grip of a ferocious bear. The same applies to the strongest part of a bull market.

So, following the Elliott wave model and consistent contrarianism are not the same.

Indeed, read this quote from our just-published January Global Market Perspective:

Blind contrarianism failed in 2020, because some of the world’s most influential benchmarks — the DJIA in the United States, the DAX in Europe, and the Shenzhen Composite in China — spent much of the year rallying in small-degree third waves.

That issue of the Global Market Perspective went on to show this chart and said:

Turns out that 2020 was not just a bad year for contrary investing, it was the strategy’s worst year on record.

The contrary strategy’s best years are also illustrative. The technique returned 80% as the first technology bubble burst in 2000, and it made 60% in 2009, as equities rallied following the 2008-09 financial crisis. The year 2016 was also a good year for contrarians who wagered that cyclical stocks would benefit most from an economic expansion.

What about major global markets in 2021? Will contrarian investing be successful for the market or markets in which you are interested? In other words, should you be selling when others are buying, and vice versa?

Elliott wave analysis can help you answer those questions.

As the Wall Street classic book, Elliott Wave Principle: Key to Market Behavior, by Frost & Prechter, says:

Without Elliott, there appear to be an infinite number of possibilities for market action. What the Wave Principle provides is a means of first limiting the possibilities and then ordering the relative probabilities of possible future market paths. Elliott’s highly specific rules reduce the number of valid alternatives to minimum.

If you’d like to find out about “Elliott’s highly specific rules,” you can do so by reading the online version of Elliott Wave Principle: Key to Market Behavior for free.

That’s right — Elliott Wave International has made this Wall Street classic available to Club EWI members for free. Don’t worry — membership is also free. Moreover, Club EWI members enjoy free access to a wealth of Elliott wave educational resources.

Join the approximately 350,000 Club EWI members who are already gaining insights into trading and investing from an Elliott wave perspective by following this link: Elliott Wave Principle: Key to Market Behavior (free access now).

This article was syndicated by Elliott Wave International and was originally published under the headline Here’s Why Blind Contrarianism Failed in 2020. EWI is the world’s largest market forecasting firm. Its staff of full-time analysts led by Chartered Market Technician Robert Prechter provides 24-hour-a-day market analysis to institutional and private investors around the world.


Republicans Turn On Trump

By Orbex

Reality Hits Tremulous Dollar

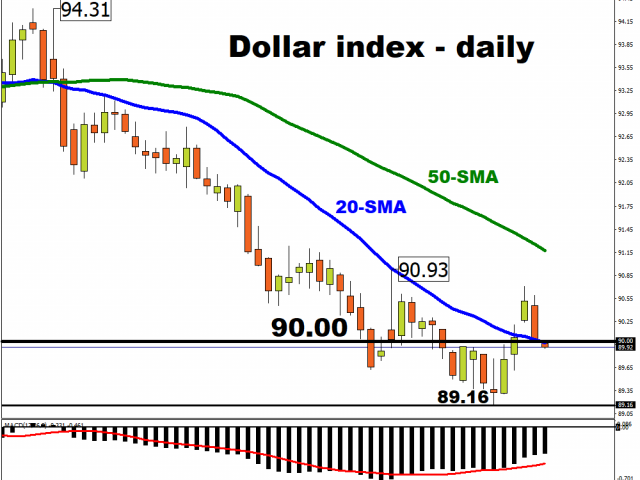
The dollar index fell 0.54% lower yesterday as it once again touched the 90 level.

The recent rally paused as the dollar shed some ground for the first time after four consecutive daily gains.

Investors looked past the potential impeachment of President Trump, focusing instead on the likely increase of fiscal stimulus under a Biden administration and the impact on inflation expectations.

This comes after the third most senior Republican, Liz Cheney, said she would vote to impeach Donald Trump over last week’s Capitol riot.

The House plans to vote today to charge Mr. Trump with inciting insurrection, which would make him the first US president ever to be impeached twice.

Euro Breaks Back

The euro managed to climb 0.45% higher on Tuesday, pushing back through the 1.22 ceiling.

Investors dumped their dollars yesterday, leading to a slight rally on the EURUSD pair.

This comes despite analysts predicting a sharp contraction in the first quarter of the year, with further Covid-19 restrictions taking their toll.

Double-dip recessions could be a common thing going into the start of the new year, as we await today’s industrial production numbers to lift spirits.

Sterling Pushes for 2-Year Highs

The pound had a day to remember yesterday, jumping over 1% as it reached for the 1.37 handle.

With the Bank of England ruling out negative interest rates, the governor said that quantitative easing would continue this year, with a further £150bn of asset purchases in the pipeline.

Mixed Day for Indices

The three major US indices all traded towards breakeven status on Tuesday.

This comes as several major tech giants continued to slide after sharp declines at the start of the trading week.

Twitter and Facebook continue to feel the brunt of the sell-off, as both stocks fell by over 2%.

Tesla shares rallied once again, as the stock remains near all-time highs.

Gold Begins Recovery

Gold closed 0.58% higher on Tuesday as the upturn begins after last week’s collapse.

The greenback’s decline is keeping bulls hopeful, amid expectations of a multitrillion-dollar stimulus likely to be announced by President-elect Joe Biden soon.

Added to the pandemic numbers and the civil unrest, could we see the yellow metal make a full retracement?

Oil at 11-Month High

WTI jumped over 2% yesterday, eclipsing the $53 handle.

Strong API figures showed a large crude draw which led the black gold higher. The rally now looks towards EIA figures released later today, as a further move would cement a push towards $60.

By Orbex

German 2020 GDP & The EU’s Potential Next Recession

By Orbex

Tomorrow we have the release of a preliminary, non-seasonally adjusted estimate of Germany’s GDP growth during last year.

While it’s important news, we don’t expect it to move the market. This is because it’s not one of the official measures, but more of a “best guess” based on a compilation of metrics.

More importantly, it doesn’t have all the December data.

But, getting better information on how the economy is developing in the largest economy of the Eurozone is important to understanding where the euro is likely to go.

And, well, it’s not exactly good news.

Another recession?

Europe managed to pull itself out of recession by posting stellar growth in the third quarter.

However, it was still far from recovering to pre-pandemic levels. The reimposition of lockdowns across Europe has led many analysts to project another couple of quarters of negative growth.

This would put Europe back into recession.

In Germany’s case, covid case numbers were already high enough in mid-October for a new round of economic impact to be inevitable. So, businesses started adjusting.

With most of Q4 dominated by some form of economic restrictions, it’s unlikely that Germany was able to secure quarterly growth.

The projections

The consensus among economists is that Germany’s GDP change for 2020 will come in at -5.0%. This is in comparison to 0.6% growth during the prior year.

We have to remember that Germany just barely escaped falling into technical recession a few times prior to covid.

In fact, even before the first covid case in Europe, Germany was about to have negative growth in Q1 2020 and only avoid a recession because the final quarter of 2019 had no growth.

So, we need to keep in context what “return to pre-pandemic” levels really means.

According to a recent survey of economists by Bloomberg, there are no expectations for Europe to return to the economic activity of “pre-pandemic levels” until at least the end of this year.

How much longer can this last?

Europe has been relatively slow in the context of developed countries. It has been the last of the major economies to approve the latest vaccines.

Distribution has lagged, and so has administration.

While the US has managed over 7M inoculations, the EU has managed only 3.3M by the same date (last Monday).

Comparatively, the UK was the first country to authorize the vaccines and has managed an inoculation rate of 4.2% of the population by last Monday. Meanwhile, the EU lags at 0.7%.

Germany is above average at 0.8% of its population having received the vaccine.

Early this morning, German Health Minister Spahn confirmed that Germany was headed for another 10 weeks of lockdowns.

Given the recent economic dynamics, that would virtually guarantee another quarter of economic contraction.

By Orbex

Fibonacci Retracements Analysis 13.01.2021 (GBPUSD, EURJPY)

Article By RoboForex.com

GBPUSD, “Great Britain Pound vs US Dollar”

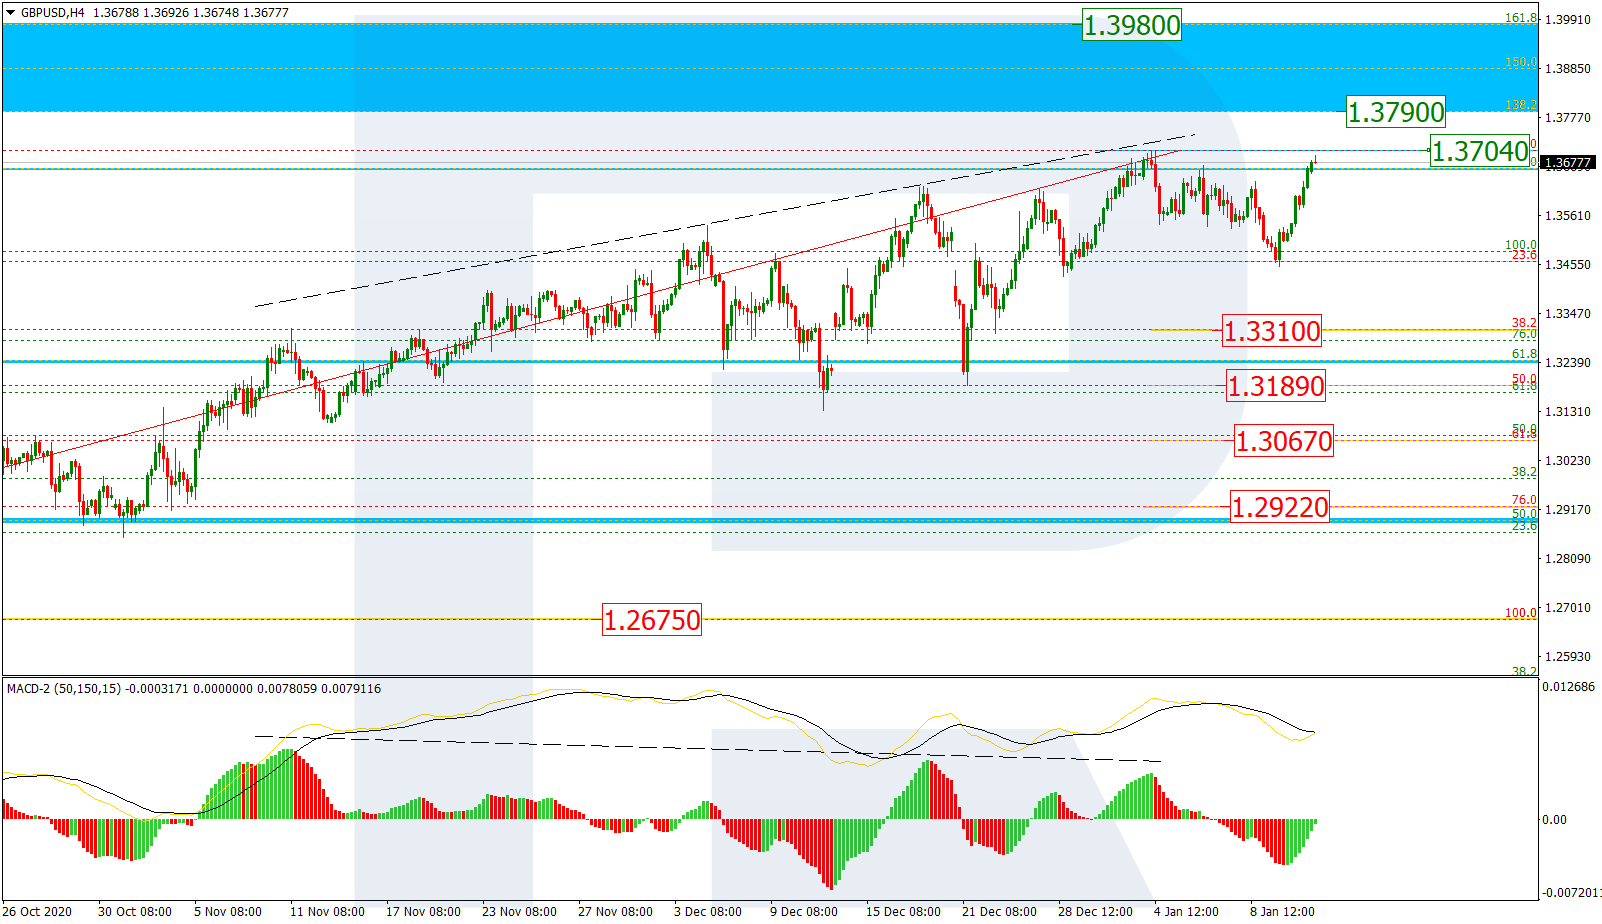
As we can see in the H4 chart, after finishing the correction at 23.6% fibo, GBPUSD is forming another rising wave. If the price breaks the high at 1.3740, it may continue growing to reach the post-correctional extension area between 138.2% and 161.8% fibo at 1.3790 and 1.3980 respectively. However, an alternative scenario says that the pair may rebound from the high and start a new descending structure towards 38.2%, 50.0%, 61.8%, and 76.0% fibo at 1.3310, 1.3189, 1.3067, and 1.2922 respectively.

GBPUSD_H4
Risk Warning: the result of previous trading operations do not guarantee the same results in the future

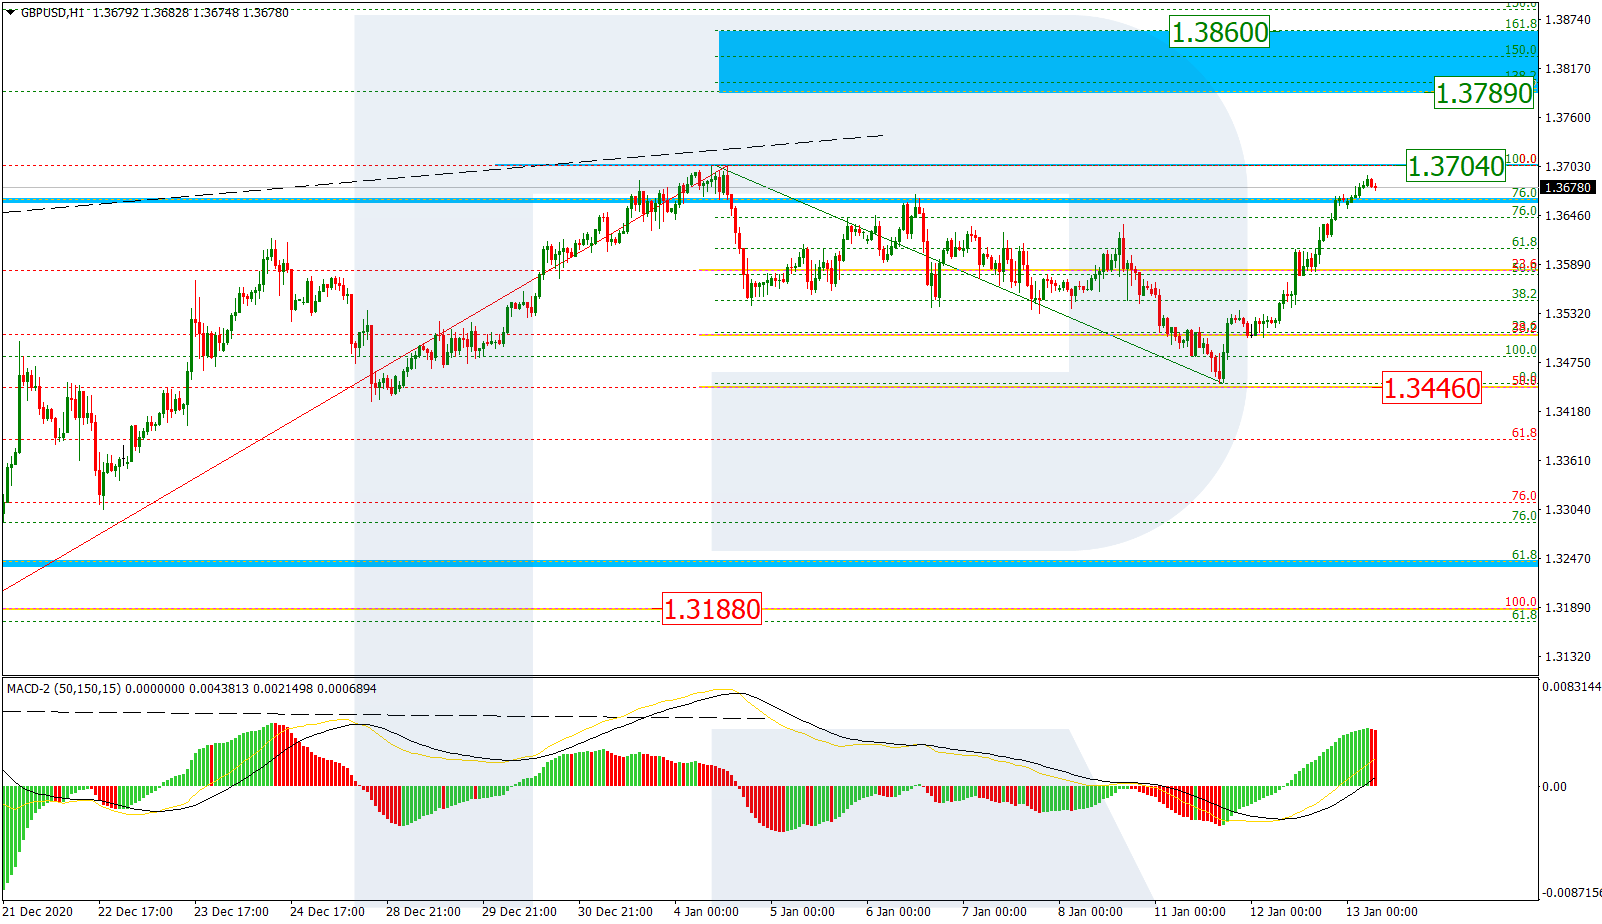
In the H1 chart, the price is approaching the high for a test and a possible rebound. In the nearest future, the pair may start a local pullback, which may later be followed by a new growth towards the post-correctional extension area between 138.2% and 161.8% fibo at 1.3789 and 1.3860 respectively. However, a breakout of the local low at 1.3446 will lead to another mid-tern correctional wave.

GBPUSD_H1
Risk Warning: the result of previous trading operations do not guarantee the same results in the future

EURJPY, “Euro vs. Japanese Yen”

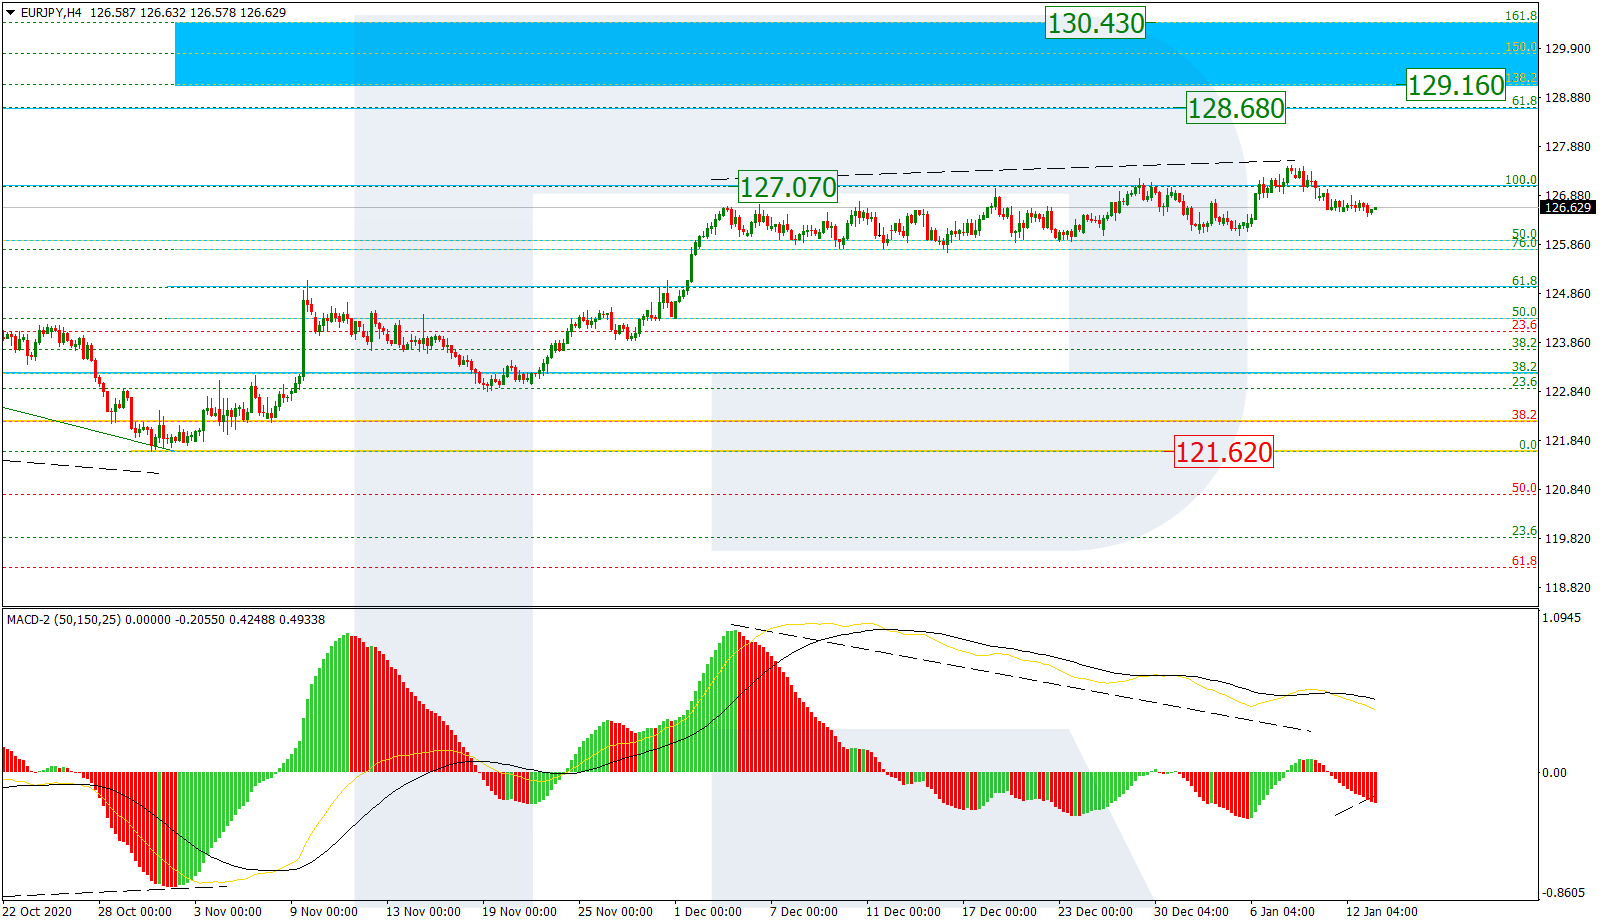
As we can see in the H4 chart, EURJPY is falling again after another divergence on MACD. Possibly, the pair may complete the correction and resume growing to break the mid-term 61.8% fibo at 128.65 and then continue moving to reach the post-correctional extension area between 138.2% and 161.8% fibo at 129.16 and 130.43 respectively. The key support is the fractal low at 121.62.

EURJPY_H4
Risk Warning: the result of previous trading operations do not guarantee the same results in the future

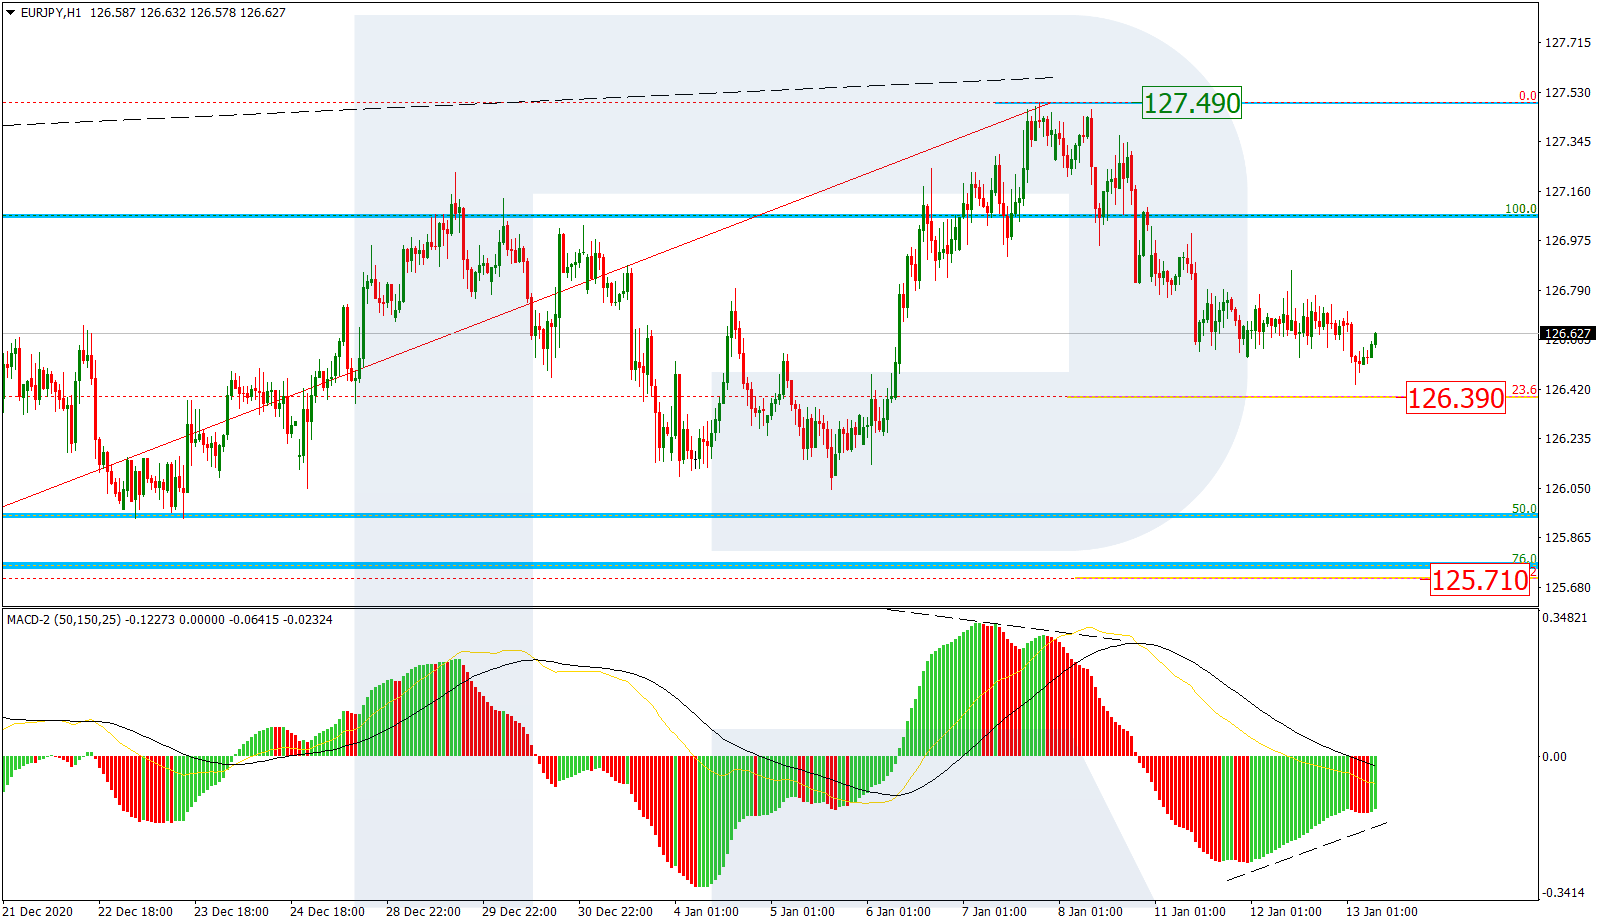
The H1 chart shows that the price is falling towards 23.6% fibo at 126.39. The next downside target may be 38.2% fibo at 125.71. A breakout of the local high at 127.49 will hint at further uptrend.

EURJPY_H1

Article By RoboForex.com

Attention!
Forecasts presented in this section only reflect the author’s private opinion and should not be considered as guidance for trading. RoboForex LP bears no responsibility for trading results based on trading recommendations described in these analytical reviews.

Murrey Math Lines 13.01.2021 (USDJPY, USDCAD)

Article By RoboForex.com

USDJPY, “US Dollar vs. Japanese Yen”

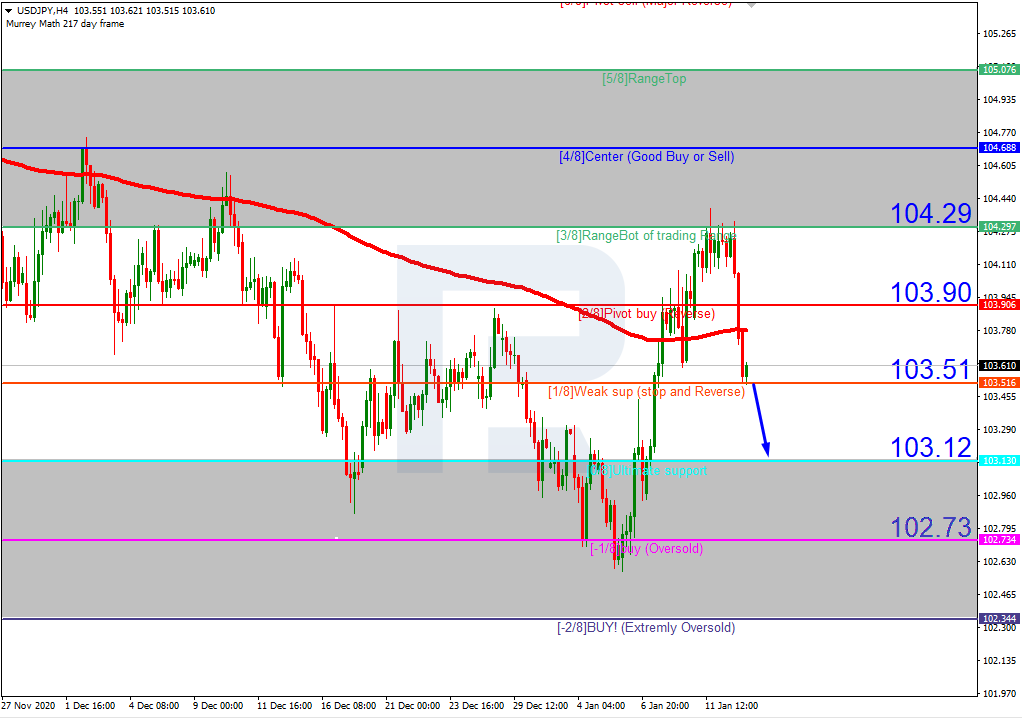
In the H4 chart, after rebounding from 3/8, USDJPY is expected to break 1/8 and then continue falling towards the support at 0/8. However, this scenario may no longer be valid if the price breaks 2/8 to the upside. After that, the instrument may continue growing to reach the resistance at 3/8.

USDJPY_H4
Risk Warning: the result of previous trading operations do not guarantee the same results in the future

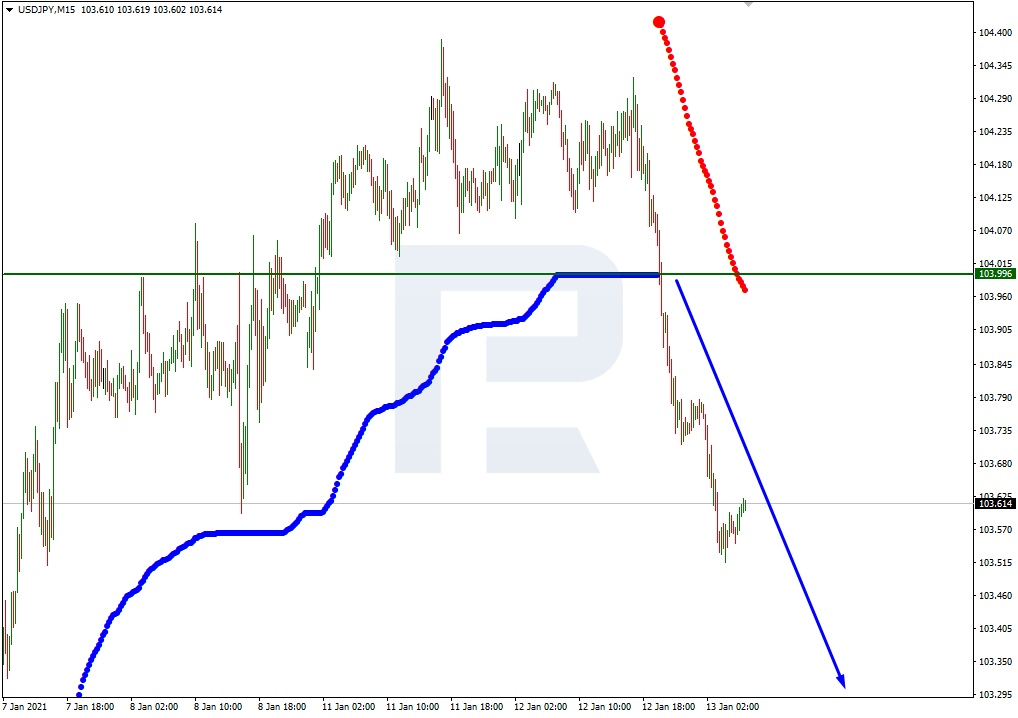
As we can see in the M15 chart, the pair has broken the downside line of the VoltyChannel indicator and, as a result, may continue moving downwards.

USDJPY_M15
Risk Warning: the result of previous trading operations do not guarantee the same results in the future

USDCAD, “US Dollar vs Canadian Dollar”

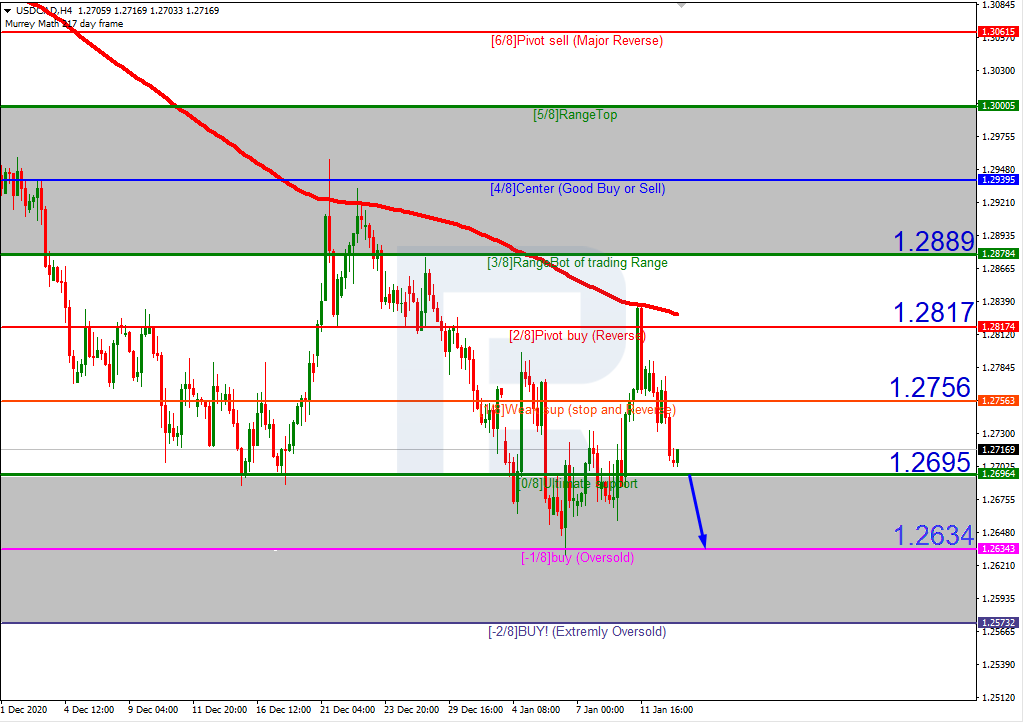
In the H4 chart, USDCAD is moving below the 200-day Moving Average, thus indicating a descending tendency. In this case, the pair is expected to break 0/8 and then continue falling towards the support at -1/8. Still, this scenario may no longer be valid if the price breaks 1/8 to the upside. After that, the instrument may reverse and correct to reach the resistance at 2/8.

USDCAD_H4
Risk Warning: the result of previous trading operations do not guarantee the same results in the future

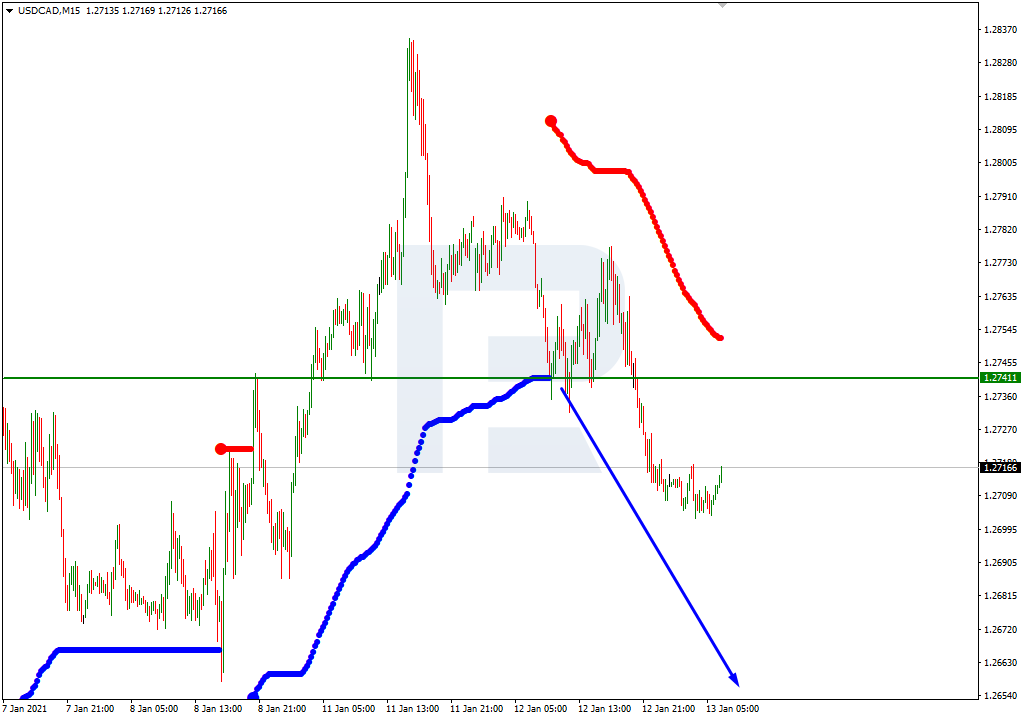
As we can see in the M15 chart, the pair has broken the downside line of the VoltyChannel indicator and, as a result, may continue trading downwards to reach -1/8 from the H4 chart.

USDCAD_M15

Article By RoboForex.com

Attention!
Forecasts presented in this section only reflect the author’s private opinion and should not be considered as guidance for trading. RoboForex LP bears no responsibility for trading results based on trading recommendations described in these analytical reviews.

Earnings Preview: JPMorgan Under the Spotlight

By Lukman Otunuga, Research Analyst, ForexTime

It’s that time of the year again!

Earnings season kicks off this week, with JPMorgan releasing its Q4 2020 earnings before the US markets open on Friday 15th January.

Bank stocks have marched into the New Year on a firm note, driven by some progress on the vaccine front and renewed hopes over global economic growth.

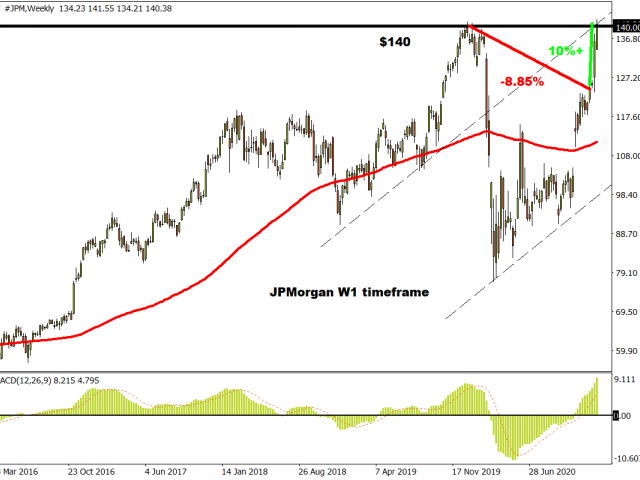
JPMorgan which boasts the biggest market capitalization of all US banks is up over 10% year-to-date, after concluding 2020 almost 9% lower.

Market expectations

Sentiment towards the American multinational investment bank will most likely be influenced by the pending earnings report on Friday. According to Bloomberg, the consensus earnings per share estimates stand around $2.62 per share on $28.65 billion in revenues. For a full year, earnings are projected to decline by almost 28% to $7.77 per share, while full-year revenues of 120.26 billion would increase by 1.32%.

Will history repeat itself?

2020 was a rough year for the banking sector as disruptions created by the the coronavirus pandemic hit consumers and businesses.

However, JPMorgan was able to deliver mixed results in Q3 as the company’s trading division saw revenue surge by 30%.

It will be interesting to see whether the US bank will replicate such a feat in the final quarter of 2020 – especially when factoring in the bullish performance in stock markets.

What to look out for

One of the key things to look out for in the earnings report will be the loan-loss provision – something that will indicate whether the lenders have regained confidence after the pandemic drained earnings.

Banks were under the mercy of lower interet rates last year while COVID-19 created extraordinary levels of uncertainty. Such resulted in weak consumer spending which dealt a painful blow to the consumer banking side of the business.

Taking a look at the technicals

Should earnings meet or exceed market expectations, this could boost buying sentiment towards JPMorgan shares in the near term.

Looking at the technical picture, JPMorgan shares are trading above $140 as of writing. There have been consistently higher highs and higher lows on the weekly timeframe while the MACD trade to the upside. A solid weekly close above $140 may open the doors to fresh all-time highs beyond $141.66.

Shifting our focus back to the fundamentals, the medium to longer term outlook may be heavily influenced by the pace of economic recovery which is linked to coronavirus infections and global vaccinations.

Disclaimer: The content in this article comprises personal opinions and should not be construed as containing personal and/or other investment advice and/or an offer of and/or solicitation for any transactions in financial instruments and/or a guarantee and/or prediction of future performance. ForexTime (FXTM), its affiliates, agents, directors, officers or employees do not guarantee the accuracy, validity, timeliness or completeness, of any information or data made available and assume no liability as to any loss arising from any investment based on the same.


Forex-Time-LogoArticle by ForexTime

ForexTime Ltd (FXTM) is an award winning international online forex broker regulated by CySEC 185/12 www.forextime.com

The Analytical Overview of the Main Currency Pairs on 2021.01.13

by JustForex

The EUR/USD currency pair

Technical indicators of the currency pair:
  • Prev Open: 1.2151
  • Prev Close: 1.2206
  • % chg. over the last day: +0.45%

On Tuesday, EUR/USD bounced off the support level, which casts doubt on the option with a deep correction. But the fundamental part is showing play on the side of the dollar over the medium term. The yield spread remains strongly widened in favor of US bonds.

Trading recommendations
  • Support levels: 1.2283, 1.2349
  • Resistance levels: 1.2130, 1.2059

The main scenario for EUR/USD trading is cautious buying on growth. A rebound from the support level and consolidation above the moving averages temporarily canceled the southern scenario. This possibility is indicated by the ADX, which reacted very weakly to Monday’s decline but rose sharply on Tuesday, demonstrating the presence of bullish strength. In this case, the pair can reach the price of 1.2283.

Alternative scenario: if the price can consolidate below 1.2172, the pair may return to 1.2130.

EUR/USD
News feed for 2021.01.13:
  • – 13:00 (GMT+2) Eurozone Industrial Production (MoM) (Nov);
  • – 16:30 (GMT+2) US Core Consumer Price Index (CPI) (YoY) (Dec);
  • – 16:30 (GMT+2) US Consumer Price Index (CPI) (MoM) (Dec).

The GBP/USD currency pair

Technical indicators of the currency pair:
  • Prev Open: 1.3510
  • Prev Close: 1.3661
  • % chg. over the last day: +1.11%

On Tuesday, sterling showed the largest daily gain since October last year. The driver of the northern movement was the Governor of the Bank of England’s statement, Andrew Bailey, about the undesirability of introducing negative interest rates. Since the market estimated the rate cut this year with a probability of 75%, sterling rebounded sharply after the bank’s statements.

Trading recommendations
  • Support levels: 1.3532, 1.3428
  • Resistance levels: 1.3702, 1.4386

The main scenario in GBP/USD is cautious buying on growth. Strong northern momentum reversed technical indicators. ADX has not yet reached the overvalued area, but it is close to it. In this case, a rollback from the resistance level is possible. But since the pair is near the highs of the year, caution should be exercised with long positions.

Alternative scenario: if the pair consolidates below the moving averages around 1.3580, the growth is likely to stop, and the pair will return to 1.3532.

GBP/USD
There is no news feed for today.

The USD/JPY currency pair

Technical indicators of the currency pair:
  • Prev Open: 104.24
  • Prev Close: 103.73
  • % chg. over the last day: -0.50%

On Tuesday, the USD/JPY quickly consolidated below the moving averages and broke through the support level. With this, the northern scenario was canceled. Fundamental analysis suggests a continuation of the downtrend as bond yields returned to decline. The stock market correction is still possible.

Trading recommendations
  • Support levels: 103.18, 102.89
  • Resistance levels: 103.90, 104.76

The main scenario is selling. On Tuesday, when falling, ADX showed a significant increase in bearish potential. As long as the pair is below the moving averages, the southern bias will remain in place. The pair will likely be able to reach the 103.18 level.

An alternative scenario assumes the price-fixing above the 103.90 – 104.06 area. In this case, the pair may return to growth up to 104.75.

USD/JPY
News feed for 2021.01.13:
  • – 16:30 (GMT+2) US Core Consumer Price Index (CPI) (YoY) (Dec);
  • – 16:30 (GMT+2) US Consumer Price Index (CPI) (MoM) (Dec).

The USD/CAD currency pair

Technical indicators of the currency pair:
  • Prev Open: 1.2781
  • Prev Close: 1.2709
  • % chg. over the last day: -0.57%

On Tuesday, the Canadian dollar was under significant pressure. The rise in oil prices and the decline in the dollar index completed the corrective pullback. Further growth with the current dynamics of the commodity market remained a big question.

Trading recommendations
  • Support levels: 1.2630, 1.2523
  • Resistance levels: 1.2797, 1.2875

The main scenario is selling. Technical indicators turned in the opposite direction, indicating the completion of the correction. ADX has grown significantly, showing a rise in the strength of the bears in the pair. The price consolidated below the moving averages, while the MACD returned to negative values. Thus, all indicators point south.

Alternative scenario: if the price manages to consolidate above 1.2797, the pair may return to 1.2875.

USD/CAD
There is no news feed for today.

by JustForex


This article reflects a personal opinion and should not be interpreted as an investment advice, and/or offer, and/or a persistent request for carrying out financial transactions, and/or a guarantee, and/or a forecast of future events.

What’s been moving Gold prices?

By Han Tan, Market Analyst, ForexTime

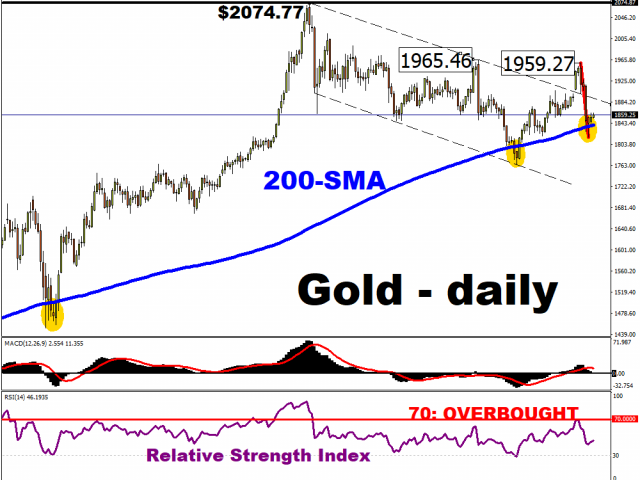
Gold prices are enjoying some relief, after falling by more than 7% from the two-month high of around $1960 that it posted last week. On a week-to-date basis, spot Gold is eking out a 0.6 percent advance at the time of writing. The slight recovery has pared Gold’s year-to-date losses to less than 2%.

From a technical perspective, Bullion’s 200-day simple moving average (SMA) has been called into action once more, playing its role as a key support level. Gold bulls can take comfort from the fact that, since the end of 2018, prices have been trading consistently above its 200-SMA, and the two dips below that line over the past 12 months have been short-lived.

In other words, Gold’s uptrend that extends back to 2018 remains intact, with the 200-SMA having been a reliable support level.

Also note that the pullback which began last week could be deemed a healthy move from a technical perspective, considering that Gold’s 14-day relative strength index had reached overbought status by hitting the 70 mark.

With much of the froth now seemingly cleared, the precious metal may now make a more rational move higher.

Still, spot prices may have to clear that November high of $1965.46 to embolden Gold bulls further.

How is Gold affected by the Dollar and Treasury Yields?

Note that Gold has an inverse relationship with the Dollar, given that the precious metal is priced in USD. In simpler terms, when the Dollar goes down, Gold prices tend to go up, and vice versa.

Also note that Gold is a zero-yielding asset.

When the yields on US Treasuries climb, they make such investments more attractive relative to the zero-yielding Bullion. This could result in a rotation away from Gold to Treasuries, with the latter widely deemed to be a risk-free investment.

With such a context in mind, the recent pullback in Gold prices was the result of a Dollar rebound amid surging Treasury yields.

The 10-year Treasury yields strained towards the psychologically-important 1.20 percent level, after surging 30 percent between the past two Tuesdays (5 – 12 January), reaching its highest levels since March in the process. Since then, the 10-year yields have retreated by about 6.4 percent, while the Dollar index has moderated back below the 90 mark, offering some respite for Gold.


What is the outlook for Gold?

There appears to be enough reasons to remain bullish on Gold, and they revolve around US inflation.

  • Markets are expecting US inflation to overshoot, with the Federal Reserve stating it will tolerate as such. Considering Gold’s traditional role as a hedge against faster inflation, that should ensure Gold remains well-bid in the lead up to such economic conditions.
  • Real yields for US Treasuries (which take into account expectations for inflation) are in negative territory, which suggests that the yields that investors are expecting to get from US Treasuries aren’t going to overcome the forecasted inflation rate. This should ensure that Gold can maintain its allure as an inflation-beater.
  • There is also a consensus that we could see more Dollar weakness over the coming months, despite rising US yields recently challenging such a narrative. A weaker Dollar should make it easier for Gold prices to explore its upside.

Things to look out for this week:

  • The December US inflation data is due out later Wednesday. A higher-than-expected print may fuel tailwinds in Gold prices.
  • Watch Fed chair Jerome Powell’s speech on Thursday. Recently, there has been some contrast among Fed officials’ views on when to pare back the central bank’s asset purchasing programme (a way to support the economy and financial conditions). The mere suggestion that the Fed could ease up on those asset purchases sometime this year has spurred Treasury yields higher. Then on Tuesday, St. Louis Fed President James Bullard and Boston Fed President Eric Rosengren poured cold water on the idea, prompting Treasury yields to pare down recent gains. Watch for more potential cues out of Powell.
  • Also on Thursday, President-elect Joe Biden is set to unveil his plans for more US fiscal stimulus which he claims would be in the “trillions”. Such swathes of incoming financial aid for the US economy could spur inflationary pressures higher. Should Gold bulls be delighted by what they hear, don’t be surprised to see Gold prices charging upwards.


Disclaimer: The content in this article comprises personal opinions and should not be construed as containing personal and/or other investment advice and/or an offer of and/or solicitation for any transactions in financial instruments and/or a guarantee and/or prediction of future performance. ForexTime (FXTM), its affiliates, agents, directors, officers or employees do not guarantee the accuracy, validity, timeliness or completeness, of any information or data made available and assume no liability as to any loss arising from any investment based on the same.


Forex-Time-LogoArticle by ForexTime

ForexTime Ltd (FXTM) is an award winning international online forex broker regulated by CySEC 185/12 www.forextime.com

The dollar rose in anticipation of industrial volume data of the Eurozone and GDP in Germany. The stock market continues to cons

by JustForex

It looks like the market has taken a break ahead of European economic growth numbers, which will be released on Thursday. Germany has a rather sluggish start in 2021, and the numbers have deteriorated significantly since November 2020. Job losses have accelerated. If in November it reached -17%, then in early January the numbers show -52.3%. The volume of trade and entertainment services fell by 63%.

Investors expect that GDP contraction will be less than 6% by the end of 2020. This is a key number. If the data comes out worse, economists may revise the growth rate in the first quarter of 2021 downward, and the market may be unsettled.

The stock market, pending the statistics, stalled near the highs with the likelihood of a southern correction, as the yield on Treasury bonds is declining. One of the drivers of the fall in Treasury yields was FRS member James Bullard’s statements, who tried to dispel doubts about long-term soft monetary policy. In his speech on Tuesday, he said that overcoming the pandemic remains a policy priority; a view later echoed by Boston Fed chief Eric Rosengren.

However, not the entire market responded to the comments. If 10-year bonds went down, then 2-year bonds are confidently holding near the January highs, which slightly narrowed the spread between 10-year and 2-year bonds.

The dollar index fell against the background of comments from FRS members. The British pound showed record-breaking growth against the dollar. Sterling bulls reacted positively to the Governor of the Bank of England’s statements, Andrew Bailey, who criticized the rate cut to negative values. According to him, the negative area is undesirable and will cause many problems. Options in February fell, while sterling returned to January highs.

Main market quotes:

S&P 500 (F) 3,799.88 +5.38 (+0.14%)

Dow Jones 31,068.69 +60.00 (+0.19%)

DAX 13,949.05 +23.99 (+0.17%)

FTSE 100 6,761.28 +7.17 (+0.11%)

USD Index 90.120 +0.056 (+0.06%)

Important events:
  • – 13:00 (GMT+2) Eurozone Industrial Production (MoM) (Nov);
  • – 16:30 (GMT+2) US Core Consumer Price Index (CPI) (YoY) (Dec);
  • – 16:30 (GMT+2) US Consumer Price Index (CPI) (MoM) (Dec).

by JustForex


This article reflects a personal opinion and should not be interpreted as an investment advice, and/or offer, and/or a persistent request for carrying out financial transactions, and/or a guarantee, and/or a forecast of future events.

Will gold complete its near 10% drop this month?

By Admiral Markets

Since gold’s impressive +40% rally from the March lows after the coronavirus pandemic, it peaked in August last year before falling 15% for the rest of the year, as the weekly chart shows below. Since December, gold bulls tried to push the price of the yellow gold higher in anticipation of the typical seasonal rally in January.

Source: Admiral Markets MetaTrader 5, Gold, Weekly – Data range: from Jul 16, 2021, to Jan 12, 2021, performed on Jan 12, 2021, at 7:30 pm GMT. Please note: Past performance is not a reliable indicator of future results. 


Last five-year performance: 2020 =  +25.13%, 2019 = +18.30%, 2018 = -1.60%, 2017 = +13.17%, 2016 = +8.55%, 2015 = -10.30%.

However, after a push higher for the first few days of the year gold found technical resistance at the 1,950.00 price level which was around the high of November 2020. In the daily chart below, the horizontal resistance line caused buyers to exit and sellers to step in, as shown by the bearish engulfing candle in the yellow box.

Source: Admiral Markets MetaTrader 5, Gold, Daily – Data range: from Apr 29, 2021, to Jan 12, 2021, performed on Jan 12, 2021, at 7:30 pm GMT. Please note: Past performance is not a reliable indicator of future results. 


While the market is currently experiencing high levels of volatility, it seems as though sellers are in control for now. Taking a bigger picture perspective from the weekly chart there is potential for gold to fall back down to key support around the 1,765 price level.

This horizontal support line, shown by the dotted line in the weekly chart below, also corresponds closely to the ascending trend line support shown by the thick black line below.

Source: Admiral Markets MetaTrader 5, Gold, Weekly – Data range: from Jul 16, 2021, to Jan 12, 2021, performed on Jan 12, 2021, at 7:30 pm GMT. Please note: Past performance is not a reliable indicator of future results. 


A fall back to these support levels would represent a near 10% drop since the rejection of November 2020’s high earlier this year. While January tends to be a seasonally bullish period for gold and other metals, investors are currently favouring stock market returns with US indices and the DAX 30 trading at record highs.

The US dollar has also started a potential short-covering rally higher after months of declines. That could also pressure gold towards the downside as traders favour the US dollar once more. However, the levels are clear on where to operate from with patience and discipline required to navigate such volatility.

Did you know that you can use the Trading Central Technical Ideas Lookup indicator to find actionable trading ideas on this index and thousands of other instruments across Forex, stocks, indices, commodities and more?

You can get this indicator completely FREE by upgrading your MetaTrader 5 trading platform provided by Admiral Markets UK Ltd to the exclusive Admiral Markets Supreme Edition! You’ll also receive a whole range of advanced trading tools such as correlation and sentiment indicators!

Start your free download by clicking on the banner below:

Download MetaTrader 5 Supreme Edition

INFORMATION ABOUT ANALYTICAL MATERIALS:

The given data provides additional information regarding all analysis, estimates, prognosis, forecasts, market reviews, weekly outlooks or other similar assessments or information (hereinafter “Analysis”) published on the website of Admiral Markets. Before making any investment decisions please pay close attention to the following:

1.This is a marketing communication. The content is published for informative purposes only and is in no way to be construed as investment advice or recommendation. It has not been prepared in accordance with legal requirements designed to promote the independence of investment research, and that it is not subject to any prohibition on dealing ahead of the dissemination of investment research.

2.Any investment decision is made by each client alone whereas Admiral Markets UK Ltd (Admiral Markets) shall not be responsible for any loss or damage arising from any such decision, whether or not based on the content.

3.With view to protecting the interests of our clients and the objectivity of the Analysis, Admiral Markets has established relevant internal procedures for prevention and management of conflicts of interest.

4.The Analysis is prepared by an independent analyst Jitan Solanki, Freelance Contributor (hereinafter “Author”) based on personal estimations.

5.Whilst every reasonable effort is taken to ensure that all sources of the content are reliable and that all information is presented, as much as possible, in an understandable, timely, precise and complete manner, Admiral Markets does not guarantee the accuracy or completeness of any information contained within the Analysis.

6.Any kind of past or modelled performance of financial instruments indicated within the content should not be construed as an express or implied promise, guarantee or implication by Admiral Markets for any future performance. The value of the financial instrument may both increase and decrease and the preservation of the asset value is not guaranteed.

7.Leveraged products (including contracts for difference) are speculative in nature and may result in losses or profit. Before you start trading, please ensure that you fully understand the risks involved.

By Admiral Markets