Once again, fiscal stimulus takes centre stage

By Hussein Sayed, Chief Market Strategist (Gulf & MENA), ForexTime

Investors do not seem bothered by Washington’s political turmoil. Trump became the first US President to be impeached twice, a little more than a year since his first. While he will most likely continue to serve the remaining six days of his term, his political future is now uncertain with a high possibility that he is barred from running for the presidency again if he is found guilty of incitement of insurrection.

Global equity markets inched slightly higher on the (second) impeachment day with US stocks continuing to hover near their record highs. Political noise is apparently of the least concern to investors who are looking forward to strong economic growth in 2021 and another big stimulus package from the new US administration.

According to Biden aides, the President-elect is set to reveal his plans for a COVID-19 relief package later today, which is likely to be somewhere near $2 trillion. The package will include significant funding for vaccine distribution, an extension to eviction moratorium, support for the unemployed, government aid and another sizable direct payment to American families. The latter is likely to be the trickiest part as most Republicans and some Democrats are against going too big. On the other hand, opting for a small package will disappoint investors and lead to profit-taking in equity markets. Finding the right balance will not be easy.

While political instability in Washington has so far been ignored, there remains a risk of profit-taking if violence on inauguration day escalates, especially as markets are almost priced to perfection. With valuations extremely overstretched, some investors need an excuse to book their profits and 20 January may provide this.

Another risk investors need to keep an eye on is how high bond yields go from here. The good news is we are not yet seeing significant inflationary pressure reflecting in data. US consumer prices rose 0.4% in December and when excluding volatile food and energy components, prices only rose 0.1%. Overall, rising inflation will be one of the hottest topics in 2021, but it’s too early for the Fed to announce any tapering of asset purchases. Any signs of this may bring an end to the Dollar’s decline as higher yields begin to attract Dollar inflows and make equities valuations harder to justify. This will be a topic to explore in detail later in the year. However, it will be interesting if the Fed’s Chair Jerome Powell provides any hints on this topic later today on a webinar hosted by Princeton University.

Disclaimer: The content in this article comprises personal opinions and should not be construed as containing personal and/or other investment advice and/or an offer of and/or solicitation for any transactions in financial instruments and/or a guarantee and/or prediction of future performance. ForexTime (FXTM), its affiliates, agents, directors, officers or employees do not guarantee the accuracy, validity, timeliness or completeness, of any information or data made available and assume no liability as to any loss arising from any investment based on the same.


Forex-Time-LogoArticle by ForexTime

ForexTime Ltd (FXTM) is an award winning international online forex broker regulated by CySEC 185/12 www.forextime.com

Crude Rally Continues On EIA Drawdown

By Orbex

Inventories Fall Again

Crude prices have continued higher this week. The market extended its 2021 gains by a further 4%.

Crude prices were helped higher this week by the latest report from the Energy Information Administration.

The EIA reported that in the week ending January 8th, the total level of US crude inventories decreased by a further 3.2 million barrels. This marks the third consecutive weekly decline in crude levels.

It also takes stockpiles back down to 482.2 million barrels, just 8% above their five-year seasonal average.

Gasoline & Distillate Stockpiles Higher

Despite the decrease in the headline crude level, the report showed that gasoline inventories were higher by 4.4 million barrels over the week, extending the surplus recorded over recent weeks.

Gasoline inventories are now sitting around 1% above their five-year seasonal average. Distillate stockpiles were also higher over the week.

These increased by 4.8 million barrels to take the total inventories level back up to around 9% higher than their five-year seasonal average.

Elsewhere, the report showed that US crude oil imports averaged 6.2 million barrels per day over the week, an uptick of just under 1 million barrels per day.

Looking back across the last four weeks, US crude oil imports have averaged 5.6 million barrels per day. This is 14.9% lower than the same four week period a year earlier.

USD Rally a Threat

The resurgence in the US dollar over recent days has taken some of the steam out of the rally in crude prices.

However, with traders looking ahead to the prospects of increased US fiscal stimulus, the greenback looks vulnerable to further downside.

This should keep oil prices supported in the near term.

Two Way Risks From COVID

The COVID backdrop is also a key issue for oil traders.

Currently, the market is caught between two things:

  1. The sharp, near-term risks from ongoing lockdowns and travel restrictions, which threaten demand, and
  2. Optimism linked to the vaccine program and the hopes that developed economies will begin returning to normal in Q2.

Crude Approaching Key Resistance Area

crude oil

The rally in crude, which has now blown well above the recent 49.30 level, is now fast approaching key technical resistance.

The 54.48 level above the market comes in just ahead of the bearish trend line from 2018 highs, with the longer-term bearish trend line from 2014 highs just above that.

This is likely to be a difficult area for bulls and some correction lower is likely. While price holds above the 49.30 support, however, the bias remains bullish.

By Orbex

How To Rewire Your Brain For Successful Trading

By Orbex

– As a forex trader, you are probably always on the lookout for the next tool that can help advance your trading plan, sharpen your strategy, and keep you at the forefront of your field.

However, has it occurred to you that the most useful tool readily available to you is your brain? And have you considered the advantages of reprogramming it to work to your advantage?

Here, we will discover how to build the habits and patterns that will ultimately lead you to forex trading success.

Our brains are in a constant state of flux. And it is this incredible ability to change and adapt that neuroscientists call Neural Plasticity.

So, what is neural plasticity, and how does it affect your daily life?

Your brain is more malleable than you think, with all your daily experiences shaping and reshaping it by the second.

A fascinating organism, the brain is made up of an estimated 100 billion neurons. These neurons are responsible for creating a total of 100 trillion neural connections. This is considering that each neuron may be connected to 10,000 others. That’s a lot of brain power that you can use to your advantage and trading success.

The connections between these brain neurons are called neural pathways. The more we think about or practice certain things, the stronger the related neural pathways will become.

Say for instance, that you tend to sleep in daily but would like to start an early morning exercise routine. By taking concrete steps to start exercising at 7 am, you will slowly build the habit of becoming an early riser. This will entail meeting with a personal trainer for example, buying new fitness gear, and going to sleep a little earlier each night. By committing to these actions every day, you are forging the path for stronger neural pathways, until it becomes a hardwired habit to wake up at 6 am and start your exercise by 7.

Likewise, when aiming to create a new fx trading routine, the actions you take daily will slowly begin to rewire your brain.

To support this, and according to the neuroscientist Michael Merzenich from the book “The Brain That Changes Itself” written by Norman Doidge, by practicing a habit under the right conditions, you can change hundreds of millions, and possibly billions of the connections between the nerve cells in your neural pathways.

How does this apply to forex or stock trading?

Forming the habits that determine your success in any endeavor requires persistent action. This will lead to forming new neural pathway connections, strengthening existing ones and weakening the connections no longer in use.

This means that by practicing healthy trading habits, you can start to let go of any destructive behaviors which have been holding you back and build a helpful routine to support your trading plans and strategies.

How you can start to build stronger neural connections

  • Incorporate positive emotions

Fuel your thoughts and actions with strong positive emotions. This gives your thoughts the power to engage your neural pathways. For example, when closing a winning trade or having a good trading day, focus on the positive emotions related to this win, and even share it with your family or friends.

  • Practice makes perfect

You can strengthen the new neural pathways that you have created into concrete habits through repetition and continued practice. Think about your trading goals and strategy; feel the joy of achieving these goals; and then put your strategy into action.

  • Visualize your accomplishments

Our brains cannot really tell the difference between something real or imagined. Research shows that every time you are thinking, you engage and strengthen the neural pathways connected to whatever you’re thinking about.

So, spend a few minutes visualizing your trades. Decide that you will succeed at a set number of CFD trades for example today, and then set out to make it happen.

  • Meditate

Meditation aims at disengaging the busy mind and allowing access to a much quieter state of being.

When you are stressed, your mind instinctively relies on the strongest neural pathways, and looks for the path of least resistance. Yet, to fully benefit from neural plasticity and succeed in creating different habits, you need to turn off your stress response, and stimulate the relaxation response.

For example, if you would normally let your trades run for too long, learn where to place the appropriate stop loss orders to minimize your risk. Or if you tend to compulsively check the news every 5 minutes, learn to let go and relax every once in a while.

When practiced daily, there are countless benefits to meditation. It promotes higher brain plasticity and leads to healthier cognitive and emotional processing. And we all know how important it is to steer clear of emotional trading!

In conclusion

The secret to sustained success lies in repetition. Whatever you focus on will surely flourish and grow.

These are general tips that you can apply in your daily life to focus your mind and rule out distractions. When you apply them to your forex trading, you will be pleasantly surprised at how effective these tricks may be.

Reference: Neural Plasticity: 4 Steps to Change Your Brain & Habits by Dr. Hilary Stokes & Dr. Kim Ward

By Orbex

What does Trump’s impeachment mean for markets?

By Han Tan, Market Analyst, ForexTime

President Donald Trump has been impeached by the House in the aftermath of last week’s riots on Capitol Hill. Trump now has the unenviable mark of being the only US President to be impeached twice, occurring just days before he is to hand over the reins of the White House to President-elect Joe Biden on 20 January.

Yet markets cared little for the political drama, as US stocks continue to struggle for meaningful direction.

Here’s how US benchmark indices fared on Wednesday, with tech counters leading the pack:

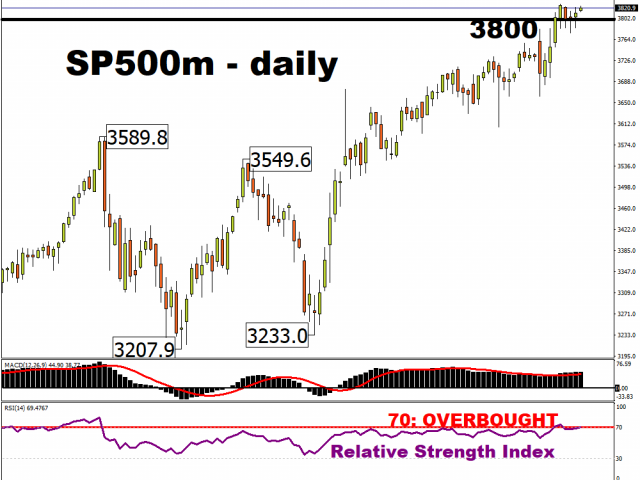
At the time of writing, S&P 500 futures can only inch higher, although it continues flirting with overbought territory (14-day relative strength index nearing the 70 mark).

However, US equities may receive a double boost on Thursday!

Biden to unveil stimulus plan details

The incoming US President has been teasing global investors about the “trillions” that could be poured into the US economy to help it overcome the pandemic. Such measures are set to be announced later today, which may include US$ 2000 stimulus checks for American households. A stubbornly high weekly jobless claims print, also due on Thursday, could underscore the need for more fiscal stimulus.

Stock markets had clearly reveled at the thought of more incoming US fiscal stimulus, especially in light of Democrats enjoying significantly less political resistance after winning both Georgia Senate runoffs. The S&P 500’s current record high was registered on 8 January, the same week those polls concluded.

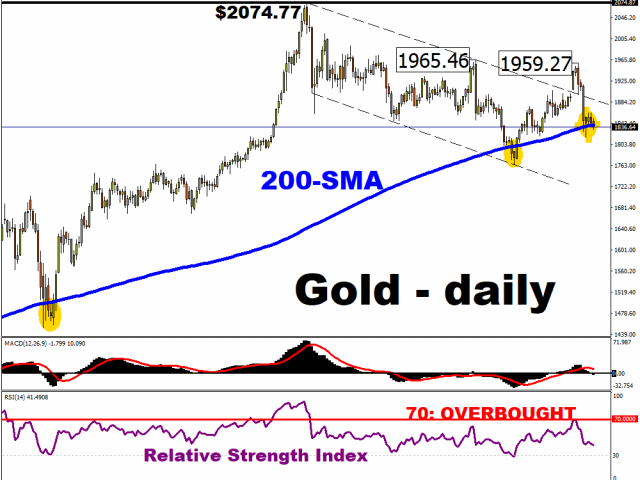
Should markets like what they hear, then the reflation trade may resume across asset classes, potentially recharging the rotation play in equities while sending Gold higher as investors resort to assets that may help them outpace stimulus-fueled inflationary pressures.


Fed Chair to settle tapering debate?

Fed Chair Jerome Powell also has the opportunity to lay down a solid marker in the tapering debate that has engulfed markets his past week. Given the forward-looking nature, markets have been trying to pre-empt when the Federal Reserve might ease up on their bond-buying programme. Markets thought it could even happen sometime this year, in anticipation of a US economic outperformance that’s been aided by the trillions in both fiscal and monetary policy support.

The shift in narrative sent Treasury yields spiking, Gold prices stumbling, and the Dollar rebounding.

Fed officials have recently sent mixed signals about when they might unwind some of their policy support, although the latest commentary by Fed Governor Lael Brainard appears to pour cold water on the idea.

A more definitive statement by the Fed Chair himself could cause major moves across asset classes.

Should Powell shut the door tight on the very notion of tapering in 2021, that could see Treasury yields unwinding more of their gains, dragging the Greenback back down with it, while helping restore Bullion to recent highs.


Disclaimer: The content in this article comprises personal opinions and should not be construed as containing personal and/or other investment advice and/or an offer of and/or solicitation for any transactions in financial instruments and/or a guarantee and/or prediction of future performance. ForexTime (FXTM), its affiliates, agents, directors, officers or employees do not guarantee the accuracy, validity, timeliness or completeness, of any information or data made available and assume no liability as to any loss arising from any investment based on the same.


Forex-Time-LogoArticle by ForexTime

ForexTime Ltd (FXTM) is an award winning international online forex broker regulated by CySEC 185/12 www.forextime.com

BAN SILJ Trade Recap

By TheTechnicalTraders

After recently closing our SILJ BAN trade, we want to take this opportunity to dissect our trade, including the process of selecting the proper exit targets and protecting capital within a trade.  The BAN Trader Pro strategy incorporates these same techniques automatically within the decision-making process of taking/generating trades/signals.  Yet, many traders can find value in reviewing their completed trades to learn how to improve their trading picks and techniques.


With our recent SILJ trade, we initiated the entry on the upside breakout in price on November 5, 2020 – near $15.50.  This upside breakout move prompted a new BAN trade trigger with SILJ near the top of the BAN Hotlist.  This suggested further upside trending would continue.

The COVID-19 vaccine news was announced shortly after we entered the trade, which took the momentum out of this bullish trend.  The immediate downturn in price activity resulted in our SILJ trade staying below our entry price for more than 30 days.  We had properly allocated capital into the trade because of risk factors and our initial stop was setup below recent low price levels (ON CLOSE).  You can review the initial SILJ BAN Trade trigger message below:


The lessons to take away from this SILJ trade recap are:

  1. Trust your system/strategy and make sure you are following the system rules 100%.
  2. Let your trades work out for you (or not) and then revisit them to determine if your rules/strategy operated properly throughout the trade.
  3. When your system/strategy was successful with a trade, use this success to attempt to learn how to improve successful trading processes or how to better reduce risk.
  4. When your system/strategy was NOT successful with a trade, it is very important to FOCUS on these losers to learn if your strategy is efficiently capable of managing risk and/or a series of losses.

Trading systems are designed to attempt to generate profits by making a series of quantitative computations and real-time decision making.  I have learned to focus on attempting to improve the success of my system/strategies, but I’ve also learned that I must continue to “focus on failures”.  Doing so helps me to develop ways to improve inefficiencies or failures in my strategy and also helps to improve the long-term success of my system/strategy.

This SILJ trade worked out very well, albeit a little longer than expected because of the vaccine news.  After watching the price move lower after our entry trigger, the momentum in price continued to support price above recent lows.  This is the key strength of the BAN Trader Pro strategy.  It not only attempts to find great entry triggers, but it also ranks symbols based on key momentum metrics so we are always attempting to trade the “Best Assets Now”.  The COVID-19 vaccine news disrupted the momentum in this SILJ trade but did not disrupt it enough to represent a full Stop Loss.

Over 30+ days, SILJ recovered into a solid momentum base and began another rally near December 7, 2020.  This prompted a solid price rally that reached our first Target level (#1).  At that point, our BAN system moved the stop level to the entry price – eliminating all the remaining risk in the trade.

After Target #1 was reached, SILJ rolled lower again and was recently stopped out with a solid 11% gain in the trade from the first target.  Of course, we would have wanted this SILJ trade to continue higher and rally to $25 or more, but sometimes trades don’t rally 20~35% every time.

The important concept to take away from this is that it was a trade with a process that worked to generate profits and protect against risk.  We’ll share more trade recaps as BAN Hotlist trades are closed.  Some of these trades have rallied more than 20% recently – so there are some really solid 20~35% trends out there.  It is just a matter of being able to execute your strategy/system with confidence and let the system tell you what to trade and when.

One of the first rules of system/strategy trading is “follow the rules of your system 100% – all the time”.  This is what the BAN Trader Pro strategy is all about.  It is a quantitative process that allows us to find and execute the best trades in the best-performing assets as new trend triggers are generated.  All we have to do is “follow the system” and “stay true to the rules 100% of the time”.  If you want to learn how to find the Best Asset Now to trade yourself without any proprietary indicators or tools, then join my Free BAN Strategy webinar. The BAN strategy has been developed to trade in any bullish or bearish major trend – so we will always find opportunities in the markets over the longer-term.

We like to share successful trading processes, strategies, and techniques using real trading examples and hope this helps you better understand how to develop efficient trading strategies/rules for your own use. If you want to learn more about my BAN Trader Pro newsletter service, including how to get access to my members’ only daily pre-market video analysis, BAN Hotlist updates, and BAN trade alerts then visit www.TheTechnicalTraders.com/BAN.

Happy Trading!

Chris Vermeulen
Chief Market Strategist

TheTechnicalTraders.com

deVere’s dVAM launches new equity fund with Columbia Threadneedle Investments

By George Prior

One of the world’s largest independent financial advisory and fintech organisations, deVere Group, has launched a new global equity fund to seek out companies with a sustainable competitive advantage under its dVAM brand.
Managed for dVAM by Columbia Threadneedle Investments, Global Equity Focus Strategy is the latest offering from deVere’s investment product advisory division that was established in 2018.
Nigel Green, deVere Group CEO, says: “We’re extremely pleased that deVere has leveraged its considerable size and strength within the industry to bring this exclusive fund to market.
“This low-cost dVAM fund will use the extensive global resources and expertise of Columbia Threadneedle Investments to find those quality companies with a sustainable edge that are able to continually grow their earnings above the market.
“This, together with our existing suite of products from major global financial institutions, will help best-position our clients to be able to achieve their medium to long-term financial objectives.”
Client Portfolio Manager at Columbia Threadneedle Investments, Andrew Harvie, notes: “The Global Equity Focus Strategy is a concentrated, high conviction global equity strategy which has a differentiated quality approach where the focus is on understanding the source of and risk to a company’s competitive advantage.”
He adds: “Combined with a deep regional research expertise, this allows us to create a best ideas portfolio from across the globe which is unconstrained by regional boundaries. This investment philosophy has delivered excellent performance and is 5-star rated by Morningstar.”
The team applies Porter’s Five Forces to assess how a market supports durable competitive advantages. These Forces are the threat of new entrants, the threat of substitutes, the bargaining power of customers, the bargaining power of suppliers, and competitive rivalry.
These can enable companies to sustain above-average growth, and high or improving returns on capital.
The deVere CEO concludes: “The launch of Global Equity Focus Strategy underscores again our ongoing commitment to our clients of bringing new defined, clear and better value solutions to market.”

About:

deVere Group is one of the world’s largest independent advisors of specialist global financial solutions to international, local mass affluent, and high-net-worth clients.  It has a network of more than 70 offices across the world, over 80,000 clients and $12bn under advisement.

Here’s Why Blind Contrarianism Failed in 2020

There is only one instance when the investing crowd is right

By Elliott Wave International

Yes, there are many times when the market’s Elliott wave structure suggests that an investor should take a position “against the crowd,” or put another way, be a contrarian.

Prime examples are at market bottoms and tops.

However, keep this in mind from a classic Global Market Perspective, a monthly Elliott Wave International publication which provides analysis of 50-plus worldwide markets:

[S]trict adherence to the wave model habitually puts wave analysts where they should be: against the market crowd. But not always. At specific points in the market’s wave structure, wave analysts run with the herd.

A prime example of when Elliott wave practitioners have a lot of company is during the most severe part of a bear market. At such times, the Elliott wave model suggests that more downside is likely ahead and the crowd is likewise fully aware that the market is in the grip of a ferocious bear. The same applies to the strongest part of a bull market.

So, following the Elliott wave model and consistent contrarianism are not the same.

Indeed, read this quote from our just-published January Global Market Perspective:

Blind contrarianism failed in 2020, because some of the world’s most influential benchmarks — the DJIA in the United States, the DAX in Europe, and the Shenzhen Composite in China — spent much of the year rallying in small-degree third waves.

That issue of the Global Market Perspective went on to show this chart and said:

Turns out that 2020 was not just a bad year for contrary investing, it was the strategy’s worst year on record.

The contrary strategy’s best years are also illustrative. The technique returned 80% as the first technology bubble burst in 2000, and it made 60% in 2009, as equities rallied following the 2008-09 financial crisis. The year 2016 was also a good year for contrarians who wagered that cyclical stocks would benefit most from an economic expansion.

What about major global markets in 2021? Will contrarian investing be successful for the market or markets in which you are interested? In other words, should you be selling when others are buying, and vice versa?

Elliott wave analysis can help you answer those questions.

As the Wall Street classic book, Elliott Wave Principle: Key to Market Behavior, by Frost & Prechter, says:

Without Elliott, there appear to be an infinite number of possibilities for market action. What the Wave Principle provides is a means of first limiting the possibilities and then ordering the relative probabilities of possible future market paths. Elliott’s highly specific rules reduce the number of valid alternatives to minimum.

If you’d like to find out about “Elliott’s highly specific rules,” you can do so by reading the online version of Elliott Wave Principle: Key to Market Behavior for free.

That’s right — Elliott Wave International has made this Wall Street classic available to Club EWI members for free. Don’t worry — membership is also free. Moreover, Club EWI members enjoy free access to a wealth of Elliott wave educational resources.

Join the approximately 350,000 Club EWI members who are already gaining insights into trading and investing from an Elliott wave perspective by following this link: Elliott Wave Principle: Key to Market Behavior (free access now).

This article was syndicated by Elliott Wave International and was originally published under the headline Here’s Why Blind Contrarianism Failed in 2020. EWI is the world’s largest market forecasting firm. Its staff of full-time analysts led by Chartered Market Technician Robert Prechter provides 24-hour-a-day market analysis to institutional and private investors around the world.

Republicans Turn On Trump

By Orbex

Reality Hits Tremulous Dollar

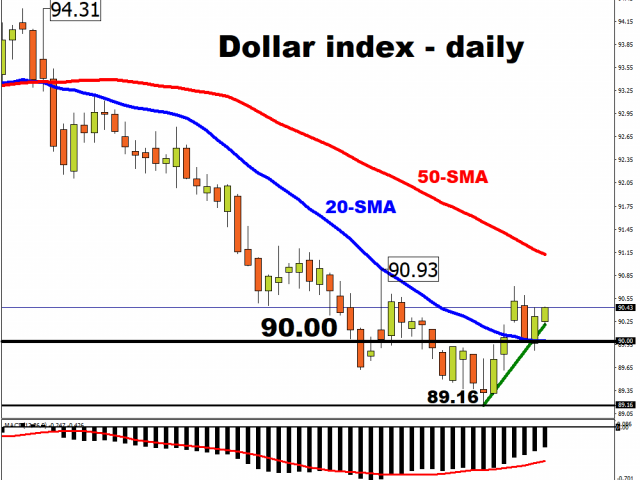
The dollar index fell 0.54% lower yesterday as it once again touched the 90 level.

The recent rally paused as the dollar shed some ground for the first time after four consecutive daily gains.

Investors looked past the potential impeachment of President Trump, focusing instead on the likely increase of fiscal stimulus under a Biden administration and the impact on inflation expectations.

This comes after the third most senior Republican, Liz Cheney, said she would vote to impeach Donald Trump over last week’s Capitol riot.

The House plans to vote today to charge Mr. Trump with inciting insurrection, which would make him the first US president ever to be impeached twice.

Euro Breaks Back

The euro managed to climb 0.45% higher on Tuesday, pushing back through the 1.22 ceiling.

Investors dumped their dollars yesterday, leading to a slight rally on the EURUSD pair.

This comes despite analysts predicting a sharp contraction in the first quarter of the year, with further Covid-19 restrictions taking their toll.

Double-dip recessions could be a common thing going into the start of the new year, as we await today’s industrial production numbers to lift spirits.

Sterling Pushes for 2-Year Highs

The pound had a day to remember yesterday, jumping over 1% as it reached for the 1.37 handle.

With the Bank of England ruling out negative interest rates, the governor said that quantitative easing would continue this year, with a further £150bn of asset purchases in the pipeline.

Mixed Day for Indices

The three major US indices all traded towards breakeven status on Tuesday.

This comes as several major tech giants continued to slide after sharp declines at the start of the trading week.

Twitter and Facebook continue to feel the brunt of the sell-off, as both stocks fell by over 2%.

Tesla shares rallied once again, as the stock remains near all-time highs.

Gold Begins Recovery

Gold closed 0.58% higher on Tuesday as the upturn begins after last week’s collapse.

The greenback’s decline is keeping bulls hopeful, amid expectations of a multitrillion-dollar stimulus likely to be announced by President-elect Joe Biden soon.

Added to the pandemic numbers and the civil unrest, could we see the yellow metal make a full retracement?

Oil at 11-Month High

WTI jumped over 2% yesterday, eclipsing the $53 handle.

Strong API figures showed a large crude draw which led the black gold higher. The rally now looks towards EIA figures released later today, as a further move would cement a push towards $60.

By Orbex

German 2020 GDP & The EU’s Potential Next Recession

By Orbex

Tomorrow we have the release of a preliminary, non-seasonally adjusted estimate of Germany’s GDP growth during last year.

While it’s important news, we don’t expect it to move the market. This is because it’s not one of the official measures, but more of a “best guess” based on a compilation of metrics.

More importantly, it doesn’t have all the December data.

But, getting better information on how the economy is developing in the largest economy of the Eurozone is important to understanding where the euro is likely to go.

And, well, it’s not exactly good news.

Another recession?

Europe managed to pull itself out of recession by posting stellar growth in the third quarter.

However, it was still far from recovering to pre-pandemic levels. The reimposition of lockdowns across Europe has led many analysts to project another couple of quarters of negative growth.

This would put Europe back into recession.

In Germany’s case, covid case numbers were already high enough in mid-October for a new round of economic impact to be inevitable. So, businesses started adjusting.

With most of Q4 dominated by some form of economic restrictions, it’s unlikely that Germany was able to secure quarterly growth.

The projections

The consensus among economists is that Germany’s GDP change for 2020 will come in at -5.0%. This is in comparison to 0.6% growth during the prior year.

We have to remember that Germany just barely escaped falling into technical recession a few times prior to covid.

In fact, even before the first covid case in Europe, Germany was about to have negative growth in Q1 2020 and only avoid a recession because the final quarter of 2019 had no growth.

So, we need to keep in context what “return to pre-pandemic” levels really means.

According to a recent survey of economists by Bloomberg, there are no expectations for Europe to return to the economic activity of “pre-pandemic levels” until at least the end of this year.

How much longer can this last?

Europe has been relatively slow in the context of developed countries. It has been the last of the major economies to approve the latest vaccines.

Distribution has lagged, and so has administration.

While the US has managed over 7M inoculations, the EU has managed only 3.3M by the same date (last Monday).

Comparatively, the UK was the first country to authorize the vaccines and has managed an inoculation rate of 4.2% of the population by last Monday. Meanwhile, the EU lags at 0.7%.

Germany is above average at 0.8% of its population having received the vaccine.

Early this morning, German Health Minister Spahn confirmed that Germany was headed for another 10 weeks of lockdowns.

Given the recent economic dynamics, that would virtually guarantee another quarter of economic contraction.

By Orbex

Fibonacci Retracements Analysis 13.01.2021 (GBPUSD, EURJPY)

Article By RoboForex.com

GBPUSD, “Great Britain Pound vs US Dollar”

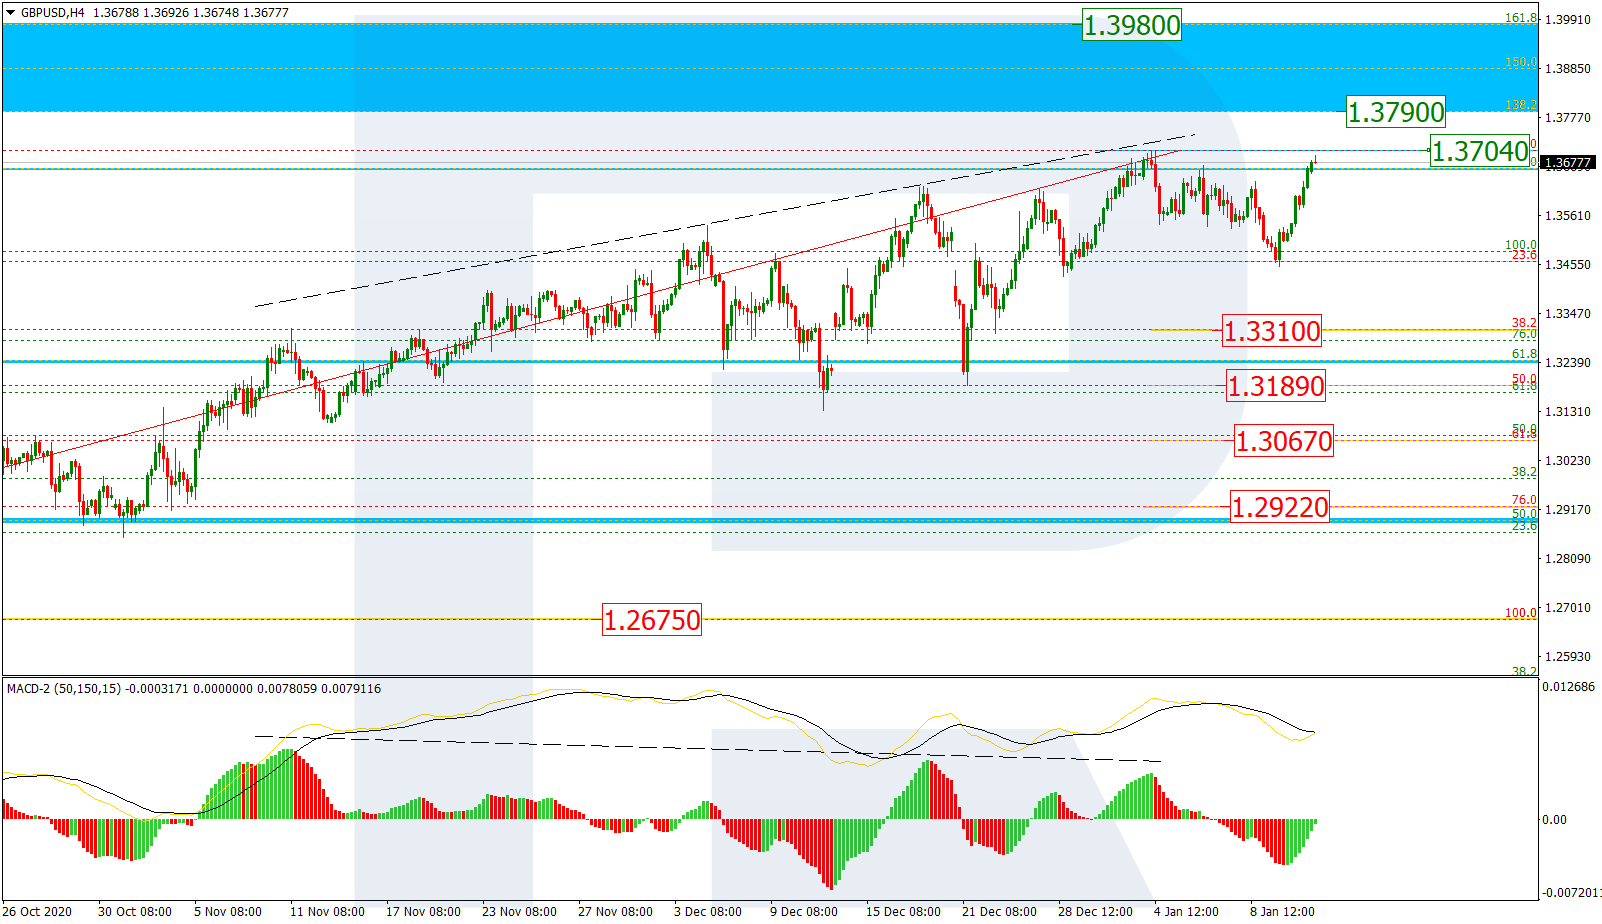
As we can see in the H4 chart, after finishing the correction at 23.6% fibo, GBPUSD is forming another rising wave. If the price breaks the high at 1.3740, it may continue growing to reach the post-correctional extension area between 138.2% and 161.8% fibo at 1.3790 and 1.3980 respectively. However, an alternative scenario says that the pair may rebound from the high and start a new descending structure towards 38.2%, 50.0%, 61.8%, and 76.0% fibo at 1.3310, 1.3189, 1.3067, and 1.2922 respectively.

GBPUSD_H4
Risk Warning: the result of previous trading operations do not guarantee the same results in the future

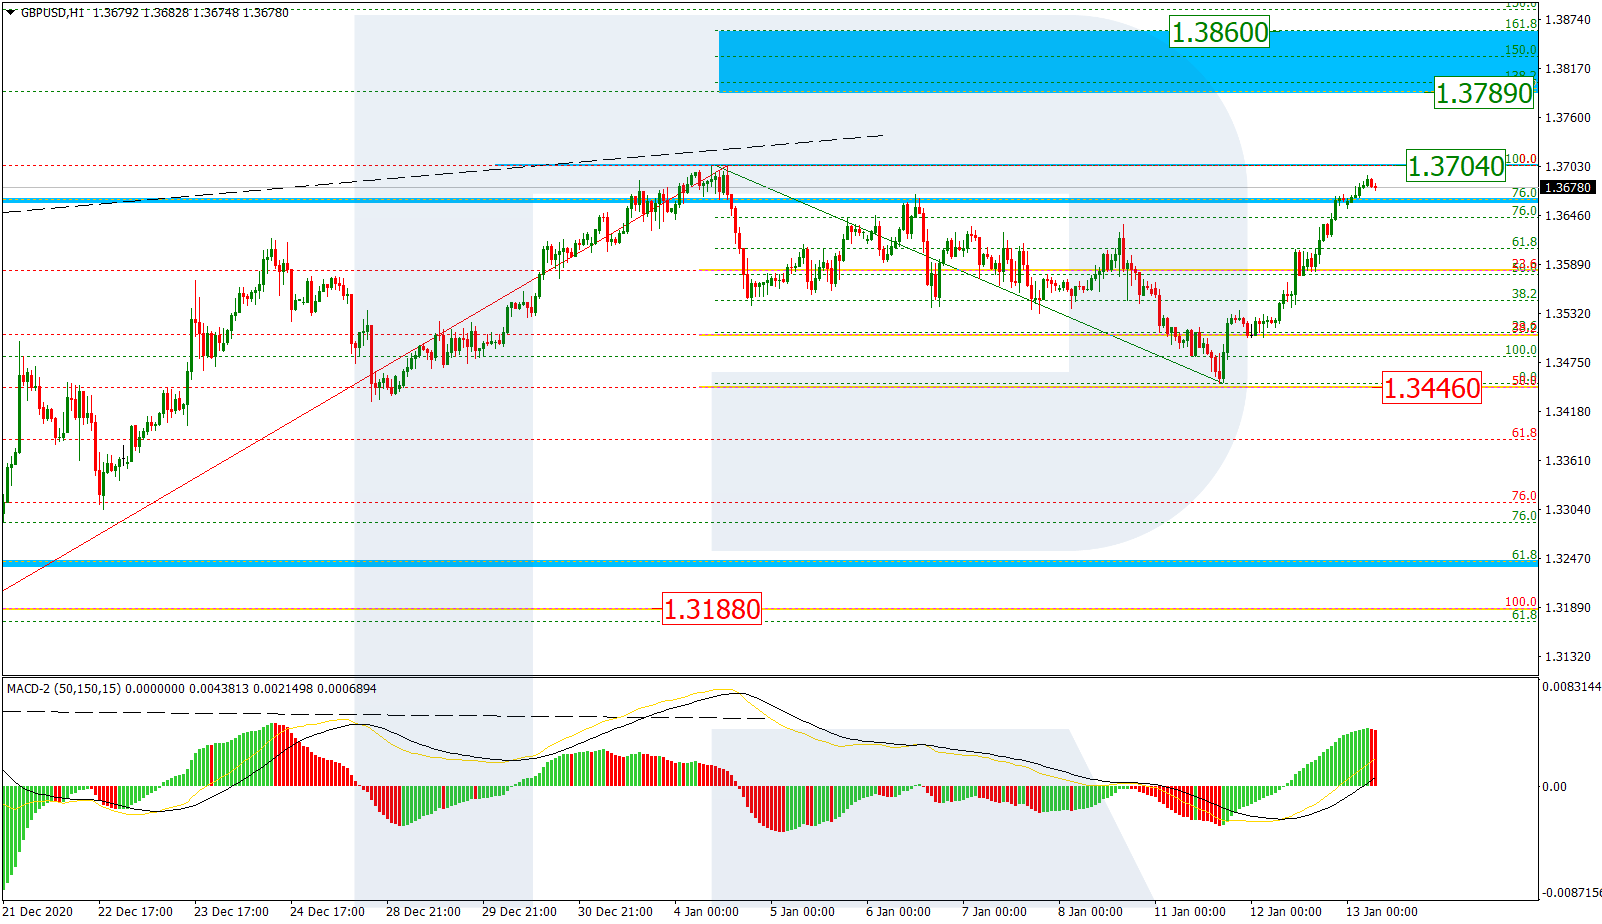
In the H1 chart, the price is approaching the high for a test and a possible rebound. In the nearest future, the pair may start a local pullback, which may later be followed by a new growth towards the post-correctional extension area between 138.2% and 161.8% fibo at 1.3789 and 1.3860 respectively. However, a breakout of the local low at 1.3446 will lead to another mid-tern correctional wave.

GBPUSD_H1
Risk Warning: the result of previous trading operations do not guarantee the same results in the future

EURJPY, “Euro vs. Japanese Yen”

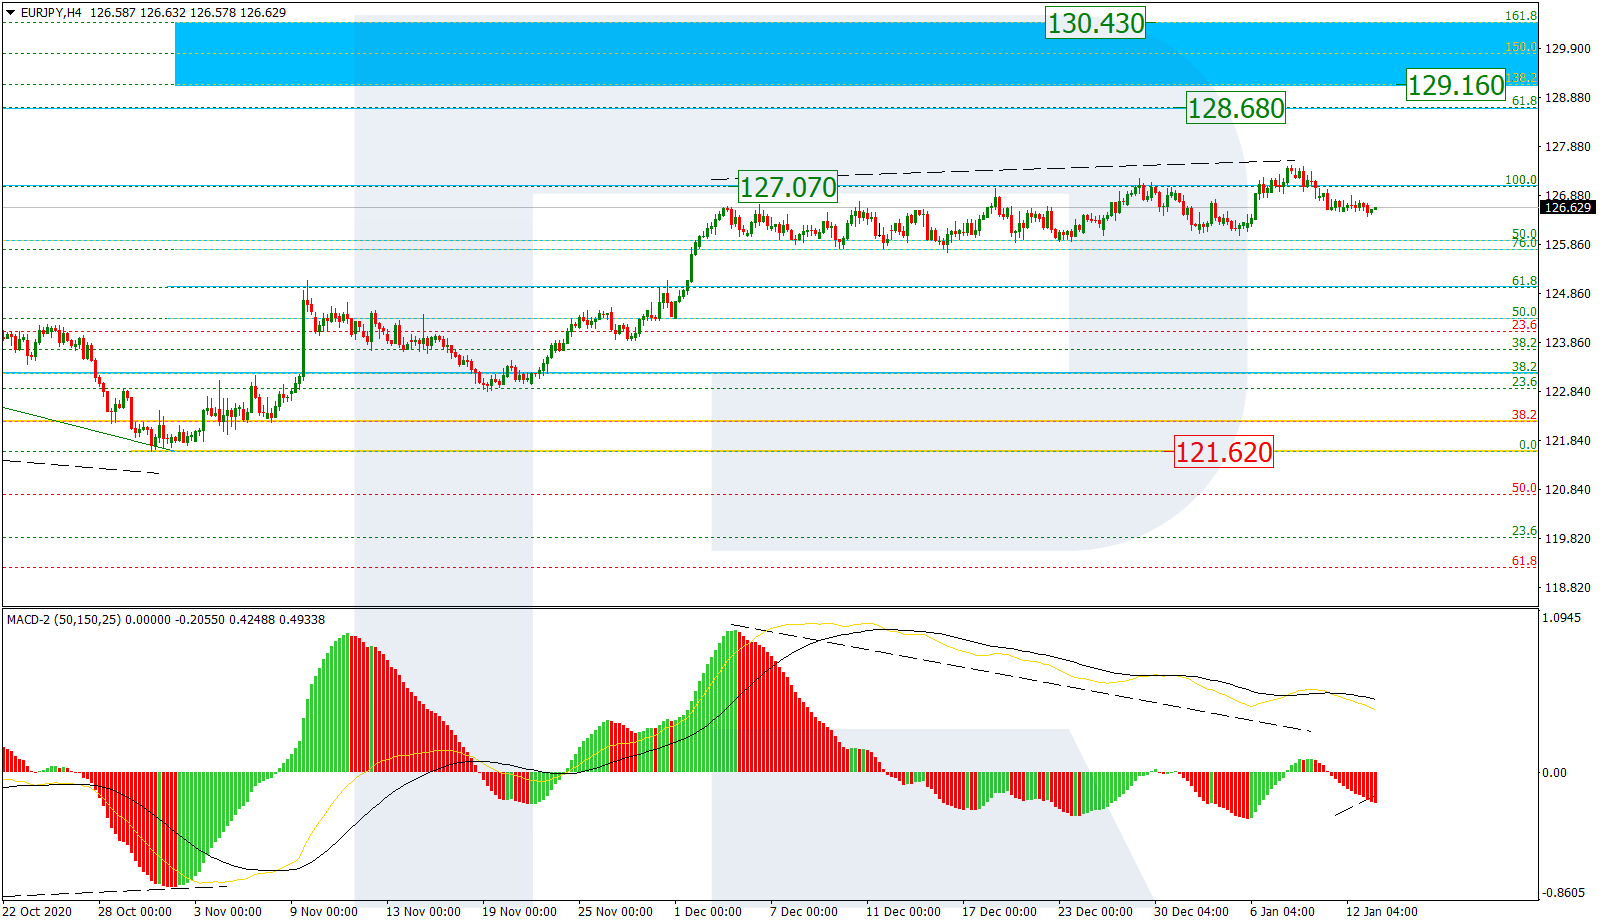
As we can see in the H4 chart, EURJPY is falling again after another divergence on MACD. Possibly, the pair may complete the correction and resume growing to break the mid-term 61.8% fibo at 128.65 and then continue moving to reach the post-correctional extension area between 138.2% and 161.8% fibo at 129.16 and 130.43 respectively. The key support is the fractal low at 121.62.

EURJPY_H4
Risk Warning: the result of previous trading operations do not guarantee the same results in the future

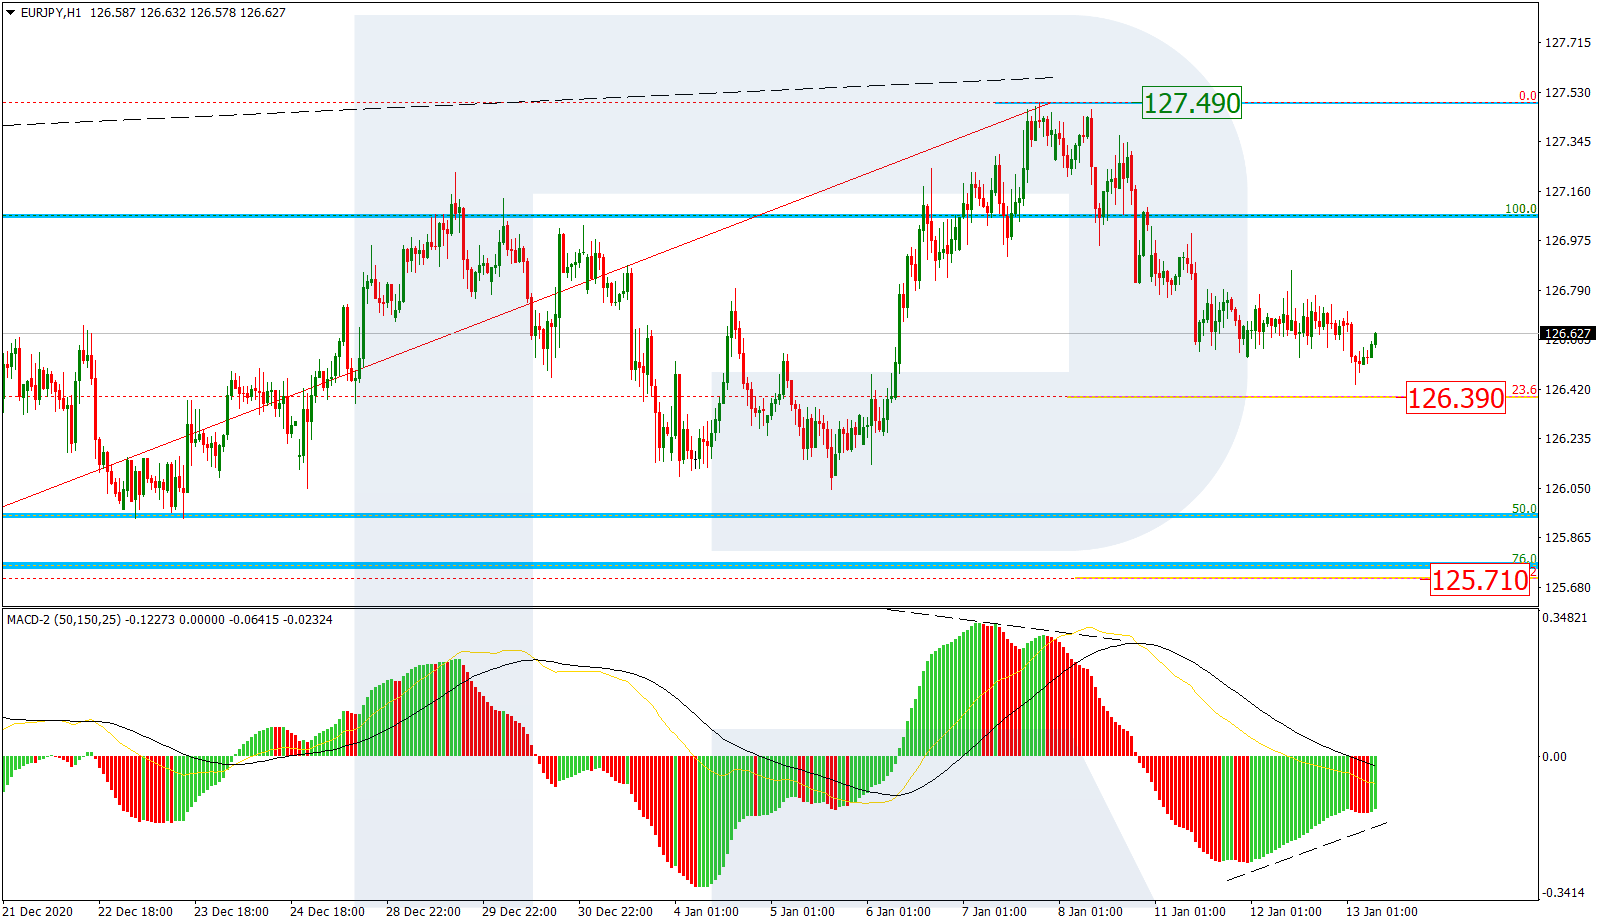
The H1 chart shows that the price is falling towards 23.6% fibo at 126.39. The next downside target may be 38.2% fibo at 125.71. A breakout of the local high at 127.49 will hint at further uptrend.

EURJPY_H1

Article By RoboForex.com

Attention!
Forecasts presented in this section only reflect the author’s private opinion and should not be considered as guidance for trading. RoboForex LP bears no responsibility for trading results based on trading recommendations described in these analytical reviews.