By InvestMacro
Here are the latest charts and statistics for the Commitment of Traders (COT) data published by the Commodities Futures Trading Commission (CFTC).
The latest COT data is updated through Tuesday May 6th and shows a quick view of how large traders (for-profit speculators and commercial entities) were positioned in the futures markets.
Weekly Speculator Changes led by Copper & Palladium

The COT metals markets speculator bets were mixed this week as three out of the six metals markets we cover had higher positioning while the other three markets had lower speculator contracts.
Leading the gains for the metals was Copper (2,334 contracts) with Palladium (927 contracts) and Steel (148 contracts) also showing positive weeks.
The markets with declines in speculator bets for the week were Gold (-821 contracts), Silver (-691 contracts) and Platinum (-452 contracts) also registering lower bets on the week.
Metals Data:
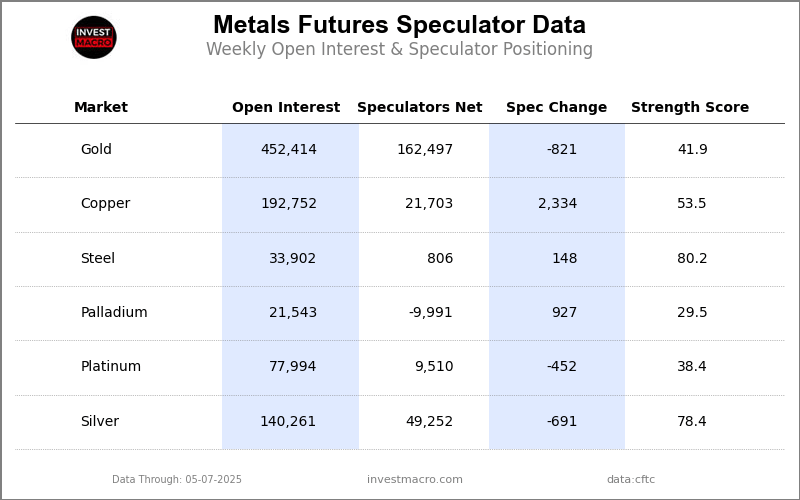
Legend: Weekly Speculators Change | Speculators Current Net Position | Speculators Strength Score compared to last 3-Years (0-100 range)
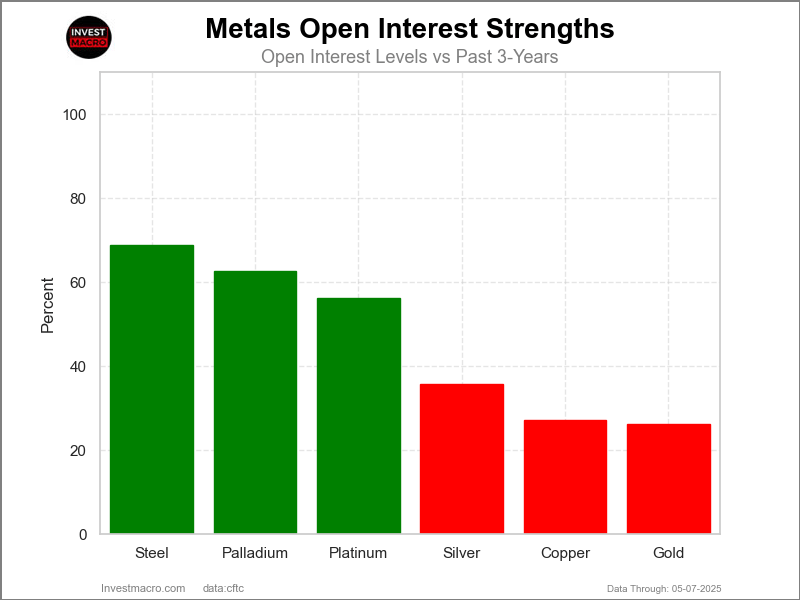
Strength Scores led by Steel & Silver
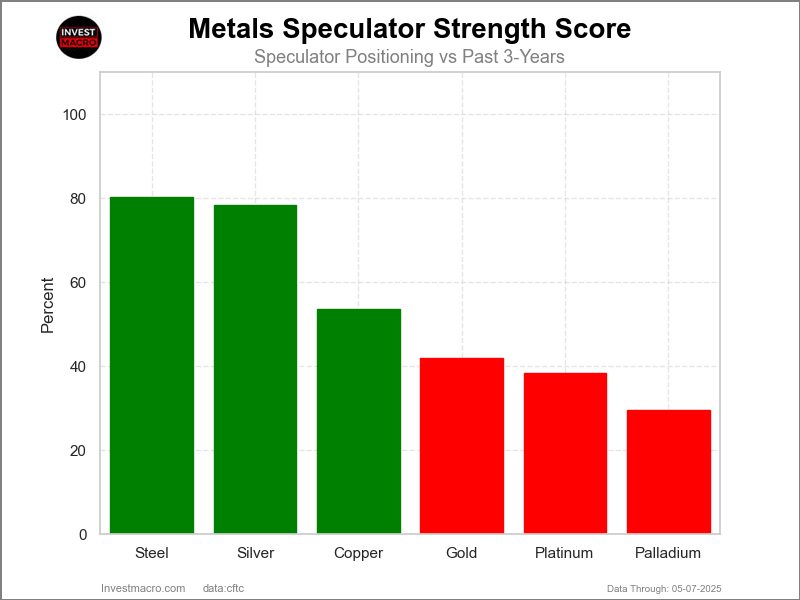
COT Strength Scores (a normalized measure of Speculator positions over a 3-Year range, from 0 to 100 where above 80 is Extreme-Bullish and below 20 is Extreme-Bearish) showed that Steel (80 percent) and Silver (78 percent) lead the metals markets this week.
On the downside, Palladium (29 percent) and Platinum (38 percent) come in at the lowest strength level currently.
Strength Statistics:
Gold (41.9 percent) vs Gold previous week (42.2 percent)
Silver (78.4 percent) vs Silver previous week (79.3 percent)
Copper (53.5 percent) vs Copper previous week (51.3 percent)
Platinum (38.4 percent) vs Platinum previous week (39.5 percent)
Palladium (29.5 percent) vs Palladium previous week (22.5 percent)
Steel (80.2 percent) vs Palladium previous week (79.5 percent)
Platinum & Copper top the 6-Week Strength Trends
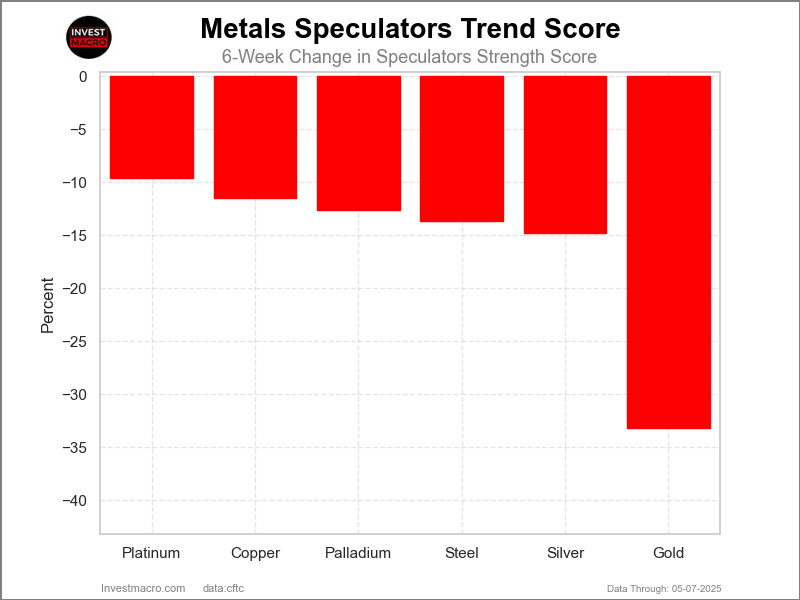
COT Strength Score Trends (or move index, calculates the 6-week changes in strength scores) showed that all the metals markets have negative trends currently.
Platinum (-10 percent) and Copper (-12 percent) have the least negative trends this week while Gold (-33.2 percent) has the most negative trend at the moment.
Move Statistics:
Gold (-33.2 percent) vs Gold previous week (-35.9 percent)
Silver (-14.8 percent) vs Silver previous week (-15.6 percent)
Copper (-11.5 percent) vs Copper previous week (-5.4 percent)
Platinum (-9.6 percent) vs Platinum previous week (-24.9 percent)
Palladium (-12.6 percent) vs Palladium previous week (-18.2 percent)
Steel (-13.7 percent) vs Steel previous week (-17.3 percent)
Individual Markets:
Gold Comex Futures:
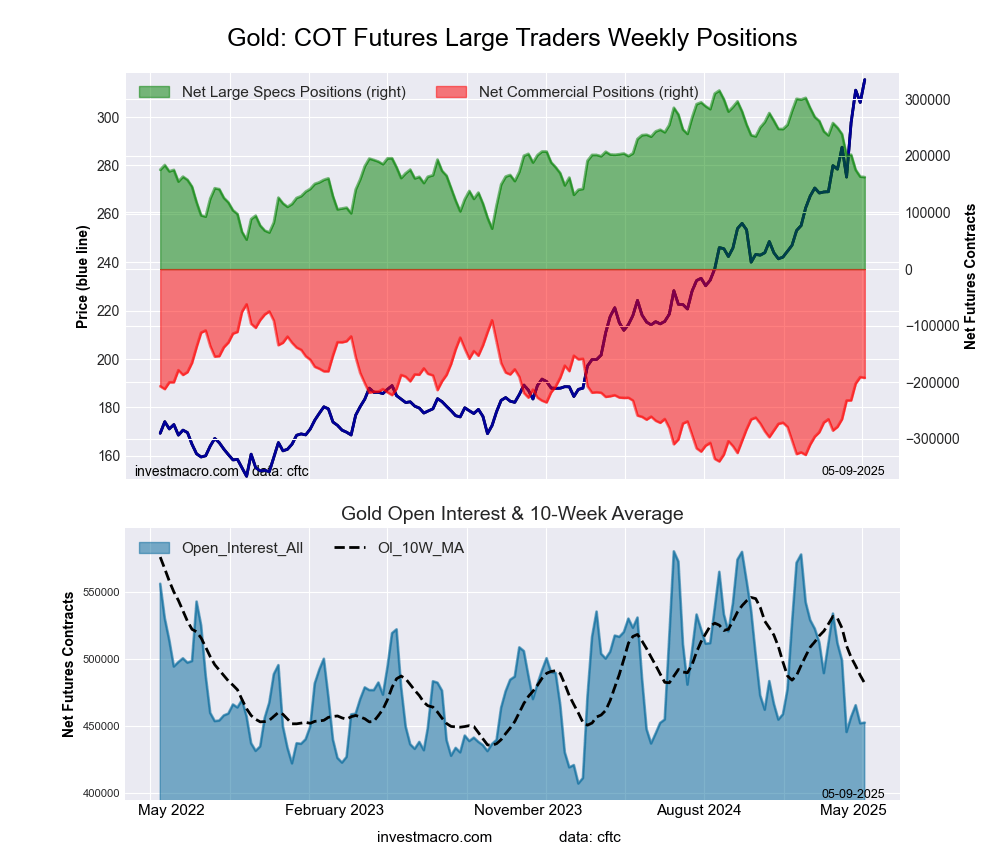 The Gold Comex Futures large speculator standing this week equaled a net position of 162,497 contracts in the data reported through Tuesday. This was a weekly dip of -821 contracts from the previous week which had a total of 163,318 net contracts.
This week’s current strength score (the trader positioning range over the past three years, measured from 0 to 100) shows the speculators are currently Bearish with a score of 41.9 percent. The commercials are Bullish with a score of 53.2 percent and the small traders (not shown in chart) are Bullish-Extreme with a score of 91.0 percent.
Price Trend-Following Model: Strong Uptrend
Our weekly trend-following model classifies the current market price position as: Strong Uptrend.
| Gold Futures Statistics | SPECULATORS | COMMERCIALS | SMALL TRADERS |
| – Percent of Open Interest Longs: | 52.5 | 19.3 | 11.6 |
| – Percent of Open Interest Shorts: | 16.6 | 61.7 | 5.1 |
| – Net Position: | 162,497 | -192,103 | 29,606 |
| – Gross Longs: | 237,445 | 87,244 | 52,632 |
| – Gross Shorts: | 74,948 | 279,347 | 23,026 |
| – Long to Short Ratio: | 3.2 to 1 | 0.3 to 1 | 2.3 to 1 |
| NET POSITION TREND: | |||
| – Strength Index Score (3 Year Range Pct): | 41.9 | 53.2 | 91.0 |
| – Strength Index Reading (3 Year Range): | Bearish | Bullish | Bullish-Extreme |
| NET POSITION MOVEMENT INDEX: | |||
| – 6-Week Change in Strength Index: | -33.2 | 31.2 | 3.4 |
Silver Comex Futures:
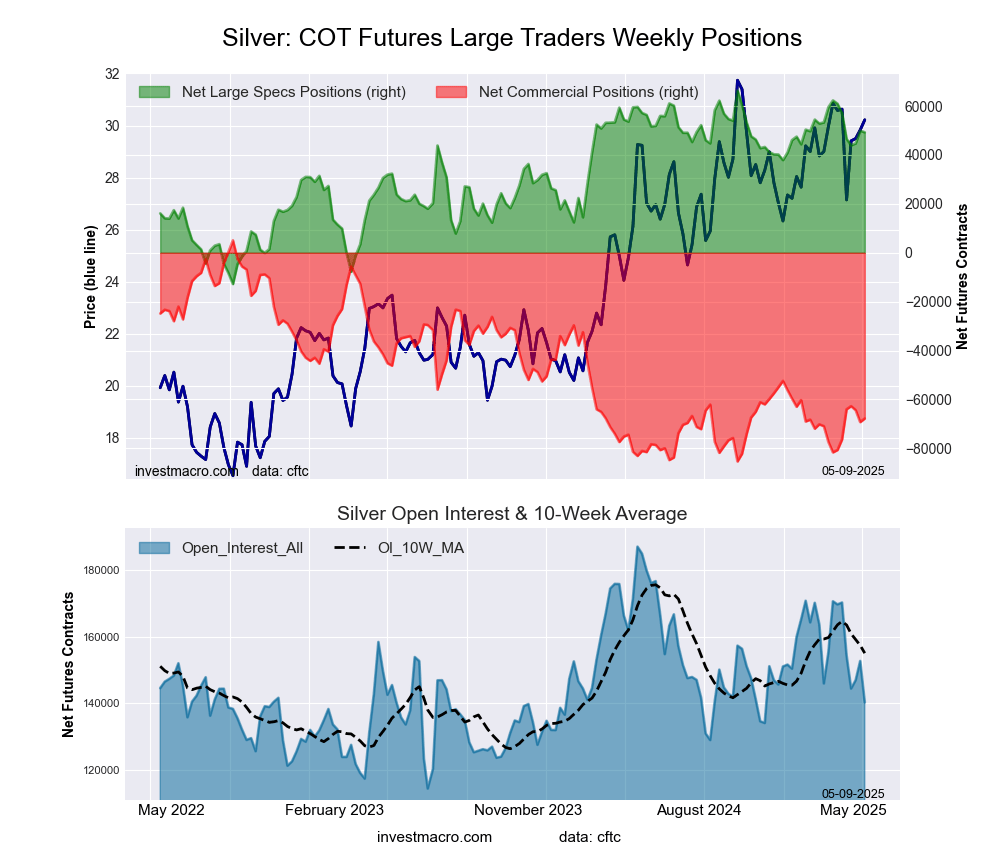 The Silver Comex Futures large speculator standing this week equaled a net position of 49,252 contracts in the data reported through Tuesday. This was a weekly reduction of -691 contracts from the previous week which had a total of 49,943 net contracts.
This week’s current strength score (the trader positioning range over the past three years, measured from 0 to 100) shows the speculators are currently Bullish with a score of 78.4 percent. The commercials are Bearish-Extreme with a score of 19.4 percent and the small traders (not shown in chart) are Bullish with a score of 60.4 percent.
Price Trend-Following Model: Uptrend
Our weekly trend-following model classifies the current market price position as: Uptrend.
| Silver Futures Statistics | SPECULATORS | COMMERCIALS | SMALL TRADERS |
| – Percent of Open Interest Longs: | 50.1 | 22.9 | 19.8 |
| – Percent of Open Interest Shorts: | 15.0 | 71.3 | 6.5 |
| – Net Position: | 49,252 | -67,803 | 18,551 |
| – Gross Longs: | 70,335 | 32,146 | 27,737 |
| – Gross Shorts: | 21,083 | 99,949 | 9,186 |
| – Long to Short Ratio: | 3.3 to 1 | 0.3 to 1 | 3.0 to 1 |
| NET POSITION TREND: | |||
| – Strength Index Score (3 Year Range Pct): | 78.4 | 19.4 | 60.4 |
| – Strength Index Reading (3 Year Range): | Bullish | Bearish-Extreme | Bullish |
| NET POSITION MOVEMENT INDEX: | |||
| – 6-Week Change in Strength Index: | -14.8 | 14.3 | -5.8 |
Copper Grade #1 Futures:
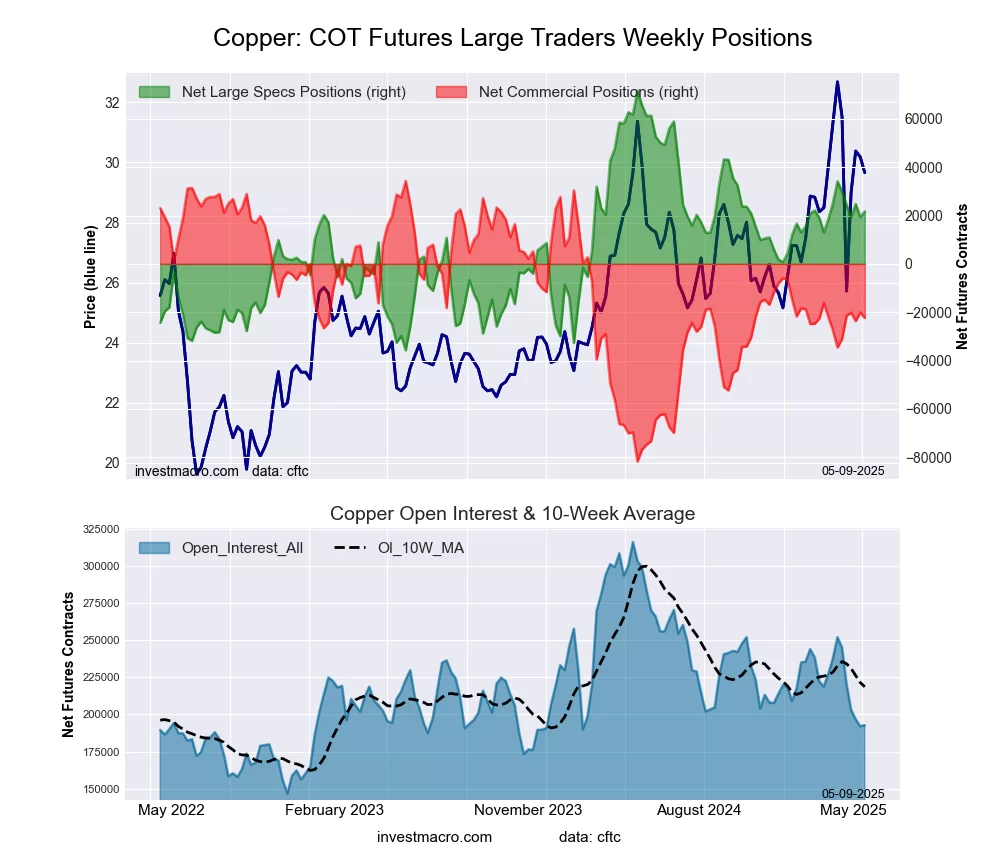 The Copper Grade #1 Futures large speculator standing this week equaled a net position of 21,703 contracts in the data reported through Tuesday. This was a weekly boost of 2,334 contracts from the previous week which had a total of 19,369 net contracts.
This week’s current strength score (the trader positioning range over the past three years, measured from 0 to 100) shows the speculators are currently Bullish with a score of 53.5 percent. The commercials are Bullish with a score of 51.2 percent and the small traders (not shown in chart) are Bearish with a score of 21.7 percent.
Price Trend-Following Model: Uptrend
Our weekly trend-following model classifies the current market price position as: Uptrend.
| Copper Futures Statistics | SPECULATORS | COMMERCIALS | SMALL TRADERS |
| – Percent of Open Interest Longs: | 37.2 | 31.9 | 6.9 |
| – Percent of Open Interest Shorts: | 26.0 | 43.5 | 6.6 |
| – Net Position: | 21,703 | -22,355 | 652 |
| – Gross Longs: | 71,777 | 61,510 | 13,342 |
| – Gross Shorts: | 50,074 | 83,865 | 12,690 |
| – Long to Short Ratio: | 1.4 to 1 | 0.7 to 1 | 1.1 to 1 |
| NET POSITION TREND: | |||
| – Strength Index Score (3 Year Range Pct): | 53.5 | 51.2 | 21.7 |
| – Strength Index Reading (3 Year Range): | Bullish | Bullish | Bearish |
| NET POSITION MOVEMENT INDEX: | |||
| – 6-Week Change in Strength Index: | -11.5 | 10.5 | 1.4 |
Platinum Futures:
 The Platinum Futures large speculator standing this week equaled a net position of 9,510 contracts in the data reported through Tuesday. This was a weekly reduction of -452 contracts from the previous week which had a total of 9,962 net contracts.
This week’s current strength score (the trader positioning range over the past three years, measured from 0 to 100) shows the speculators are currently Bearish with a score of 38.4 percent. The commercials are Bullish with a score of 61.5 percent and the small traders (not shown in chart) are Bearish with a score of 33.6 percent.
Price Trend-Following Model: Strong Uptrend
Our weekly trend-following model classifies the current market price position as: Strong Uptrend.
| Platinum Futures Statistics | SPECULATORS | COMMERCIALS | SMALL TRADERS |
| – Percent of Open Interest Longs: | 57.2 | 24.0 | 11.1 |
| – Percent of Open Interest Shorts: | 45.0 | 42.0 | 5.3 |
| – Net Position: | 9,510 | -14,040 | 4,530 |
| – Gross Longs: | 44,605 | 18,742 | 8,637 |
| – Gross Shorts: | 35,095 | 32,782 | 4,107 |
| – Long to Short Ratio: | 1.3 to 1 | 0.6 to 1 | 2.1 to 1 |
| NET POSITION TREND: | |||
| – Strength Index Score (3 Year Range Pct): | 38.4 | 61.5 | 33.6 |
| – Strength Index Reading (3 Year Range): | Bearish | Bullish | Bearish |
| NET POSITION MOVEMENT INDEX: | |||
| – 6-Week Change in Strength Index: | -9.6 | 13.5 | -30.6 |
Palladium Futures:
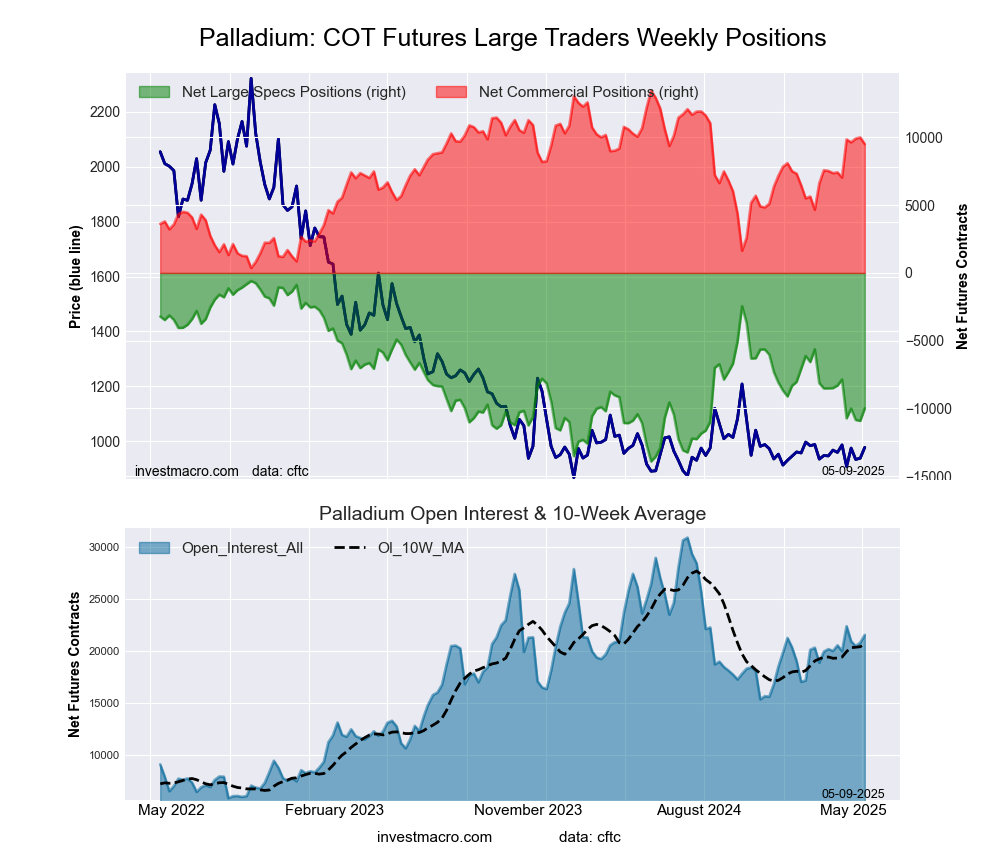 The Palladium Futures large speculator standing this week equaled a net position of -9,991 contracts in the data reported through Tuesday. This was a weekly boost of 927 contracts from the previous week which had a total of -10,918 net contracts.
This week’s current strength score (the trader positioning range over the past three years, measured from 0 to 100) shows the speculators are currently Bearish with a score of 29.5 percent. The commercials are Bullish with a score of 69.8 percent and the small traders (not shown in chart) are Bullish with a score of 53.1 percent.
Price Trend-Following Model: Uptrend
Our weekly trend-following model classifies the current market price position as: Uptrend.
| Palladium Futures Statistics | SPECULATORS | COMMERCIALS | SMALL TRADERS |
| – Percent of Open Interest Longs: | 29.7 | 51.8 | 9.4 |
| – Percent of Open Interest Shorts: | 76.1 | 7.6 | 7.2 |
| – Net Position: | -9,991 | 9,512 | 479 |
| – Gross Longs: | 6,396 | 11,158 | 2,026 |
| – Gross Shorts: | 16,387 | 1,646 | 1,547 |
| – Long to Short Ratio: | 0.4 to 1 | 6.8 to 1 | 1.3 to 1 |
| NET POSITION TREND: | |||
| – Strength Index Score (3 Year Range Pct): | 29.5 | 69.8 | 53.1 |
| – Strength Index Reading (3 Year Range): | Bearish | Bullish | Bullish |
| NET POSITION MOVEMENT INDEX: | |||
| – 6-Week Change in Strength Index: | -12.6 | 16.0 | -18.6 |
Steel Futures Futures:
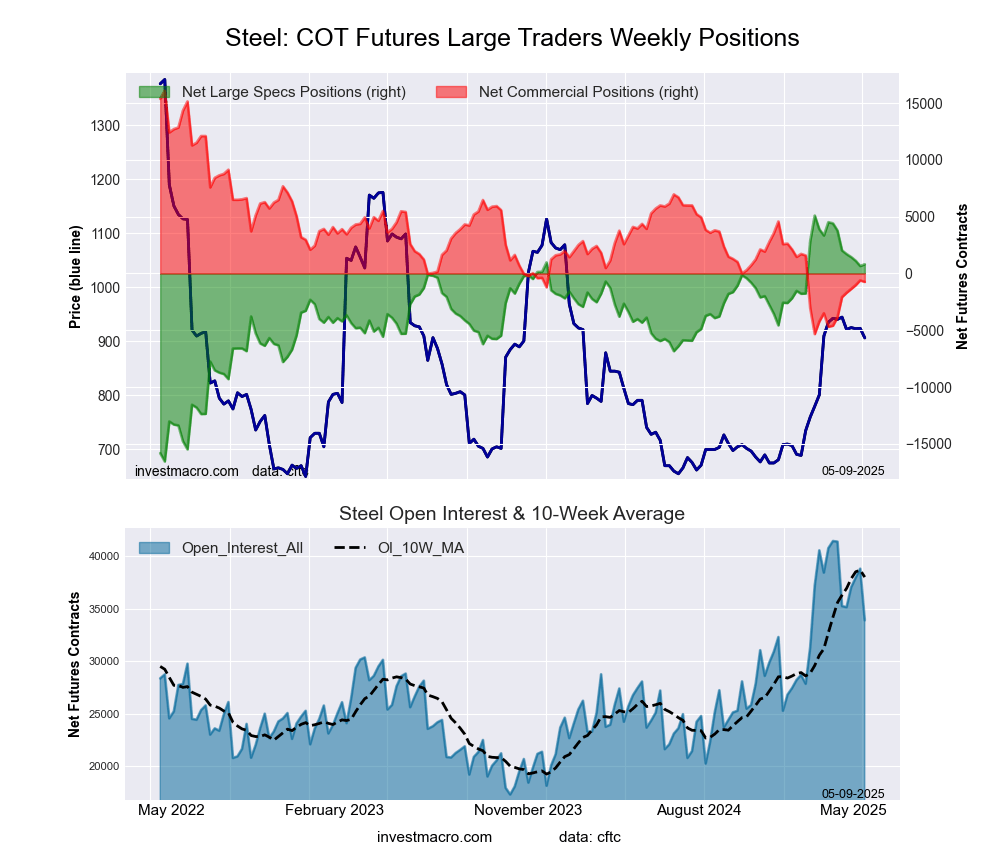 The Steel Futures large speculator standing this week equaled a net position of 806 contracts in the data reported through Tuesday. This was a weekly lift of 148 contracts from the previous week which had a total of 658 net contracts.
This week’s current strength score (the trader positioning range over the past three years, measured from 0 to 100) shows the speculators are currently Bullish-Extreme with a score of 80.2 percent. The commercials are Bearish with a score of 21.4 percent and the small traders (not shown in chart) are Bearish with a score of 25.6 percent.
Price Trend-Following Model: Uptrend
Our weekly trend-following model classifies the current market price position as: Uptrend.
| Steel Futures Statistics | SPECULATORS | COMMERCIALS | SMALL TRADERS |
| – Percent of Open Interest Longs: | 31.1 | 62.2 | 0.6 |
| – Percent of Open Interest Shorts: | 28.7 | 64.4 | 0.8 |
| – Net Position: | 806 | -744 | -62 |
| – Gross Longs: | 10,534 | 21,095 | 218 |
| – Gross Shorts: | 9,728 | 21,839 | 280 |
| – Long to Short Ratio: | 1.1 to 1 | 1.0 to 1 | 0.8 to 1 |
| NET POSITION TREND: | |||
| – Strength Index Score (3 Year Range Pct): | 80.2 | 21.4 | 25.6 |
| – Strength Index Reading (3 Year Range): | Bullish-Extreme | Bearish | Bearish |
| NET POSITION MOVEMENT INDEX: | |||
| – 6-Week Change in Strength Index: | -13.7 | 14.6 | -17.5 |
Article By InvestMacro – Receive our weekly COT Newsletter
*COT Report: The COT data, released weekly to the public each Friday, is updated through the most recent Tuesday (data is 3 days old) and shows a quick view of how large speculators or non-commercials (for-profit traders) were positioned in the futures markets.
The CFTC categorizes trader positions according to commercial hedgers (traders who use futures contracts for hedging as part of the business), non-commercials (large traders who speculate to realize trading profits) and nonreportable traders (usually small traders/speculators) as well as their open interest (contracts open in the market at time of reporting). See CFTC criteria here.