Ichimoku Cloud Analysis 12.04.2021 (EURUSD, GBPUSD, EURGBP)

Article By RoboForex.com

EURUSD, “Euro vs US Dollar”

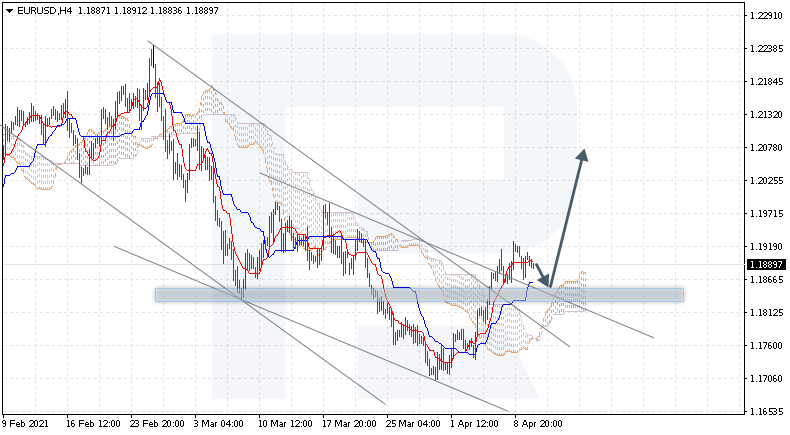
EURUSD is trading at 1.1889; the instrument is moving above Ichimoku Cloud, thus indicating an ascending tendency. The markets could indicate that the price may test the cloud’s upside border at 1.1860 and then resume moving upwards to reach 1.2075. Another signal in favor of a further uptrend will be a rebound from the descending channel’s upside border. However, the bullish scenario may be canceled if the price breaks the cloud’s downside border and fixes below 1.1775. In this case, the pair may continue falling towards 1.1665.

EURUSD
Risk Warning: the result of previous trading operations do not guarantee the same results in the future

GBPUSD, “Great Britain Pound vs US Dollar”

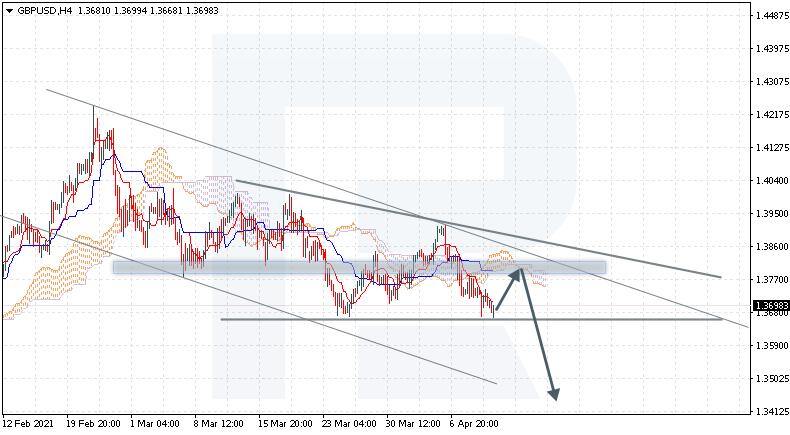
GBPUSD is trading at 1.3698; the instrument is moving below Ichimoku Cloud, thus indicating a descending tendency. The markets could indicate that the price may test the cloud’s downside border at 1.3785 and then resume moving downwards to reach 1.3435. Another signal in favor of a further downtrend will be a rebound from the resistance level. However, the bearish scenario may no longer be valid if the price breaks the cloud’s upside border and fixes above 1.3875. In this case, the pair may continue growing towards 1.3965. To confirm further decline, the asset must break the downside border of the Triangle pattern and fix below 1.3585. The target of the pattern materialization is 1.3375.

GBPUSD
Risk Warning: the result of previous trading operations do not guarantee the same results in the future

EURGBP, “Euro vs Great Britain Pound”

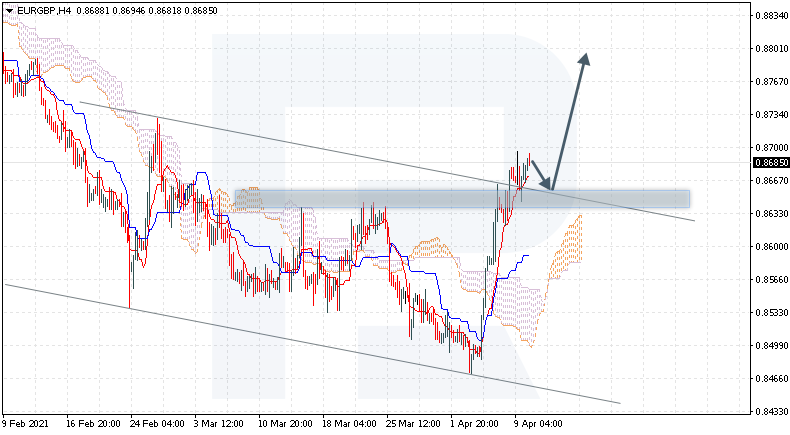
EURGBP is trading at 0.8685; the instrument is moving above Ichimoku Cloud, thus indicating an ascending tendency. The markets could indicate that the price may test Tenkan-Sen and Kijun-Sen at 0.8655 and then resume moving upwards to reach 0.8805. Another signal in favor of a further uptrend will be a rebound from the descending channel’s upside border. However, the bullish scenario may no longer be valid if the price breaks the cloud’s downside border and fixes below 0.8545. In this case, the pair may continue falling towards 0.8455.

EURGBP

Article By RoboForex.com

Attention!
Forecasts presented in this section only reflect the author’s private opinion and should not be considered as guidance for trading. RoboForex LP bears no responsibility for trading results based on trading recommendations described in these analytical reviews.

The Analytical Overview of the Main Currency Pairs on 2021.04.12

by JustForex

The EUR/USD currency pair

Technical indicators of the currency pair:
  • Prev Open: 1.1913
  • Prev Close: 1.1900
  • % chg. over the last day: -0.11%

The euro fell slightly against the US dollar as part of the technical correction on Friday. As trading volumes were significantly reduced at the end of the week, the currencies of the 10 group entered a correction phase.

Trading recommendations
  • Support levels: 1.1836, 1.1704
  • Resistance levels: 1.1915, 1.1990

The main scenario for EUR/USD is selling. The technical picture looks bearish. The MACD is near zero, and divergence has formed, which indicates an approaching correction. The ADX reacted strongly to the southern impulse, indicating an increase in bearish pressure.

Alternative scenario: if the price manages to gain a foothold above the level of 1.1915, the pair may return to growth to 1.1990.

EUR/USD
There is no news feed for today.

The GBP/USD currency pair

Technical indicators of the currency pair:
  • Prev Open: 1.3730
  • Prev Close: 1.3707
  • % chg. over the last day: -0.17%

The sterling declined on Friday amid correction of the US dollar. The pressure on the British currency is taking place due to the AstraZeneca vaccine situation, which may undermine the vaccination program in the UK.

Trading recommendations
  • Support levels: 1.3705, 1.3680
  • Resistance levels: 1.3848, 1.3929

The main scenario for GBP/USD is selling. The pair has come close to the first support level. As long as the price is below the moving averages, the risk of a breakdown is high. However, the ADX shows a decrease in the southern trend’s potential and a divergence formed on the MACD. It indicates a possible temporary stop in the southern movement.

Alternative scenario: if the pair consolidates above 1.3800, the pound may move upward to 1.3848.

GBP/USD
There is no news feed for today.

The USD/JPY currency pair

Technical indicators of the currency pair:
  • Prev Open: 109.26
  • Prev Close: 109.67
  • % chg. over the last day: -0.51%

The dollar-yen pair rose on Friday amid a correction in the dollar index and US Treasuries, the yield of which rose to 1.65%. The market has seen a decrease in demand for defensive assets, including gold, Swiss franc, and yen.

Trading recommendations
  • Support levels: 108.35, 107.08
  • Resistance levels: 110.32, 110.98

The main scenario is trading in a sideways range. The price is still fixed below the moving averages. The MACD is near zero, and convergence has formed on the chart, which indicates a possible stop of the decline. At the same time, the ADX shows a decline in the bearish trend potential. By a combination of factors, there is a signal for sideways movement within the day.

The alternative scenario implies the price fixing above 109.90. In this case, the pair may resume growth to 110.32.

USD/JPY
There is no news feed for today.

The USD/CAD currency pair

Technical indicators of the currency pair:
  • Prev Open: 1.2560
  • Prev Close: 1.2526
  • % chg. over the last day: +0.27%

The pair continues to trade in a narrow sideways range, as oil quotes have stabilized around $59 per barrel. The slight decline was due to the continued decline in the dollar index.

Trading recommendations
  • Support levels: 1.2554, 1.2501
  • Resistance levels: 1.2629, 1.2646

The main scenario is trading in a sideways range between 1.2554 and 1.2629. Specifications are mixed. Price is stuck between the moving averages. The MACD is near zero. However, the ADX shows a strong reaction to the decline in quotations, which indicates a potential risk of a breakdown of the first support level.

Alternative scenario: if the price manages to consolidate below 1.2554, the pair may resume its decline to 1.2501. A breakout of 1.2629 would indicate an advance to 1.2646 or higher.

USD/CAD
There is no news feed for today.

by JustForex


This article reflects a personal opinion and should not be interpreted as an investment advice, and/or offer, and/or a persistent request for carrying out financial transactions, and/or a guarantee, and/or a forecast of future events.

Stocks recorded their longest weekly rally since October

by JustForex

Stocks climbed to a new record as investors ignored inflation and focused on the outlook for an economic recovery. Treasuries fell and the dollar rose.

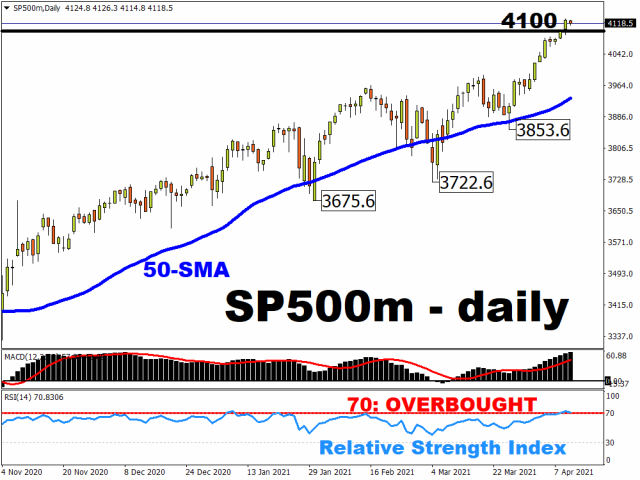
The S&P 500 closed above 4,100 for its third weekly rally in a row – the longest one since October, despite the fact that trading volume on the US stock exchanges hit a new low this year.

Stocks increased from March 2020 lows to around 85% as Federal Reserve officials assured markets about favorable policy. Vice Chairman Richard Clarida said that he will look for the signs of hitting inflation targets before raising interest rates. Nevertheless, the report showing the rise in producer prices added fuel to the fire by discussing the trajectory of inflation.

“This is incomprehensible information,” said Giorgio Caputo, who is a senior fund manager at JO Hambro Capital Management. “It is important to consider the important points of what is really happening – prices are rising because domestic demand is recovering.” Gold is correcting on the back of rising stock prices. Quotes decreased by 0.7% to $1,742.83 per ounce in the American session. WTI crude oil continues to consolidate around $59 p/b.

Main market quotes:

S&P 500 (F) 4,109.88 -9.62 (-0.23%)

Dow Jones 33,800.60 +297.03 (+0.89%)

DAX 15,230.45 -3.71 (-0.02%)

FTSE 100 6,856.74 -59.01 (-0.85%)

USD Index 92.265 +0.105 (+0.11%)

There is no news feed for today.

by JustForex


This article reflects a personal opinion and should not be interpreted as an investment advice, and/or offer, and/or a persistent request for carrying out financial transactions, and/or a guarantee, and/or a forecast of future events.

Earnings season to determine the fate of the bull market

By Hussein Sayed Chief Market Strategist (Gulf & MENA), ForexTime

Ever since the US stock market bottomed on 23 March last year, equities have been driven by brighter global growth expectations supported by fiscal and monetary policies and scientists who have worked towards eliminating the virus worldwide.

According to the most recent BofA report, equity funds have attracted $576 billion over the past five months, exceeding inflows recorded over the past 12 years. Investors have been left with few choices as sovereign debt markets and most high grade corporate bonds have been offering a minimal or negative real return. This environment has led valuations to skyrocket with the most followed benchmark S&P 500 trading at 22.5 times forward earnings, well above its 10-year average of 15.9 times and the highest since the late 1990’s dotcom bubble.

The upcoming weeks will provide a reality check on whether this bull market still has the potential to creep higher or some profits needs to be cashed out. The earnings season is kicking off this week with major banks announcing first quarter results, a year after the Covid-19 pandemic halted the global economy. As analysts have become more optimistic, earnings expectations for S&P 500 companies have been rising over the past two months and are anticipated to grow 25% in the first quarter of 2021 compared to a year ago.

With bond yields continuing to move gradually higher, forward earnings need to be brought a little lower. So, either shares prices need to correct to the downside or earnings have to beat markets expectations. Given that most technical indicators are reflecting overbought signals on the S&P 500, it seems like earnings will need to beat expectations by a significant margin to justify another leg higher.

JP Morgan, Wells Fargo and Goldman Sachs will all be announcing results on Wednesday morning, followed by Bank of America and Citigroup on Thursday. Financials have been the second-best performing sector so far this year rising 19%, with the energy sector topping that with gains of 27% so far this year.

Currency traders will also be closely watching data out of the US this week. The dollar has fallen against its major peers as the US 10-year Treasury yield has dropped from its 14-month peak. US bond markets have clearly become the number one factor moving the dollar and traders need to watch out to see whether yields will begin rising again following the past week’s declines or possibly consolidate around current levels of 1.6% to 1.7%.

US consumer prices released on Tuesday will be in focus following the largest annual gains in producer prices in almost a decade. Traders need to ignore the year-on-year changes given the very low base due to the pandemic and concentrate on any monthly moves to determine the trajectory of prices due to fiscal and monetary policies, challenges in supply-chain and expected consumers’ pent-up demand.

Thursday’s retail sales report will also be significant as it should continue to reflect the divergence between consumers spending in the US and the rest of the developed economies.

Disclaimer: The content in this article comprises personal opinions and should not be construed as containing personal and/or other investment advice and/or an offer of and/or solicitation for any transactions in financial instruments and/or a guarantee and/or prediction of future performance. ForexTime (FXTM), its affiliates, agents, directors, officers or employees do not guarantee the accuracy, validity, timeliness or completeness, of any information or data made available and assume no liability as to any loss arising from any investment based on the same.


Forex-Time-LogoArticle by ForexTime

ForexTime Ltd (FXTM) is an award winning international online forex broker regulated by CySEC 185/12 www.forextime.com

Key events this week: Can US stocks climb higher?

By Han Tan Market Analyst, ForexTime

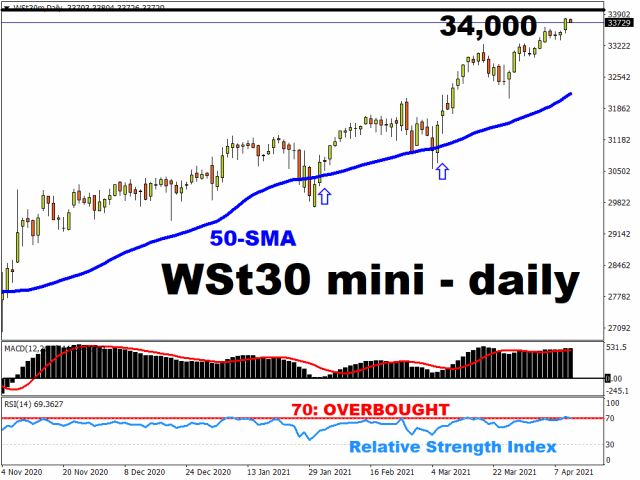
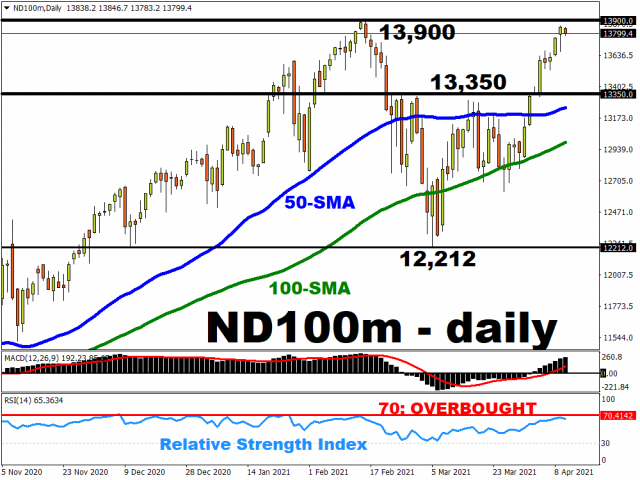
The Dow, S&P 500, and the Nasdaq 100 all posted new record highs last week, although the futures contract for all three benchmark indices are easing slightly at the time of writing. From a technical perspective, such dips are only natural as these assets pull away form overbought territory, as adjudged by their respective 14-day relative strength indexes.

“Markets Extra” Podcast: What is an index and why it matters? A chat with Nasdaq

Last week was also the calmest week for the US stock market so far in 2021, with this past Friday’s trading volume at its lowest since Christmas eve, according to Bloomberg data. Wall Street’s fabled fear gauge, the VIX index, fell to its lowest since February 2020, before the pandemic forced lockdowns across the developed world.

Perhaps the most pressing questions now: how long will this tranquility last, and can these benchmark US indices post fresh record peaks?

Much could depend on the key data and events this week:


Tuesday, April 13

  • US consumer price index

Wednesday, April 14:

  • Fed Beige Book
  • Fed chair Jerome Powell speech
  • US earnings season kicks off

Thursday, April 15:

  • US retail sales and industrial production

Friday, April 16:

  • US consumer sentiment


Inflation expectations still a primary driver of market sentiment

The outlook for US inflation still remains a hot topic for debate.

On one hand, markets expect prices to rise, fueled by the trillions that have been pumped into the economy by the US government and the Federal Reserve. On the other hand, Fed officials have often reiterated their expectations that any burst of inflation is likely to fade away. They have also sought to repeatedly assure the markets that policymakers have the tools to rein in inflationary pressures if they start to do damage to the economic recovery.

With all that in mind, Tuesday’s release of the US March consumer price index is set to be used as the next marker in ascertaining whether markets’ expectations for an inflation overshoot are warranted. Economists expect the month-on-month print to come in at 0.5%, 10 basis points compared to February’s reading. The year-on-year headline CPI is expected to come in at 2.5%, although investors will be cognizant of the low base effect from March 2020.

All that said, a higher-than-expected inflation reading could prompt more selling of US Treasuries, pushing yields higher while triggering volatility in equities. Overvalued tech names stand to lose out in such a scenario, potentially eroding the Nasdaq 100’s month-to-date gains of 5.76%.


Of course, investors will be parsing through all of the key events listed above, and assessing how each of them (Fed Beige Book, Powell’s speech, retail sales, industrial production, consumer sentiment) could fit into the broader narrative surrounding US inflation and the Fed’s policy response.

If markets get the impression that the Fed has got it wrong, and may have to ease up on their asset purchases and raise US interest rates sooner than expected, that could send a jolt across multiple asset classes and dampen the tech stocks party once more.

Earnings season to encourage risk-on mood?

Still, investor sentiment could be buffered by what’s expected to be the highest earnings growth for S&P 500 companies in a decade!

Earnings season kicks off on Wednesday, with financial heavyweights such as JPMorgan, Goldman Sachs, and Wells Fargo reporting their respective quarterly financial results.

According to FactSet, it’s estimated that earnings could grow by 23.8% year-on-year, although the actual figure might be at least 28%. More surprises to the upside could spell further gains for the S&P 500.

The main story around the US stock market remains the US economic recovery. Fed Chair Jerome Powell, in a TV interview that was aired over the weekend, said that the US economy is at an “inflection point” and that “the outlook has brightened substantially”. He also warned of that a resurgence of Covid-19 in the States is a major risk to the economic recovery.

Unless such a negative risk materializes, markets think that the recovery that runs too far too fast could influence the Fed policy outlook, although such a narrative is still subject for interpretation. A massive shift in expectations surrounding the Fed’s policy trajectory, which causes an unruly surge in Treasury yields, could upend the risk-on party. Also, if the inoculation efforts are derailed which dashes the optimism surrounding the US economic recovery, that could warrant a pullback in stocks as well.

Until such things happen, I do expect stocks to continue claiming higher ground over the near-term.


Disclaimer: The content in this article comprises personal opinions and should not be construed as containing personal and/or other investment advice and/or an offer of and/or solicitation for any transactions in financial instruments and/or a guarantee and/or prediction of future performance. ForexTime (FXTM), its affiliates, agents, directors, officers or employees do not guarantee the accuracy, validity, timeliness or completeness, of any information or data made available and assume no liability as to any loss arising from any investment based on the same.


Forex-Time-LogoArticle by ForexTime

ForexTime Ltd (FXTM) is an award winning international online forex broker regulated by CySEC 185/12 www.forextime.com

Gold Is Consolidating After Growth

Author: Dmitriy Gurkovskiy, Chief Analyst at RoboForex

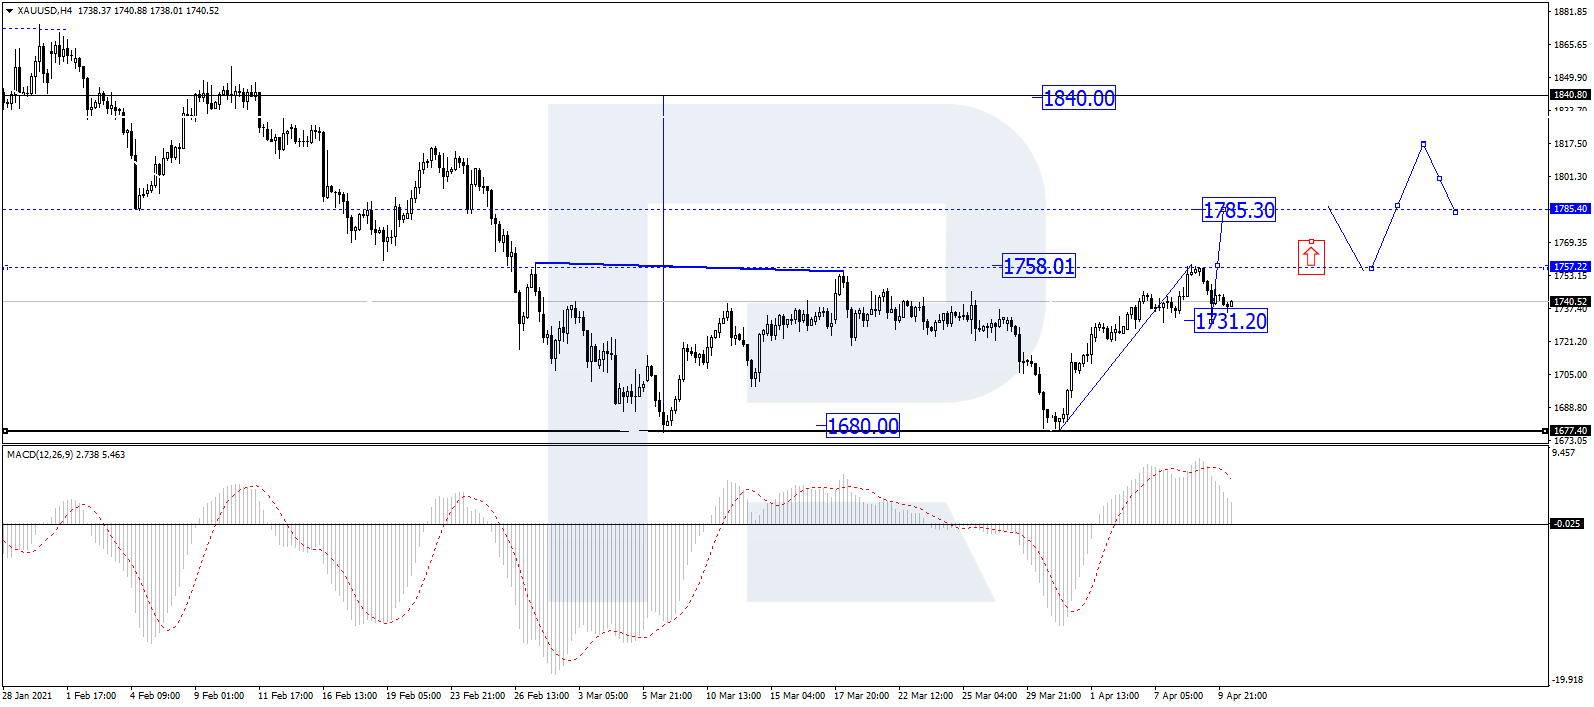
Early in the third week of April, Gold is consolidating not far from $1737 per troy ounce. It’s not bad especially given the March prices and investor’s attitude towards the precious metal.

From the fundamental point of view, the current market conditions are rather neutral for Gold. The physical demand is low: major economies are in no hurry to completely remove lockdowns and quarantine restrictions although they allow their citizens to have freedom of movement, which, in its turn, has a positive effect on consumer demand. In the future, when social restrictions are finally removed, consumer interest in goods made of Gold will improve. As for the influence of the USD rate, which is oppositely correlating to the Gold price, everything is quite calm right now. EUR/USD is trading at 1.1890 and looking rather inactive in anticipation of new catalysts.

In the long-term, Gold is supported by the demand from the car manufacturing industry but it will increase when the industry gets back to its normal pre-COVID-19 times – not earlier than the second half of 2021.

As we can see in the H4 chart, XAU/USD is growing with the target at 1840.00 Today, the metal may grow to break 1758.00 and then continue moving upwards to reach 1785.30. After that, the instrument may return to 1758.00 to test it from above and then resume its growth towards the above-mentioned target. From the technical point of view, this scenario is confirmed by MACD Oscillator: its signal line is moving above 0 outside the histogram area, thus implying a correction towards 1731.20. After the line re-enters the histogram area, the price chart will boost its growth.

In the H1 chart, XAU/USD is consolidating above 1731.20. If the price breaks this range to the downside, the market may correct to reach 1720.00; if to the upside – resume trading upwards with the target at 1785.30. From the technical point of view, this scenario is confirmed by the Stochastic Oscillator: its signal is moving to break 50 to the upside and then continue growing towards 80.

Disclaimer

Any forecasts contained herein are based on the author’s particular opinion. This analysis may not be treated as trading advice. RoboForex bears no responsibility for trading results based on trading recommendations and reviews contained herein.

COT Currency Futures Charts: Brazil Real, Swiss Franc, Euro, US Dollar & Bitcoin

By CountingPips.comReceive our weekly COT Reports by Email

Here are the latest charts and statistics for the Commitment of Traders (COT) data published by the Commodities Futures Trading Commission (CFTC).

The latest COT data is updated through Tuesday April 06 2021 and shows a quick view of how large traders (for-profit speculators and commercial entities) were positioned in the futures markets. All currency positions are in direct relation to the US dollar where, for example, a bet for the euro is a bet that the euro will rise versus the dollar while a bet against the euro will be a bet that the euro will decline versus the dollar.


US DOLLAR INDEX Futures:
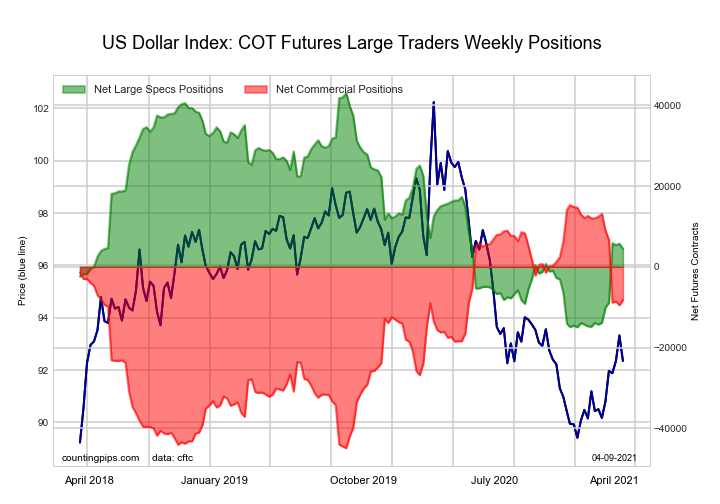

The US DOLLAR INDEX: large speculator standing this week equaled a net position of 4,449 contracts in the data reported through Tuesday. This was a weekly decrease of -1,277 contracts from the previous week which had a total of 5,726 net contracts.

This week’s current strength score (the trader positioning range over the past three years, measured from 0 to 100) shows the speculators are currently Bearish with a score of 33.5 percent. The commercials are Bullish with a score of 60.9 percent and the small traders (not shown in chart) are Bullish with a score of 68.3 percent.

US DOLLAR INDEX StatisticsSPECULATORSCOMMERCIALSSMALL TRADERS
– Percent of Open Interest Longs:70.86.915.8
– Percent of Open Interest Shorts:59.528.06.1
– Net Position:4,449-8,2313,782
– Gross Longs:27,7062,7136,179
– Gross Shorts:23,25710,9442,397
– Long to Short Ratio:1.2 to 10.2 to 12.6 to 1
NET POSITION TREND:
– COT Index Score (3 Year Range Pct):33.560.968.3
– COT Index Reading (3 Year Range):BearishBullishBullish
NET POSITION MOVEMENT INDEX:
– 6-Week Change in Strength Index:31.6-35.539.3


EURO Currency Futures:


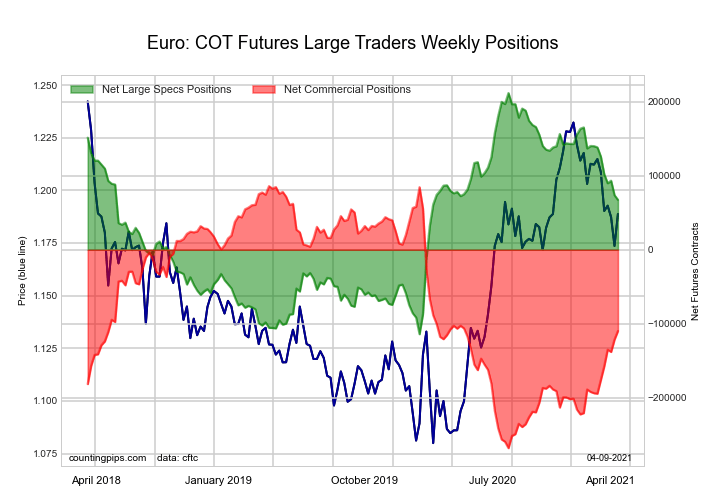
The EURO Currency: large speculator standing this week equaled a net position of 67,522 contracts in the data reported through Tuesday. This was a weekly reduction of -6,217 contracts from the previous week which had a total of 73,739 net contracts.

This week’s current strength score (the trader positioning range over the past three years, measured from 0 to 100) shows the speculators are currently Bullish with a score of 55.7 percent. The commercials are Bearish with a score of 44.7 percent and the small traders (not shown in chart) are Bullish with a score of 64.6 percent.

EURO Currency StatisticsSPECULATORSCOMMERCIALSSMALL TRADERS
– Percent of Open Interest Longs:29.955.114.0
– Percent of Open Interest Shorts:19.472.27.4
– Net Position:67,522-109,74142,219
– Gross Longs:192,230354,40189,693
– Gross Shorts:124,708464,14247,474
– Long to Short Ratio:1.5 to 10.8 to 11.9 to 1
NET POSITION TREND:
– COT Index Score (3 Year Range Pct):55.744.764.6
– COT Index Reading (3 Year Range):BullishBearishBullish
NET POSITION MOVEMENT INDEX:
– 6-Week Change in Strength Index:-21.723.9-24.2


BRITISH POUND STERLING Futures:


The BRITISH POUND STERLING: large speculator standing this week equaled a net position of 19,951 contracts in the data reported through Tuesday. This was a weekly lowering of -5,008 contracts from the previous week which had a total of 24,959 net contracts.

This week’s current strength score (the trader positioning range over the past three years, measured from 0 to 100) shows the speculators are currently Bullish-Extreme with a score of 81.5 percent. The commercials are Bearish-Extreme with a score of 18.3 percent and the small traders (not shown in chart) are Bullish-Extreme with a score of 86.8 percent.

BRITISH POUND StatisticsSPECULATORSCOMMERCIALSSMALL TRADERS
– Percent of Open Interest Longs:32.242.524.9
– Percent of Open Interest Shorts:18.063.917.6
– Net Position:19,951-30,12710,176
– Gross Longs:45,27059,71434,960
– Gross Shorts:25,31989,84124,784
– Long to Short Ratio:1.8 to 10.7 to 11.4 to 1
NET POSITION TREND:
– COT Index Score (3 Year Range Pct):81.518.386.8
– COT Index Reading (3 Year Range):Bullish-ExtremeBearish-ExtremeBullish-Extreme
NET POSITION MOVEMENT INDEX:
– 6-Week Change in Strength Index:-7.38.0-8.2


JAPANESE YEN Futures:


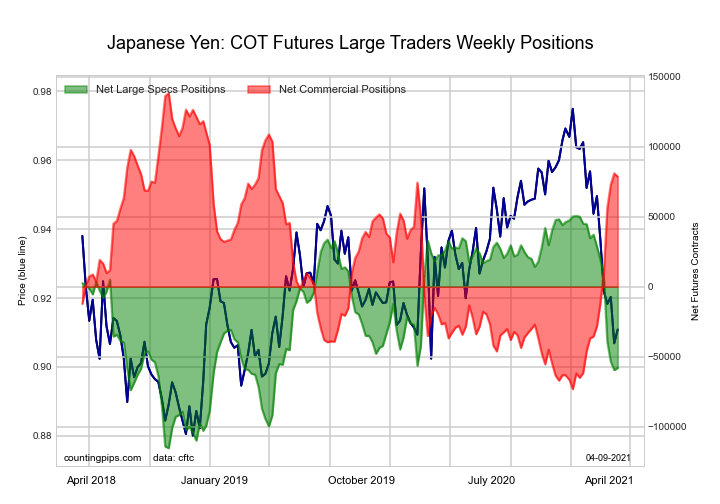
The JAPANESE YEN: large speculator standing this week equaled a net position of -57,989 contracts in the data reported through Tuesday. This was a weekly lift of 1,492 contracts from the previous week which had a total of -59,481 net contracts.

This week’s current strength score (the trader positioning range over the past three years, measured from 0 to 100) shows the speculators are currently Bearish with a score of 34.5 percent. The commercials are Bullish with a score of 71.8 percent and the small traders (not shown in chart) are Bearish-Extreme with a score of 16.9 percent.

JAPANESE YEN StatisticsSPECULATORSCOMMERCIALSSMALL TRADERS
– Percent of Open Interest Longs:16.371.711.5
– Percent of Open Interest Shorts:51.623.924.0
– Net Position:-57,98978,537-20,548
– Gross Longs:26,794117,84618,907
– Gross Shorts:84,78339,30939,455
– Long to Short Ratio:0.3 to 13.0 to 10.5 to 1
NET POSITION TREND:
– COT Index Score (3 Year Range Pct):34.571.816.9
– COT Index Reading (3 Year Range):BearishBullishBearish-Extreme
NET POSITION MOVEMENT INDEX:
– 6-Week Change in Strength Index:-52.350.5-38.2


SWISS FRANC Futures:


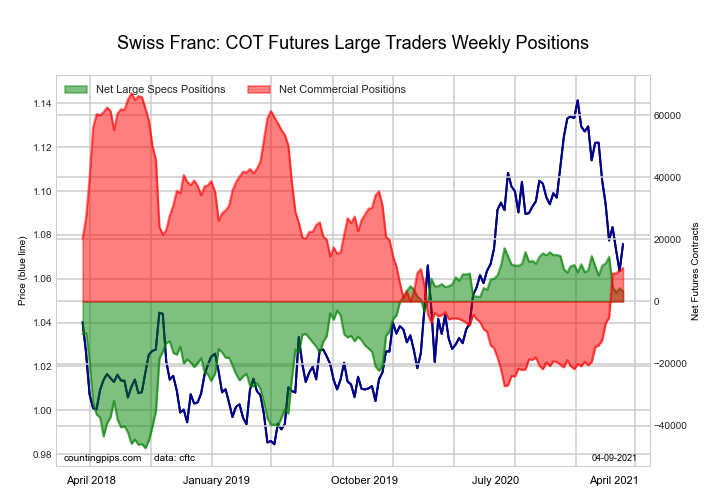
The SWISS FRANC: large speculator standing this week equaled a net position of 3,245 contracts in the data reported through Tuesday. This was a weekly decrease of -1,024 contracts from the previous week which had a total of 4,269 net contracts.

This week’s current strength score (the trader positioning range over the past three years, measured from 0 to 100) shows the speculators are currently Bullish with a score of 78.4 percent. The commercials are Bearish with a score of 40.3 percent and the small traders (not shown in chart) are Bearish with a score of 27.5 percent.

SWISS FRANC StatisticsSPECULATORSCOMMERCIALSSMALL TRADERS
– Percent of Open Interest Longs:35.943.420.3
– Percent of Open Interest Shorts:28.518.752.4
– Net Position:3,24510,786-14,031
– Gross Longs:15,69018,9708,848
– Gross Shorts:12,4458,18422,879
– Long to Short Ratio:1.3 to 12.3 to 10.4 to 1
NET POSITION TREND:
– COT Index Score (3 Year Range Pct):78.440.327.5
– COT Index Reading (3 Year Range):BullishBearishBearish
NET POSITION MOVEMENT INDEX:
– 6-Week Change in Strength Index:-12.924.7-41.1


CANADIAN DOLLAR Futures:


The CANADIAN DOLLAR: large speculator standing this week equaled a net position of 2,690 contracts in the data reported through Tuesday. This was a weekly lowering of -3,828 contracts from the previous week which had a total of 6,518 net contracts.

This week’s current strength score (the trader positioning range over the past three years, measured from 0 to 100) shows the speculators are currently Bullish with a score of 57.2 percent. The commercials are Bearish with a score of 29.0 percent and the small traders (not shown in chart) are Bullish-Extreme with a score of 87.1 percent.

CANADIAN DOLLAR StatisticsSPECULATORSCOMMERCIALSSMALL TRADERS
– Percent of Open Interest Longs:28.642.927.5
– Percent of Open Interest Shorts:27.060.611.4
– Net Position:2,690-29,42126,731
– Gross Longs:47,50671,32945,729
– Gross Shorts:44,816100,75018,998
– Long to Short Ratio:1.1 to 10.7 to 12.4 to 1
NET POSITION TREND:
– COT Index Score (3 Year Range Pct):57.229.087.1
– COT Index Reading (3 Year Range):BullishBearishBullish-Extreme
NET POSITION MOVEMENT INDEX:
– 6-Week Change in Strength Index:-5.47.7-7.6


AUSTRALIAN DOLLAR Futures:


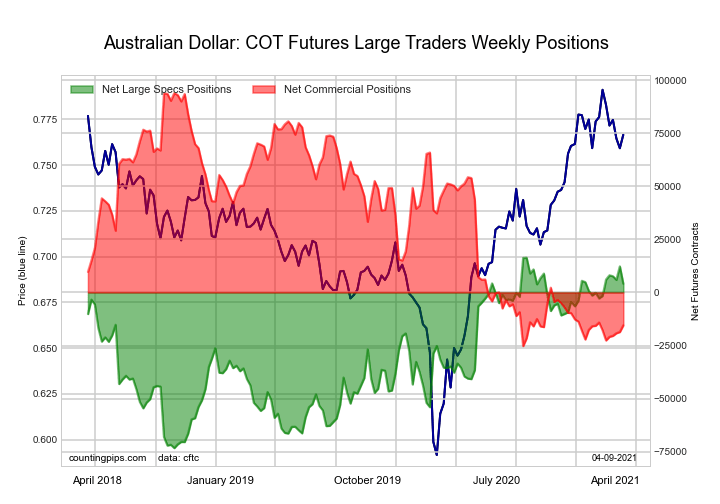
The AUSTRALIAN DOLLAR: large speculator standing this week equaled a net position of 4,066 contracts in the data reported through Tuesday. This was a weekly decrease of -8,197 contracts from the previous week which had a total of 12,263 net contracts.

This week’s current strength score (the trader positioning range over the past three years, measured from 0 to 100) shows the speculators are currently Bullish-Extreme with a score of 86.3 percent. The commercials are Bearish-Extreme with a score of 8.2 percent and the small traders (not shown in chart) are Bullish-Extreme with a score of 82.2 percent.

AUSTRALIAN DOLLAR StatisticsSPECULATORSCOMMERCIALSSMALL TRADERS
– Percent of Open Interest Longs:45.932.321.4
– Percent of Open Interest Shorts:42.943.613.1
– Net Position:4,066-15,49411,428
– Gross Longs:62,99144,30829,395
– Gross Shorts:58,92559,80217,967
– Long to Short Ratio:1.1 to 10.7 to 11.6 to 1
NET POSITION TREND:
– COT Index Score (3 Year Range Pct):86.38.282.2
– COT Index Reading (3 Year Range):Bullish-ExtremeBearish-ExtremeBullish-Extreme
NET POSITION MOVEMENT INDEX:
– 6-Week Change in Strength Index:6.42.0-17.8


NEW ZEALAND DOLLAR Futures:


The NEW ZEALAND DOLLAR: large speculator standing this week equaled a net position of 3,138 contracts in the data reported through Tuesday. This was a weekly decline of -908 contracts from the previous week which had a total of 4,046 net contracts.

This week’s current strength score (the trader positioning range over the past three years, measured from 0 to 100) shows the speculators are currently Bullish with a score of 65.1 percent. The commercials are Bearish with a score of 32.3 percent and the small traders (not shown in chart) are Bullish with a score of 73.2 percent.

NEW ZEALAND DOLLAR StatisticsSPECULATORSCOMMERCIALSSMALL TRADERS
– Percent of Open Interest Longs:51.431.413.7
– Percent of Open Interest Shorts:43.044.68.9
– Net Position:3,138-4,9261,788
– Gross Longs:19,19911,7325,127
– Gross Shorts:16,06116,6583,339
– Long to Short Ratio:1.2 to 10.7 to 11.5 to 1
NET POSITION TREND:
– COT Index Score (3 Year Range Pct):65.132.373.2
– COT Index Reading (3 Year Range):BullishBearishBullish
NET POSITION MOVEMENT INDEX:
– 6-Week Change in Strength Index:-16.418.2-21.4


MEXICAN PESO Futures:


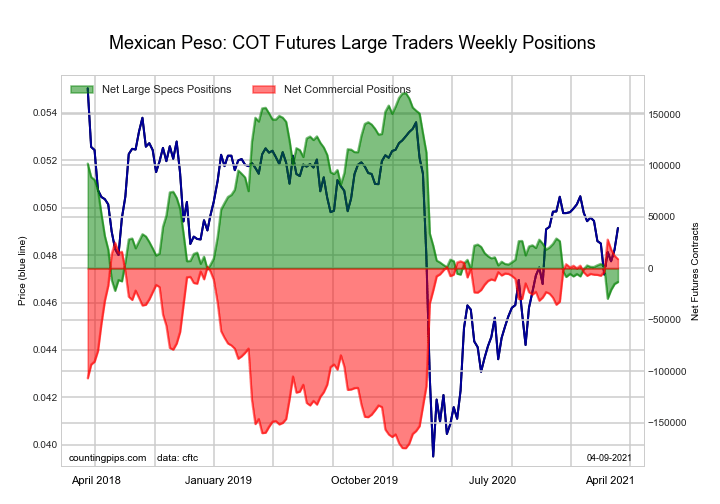
The MEXICAN PESO: large speculator standing this week equaled a net position of -13,142 contracts in the data reported through Tuesday. This was a weekly boost of 1,971 contracts from the previous week which had a total of -15,113 net contracts.

This week’s current strength score (the trader positioning range over the past three years, measured from 0 to 100) shows the speculators are currently Bearish-Extreme with a score of 8.2 percent. The commercials are Bullish-Extreme with a score of 90.6 percent and the small traders (not shown in chart) are Bullish with a score of 60.4 percent.

MEXICAN PESO StatisticsSPECULATORSCOMMERCIALSSMALL TRADERS
– Percent of Open Interest Longs:42.151.15.2
– Percent of Open Interest Shorts:51.744.52.2
– Net Position:-13,1429,0544,088
– Gross Longs:57,61069,9307,085
– Gross Shorts:70,75260,8762,997
– Long to Short Ratio:0.8 to 11.1 to 12.4 to 1
NET POSITION TREND:
– COT Index Score (3 Year Range Pct):8.290.660.4
– COT Index Reading (3 Year Range):Bearish-ExtremeBullish-ExtremeBullish
NET POSITION MOVEMENT INDEX:
– 6-Week Change in Strength Index:-8.17.63.7


BRAZIL REAL Futures:


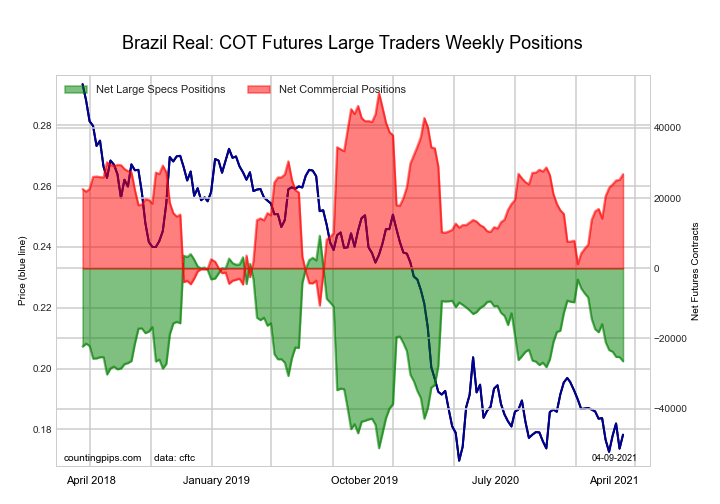
The BRAZIL REAL: large speculator standing this week equaled a net position of -26,506 contracts in the data reported through Tuesday. This was a weekly fall of -1,197 contracts from the previous week which had a total of -25,309 net contracts.

This week’s current strength score (the trader positioning range over the past three years, measured from 0 to 100) shows the speculators are currently Bearish with a score of 40.9 percent. The commercials are Bullish with a score of 61.8 percent and the small traders (not shown in chart) are Bullish with a score of 67.1 percent.

BRAZIL REAL StatisticsSPECULATORSCOMMERCIALSSMALL TRADERS
– Percent of Open Interest Longs:22.470.36.0
– Percent of Open Interest Shorts:81.111.06.7
– Net Position:-26,50626,820-314
– Gross Longs:10,10331,7662,716
– Gross Shorts:36,6094,9463,030
– Long to Short Ratio:0.3 to 16.4 to 10.9 to 1
NET POSITION TREND:
– COT Index Score (3 Year Range Pct):40.961.867.1
– COT Index Reading (3 Year Range):BearishBullishBullish
NET POSITION MOVEMENT INDEX:
– 6-Week Change in Strength Index:-17.520.9-26.7


RUSSIAN RUBLE Futures:


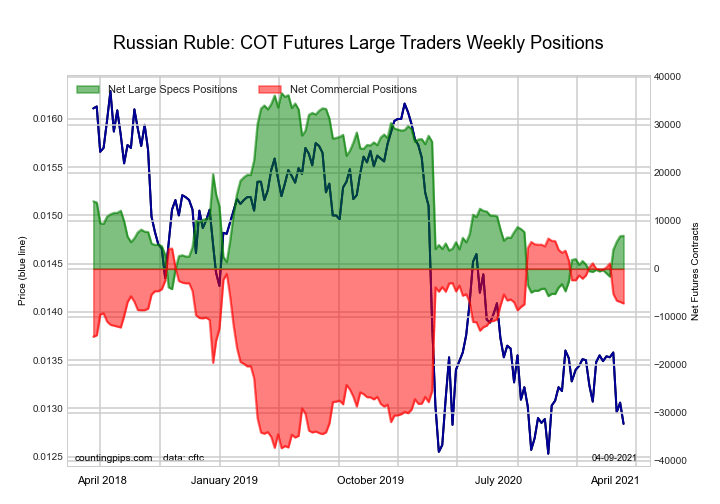
The RUSSIAN RUBLE: large speculator standing this week equaled a net position of 6,875 contracts in the data reported through Tuesday. This was a weekly boost of 91 contracts from the previous week which had a total of 6,784 net contracts.

This week’s current strength score (the trader positioning range over the past three years, measured from 0 to 100) shows the speculators are currently Bearish with a score of 29.7 percent. The commercials are Bullish with a score of 69.1 percent and the small traders (not shown in chart) are Bullish with a score of 53.0 percent.

RUSSIAN RUBLE StatisticsSPECULATORSCOMMERCIALSSMALL TRADERS
– Percent of Open Interest Longs:32.661.55.8
– Percent of Open Interest Shorts:9.385.94.7
– Net Position:6,875-7,185310
– Gross Longs:9,60018,1091,700
– Gross Shorts:2,72525,2941,390
– Long to Short Ratio:3.5 to 10.7 to 11.2 to 1
NET POSITION TREND:
– COT Index Score (3 Year Range Pct):29.769.153.0
– COT Index Reading (3 Year Range):BearishBullishBullish
NET POSITION MOVEMENT INDEX:
– 6-Week Change in Strength Index:16.9-16.0-5.4


BITCOIN FUTURES Futures:


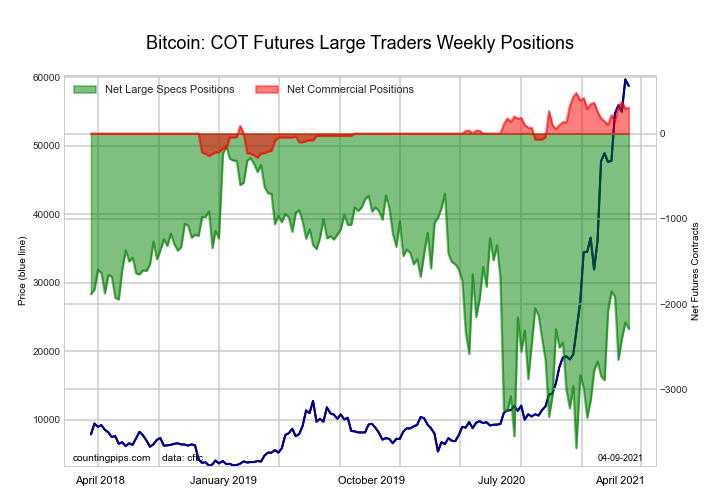
The BITCOIN FUTURES: large speculator standing this week equaled a net position of -2,292 contracts in the data reported through Tuesday. This was a weekly decline of -77 contracts from the previous week which had a total of -2,215 net contracts.

This week’s current strength score (the trader positioning range over the past three years, measured from 0 to 100) shows the speculators are currently Bearish with a score of 39.4 percent. The commercials are Bullish with a score of 76.9 percent and the small traders (not shown in chart) are Bullish with a score of 55.3 percent.

BITCOIN StatisticsSPECULATORSCOMMERCIALSSMALL TRADERS
– Percent of Open Interest Longs:60.25.127.8
– Percent of Open Interest Shorts:83.42.17.6
– Net Position:-2,2923001,992
– Gross Longs:5,9385042,742
– Gross Shorts:8,230204750
– Long to Short Ratio:0.7 to 12.5 to 13.7 to 1
NET POSITION TREND:
– COT Index Score (3 Year Range Pct):39.476.955.3
– COT Index Reading (3 Year Range):BearishBullishBullish
NET POSITION MOVEMENT INDEX:
– 6-Week Change in Strength Index:-5.826.30.3


Article By CountingPips.comReceive our weekly COT Reports by Email

*COT Report: The COT data, released weekly to the public each Friday, is updated through the most recent Tuesday (data is 3 days old) and shows a quick view of how large speculators or non-commercials (for-profit traders) were positioned in the futures markets.

The CFTC categorizes trader positions according to commercial hedgers (traders who use futures contracts for hedging as part of the business), non-commercials (large traders who speculate to realize trading profits) and nonreportable traders (usually small traders/speculators).

Find CFTC criteria here: (http://www.cftc.gov/MarketReports/CommitmentsofTraders/ExplanatoryNotes/index.htm).

COT Bonds Futures Charts: Fed Funds, 5-Year Treasury Notes, Eurodollar, 10-Year Treasury Notes

By CountingPips.comReceive our weekly COT Reports by Email

Here are the latest charts and statistics for the Commitment of Traders (COT) data published by the Commodities Futures Trading Commission (CFTC).

The latest COT data is updated through Tuesday April 06 2021 and shows a quick view of how large traders (for-profit speculators and commercial entities) were positioned in the futures markets.


30-Day Federal Funds Futures:

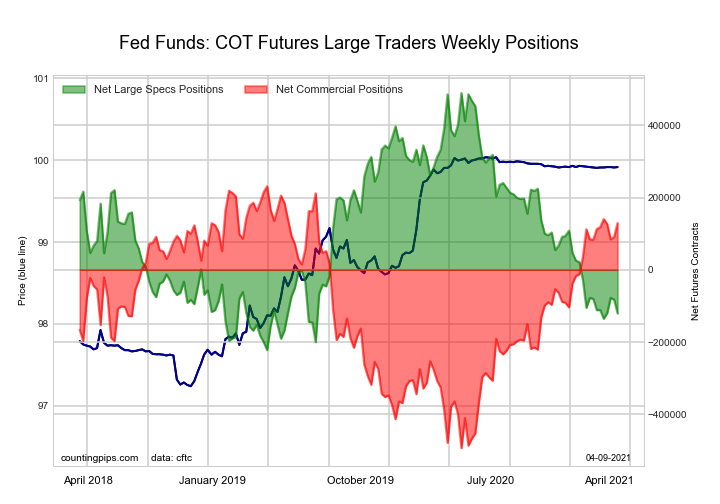
The 30-Day Federal Funds large speculator standing this week recorded a net position of -120,673 contracts in the data reported through Tuesday. This was a weekly fall of -38,042 contracts from the previous week which had a total of -82,631 net contracts.

This week’s current strength score (the trader positioning range over the past three years, measured from 0 to 100) shows the speculators are currently Bearish-Extreme with a score of 14.3 percent. The commercials are Bullish-Extreme with a score of 86.0 percent and the small traders (not shown in chart) are Bullish with a score of 55.3 percent.

30-Day Federal Funds StatisticsSPECULATORSCOMMERCIALSSMALL TRADERS
– Percent of Open Interest Longs:8.370.52.2
– Percent of Open Interest Shorts:20.357.73.0
– Net Position:-120,673129,362-8,689
– Gross Longs:84,005711,31321,909
– Gross Shorts:204,678581,95130,598
– Long to Short Ratio:0.4 to 11.2 to 10.7 to 1
NET POSITION TREND:
– COT Index Score (3 Year Range Pct):14.386.055.3
– COT Index Reading (3 Year Range):Bearish-ExtremeBullish-ExtremeBullish
NET POSITION MOVEMENT INDEX:
– 6-Week Change in Strength Index:-1.32.3-13.4


2-Year Treasury Note Futures:

The 2-Year Treasury Note large speculator standing this week recorded a net position of -375,820 contracts in the data reported through Tuesday. This was a weekly lowering of -29,128 contracts from the previous week which had a total of -346,692 net contracts.

This week’s current strength score (the trader positioning range over the past three years, measured from 0 to 100) shows the speculators are currently Bearish-Extreme with a score of 8.6 percent. The commercials are Bullish-Extreme with a score of 85.7 percent and the small traders (not shown in chart) are Bearish with a score of 46.0 percent.

2-Year Treasury Note StatisticsSPECULATORSCOMMERCIALSSMALL TRADERS
– Percent of Open Interest Longs:16.975.96.2
– Percent of Open Interest Shorts:33.260.65.3
– Net Position:-375,820354,77721,043
– Gross Longs:390,9011,754,671142,678
– Gross Shorts:766,7211,399,894121,635
– Long to Short Ratio:0.5 to 11.3 to 11.2 to 1
NET POSITION TREND:
– COT Index Score (3 Year Range Pct):8.685.746.0
– COT Index Reading (3 Year Range):Bearish-ExtremeBullish-ExtremeBearish
NET POSITION MOVEMENT INDEX:
– 6-Week Change in Strength Index:-70.073.9-25.6


5-Year Treasury Note Futures:

The 5-Year Treasury Note large speculator standing this week recorded a net position of -7,617 contracts in the data reported through Tuesday. This was a weekly lowering of -102,952 contracts from the previous week which had a total of 95,335 net contracts.

This week’s current strength score (the trader positioning range over the past three years, measured from 0 to 100) shows the speculators are currently Bullish-Extreme with a score of 89.3 percent. The commercials are Bearish with a score of 22.3 percent and the small traders (not shown in chart) are Bearish with a score of 21.4 percent.

5-Year Treasury Note StatisticsSPECULATORSCOMMERCIALSSMALL TRADERS
– Percent of Open Interest Longs:13.676.37.6
– Percent of Open Interest Shorts:13.872.311.3
– Net Position:-7,617141,544-133,927
– Gross Longs:485,2392,727,948271,735
– Gross Shorts:492,8562,586,404405,662
– Long to Short Ratio:1.0 to 11.1 to 10.7 to 1
NET POSITION TREND:
– COT Index Score (3 Year Range Pct):89.322.321.4
– COT Index Reading (3 Year Range):Bullish-ExtremeBearishBearish
NET POSITION MOVEMENT INDEX:
– 6-Week Change in Strength Index:-10.715.1-26.1


10-Year Treasury Note Futures:

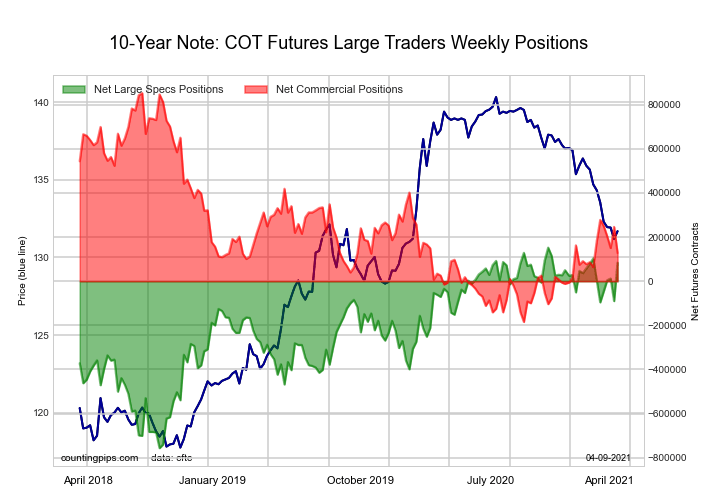
The 10-Year Treasury Note large speculator standing this week recorded a net position of 84,559 contracts in the data reported through Tuesday. This was a weekly gain of 174,361 contracts from the previous week which had a total of -89,802 net contracts.

This week’s current strength score (the trader positioning range over the past three years, measured from 0 to 100) shows the speculators are currently Bullish-Extreme with a score of 92.5 percent. The commercials are Bearish with a score of 30.1 percent and the small traders (not shown in chart) are Bearish-Extreme with a score of 16.2 percent.

10-Year Treasury Note StatisticsSPECULATORSCOMMERCIALSSMALL TRADERS
– Percent of Open Interest Longs:18.772.08.0
– Percent of Open Interest Shorts:16.568.713.4
– Net Position:84,559128,010-212,569
– Gross Longs:732,6872,821,476313,947
– Gross Shorts:648,1282,693,466526,516
– Long to Short Ratio:1.1 to 11.0 to 10.6 to 1
NET POSITION TREND:
– COT Index Score (3 Year Range Pct):92.530.116.2
– COT Index Reading (3 Year Range):Bullish-ExtremeBearishBearish-Extreme
NET POSITION MOVEMENT INDEX:
– 6-Week Change in Strength Index:9.0-5.1-7.8


Ultra 10-Year Notes Futures:

The Ultra 10-Year Notes large speculator standing this week recorded a net position of 170,635 contracts in the data reported through Tuesday. This was a weekly decrease of -64,475 contracts from the previous week which had a total of 235,110 net contracts.

This week’s current strength score (the trader positioning range over the past three years, measured from 0 to 100) shows the speculators are currently Bullish with a score of 72.8 percent. The commercials are Bearish with a score of 34.0 percent and the small traders (not shown in chart) are Bearish-Extreme with a score of 0.0 percent.

Ultra 10-Year Notes StatisticsSPECULATORSCOMMERCIALSSMALL TRADERS
– Percent of Open Interest Longs:21.071.17.6
– Percent of Open Interest Shorts:9.173.717.0
– Net Position:170,635-36,437-134,198
– Gross Longs:300,2461,017,164108,960
– Gross Shorts:129,6111,053,601243,158
– Long to Short Ratio:2.3 to 11.0 to 10.4 to 1
NET POSITION TREND:
– COT Index Score (3 Year Range Pct):72.834.00.0
– COT Index Reading (3 Year Range):BullishBearishBearish-Extreme
NET POSITION MOVEMENT INDEX:
– 6-Week Change in Strength Index:-0.72.7-6.6


US Treasury Bonds Futures:

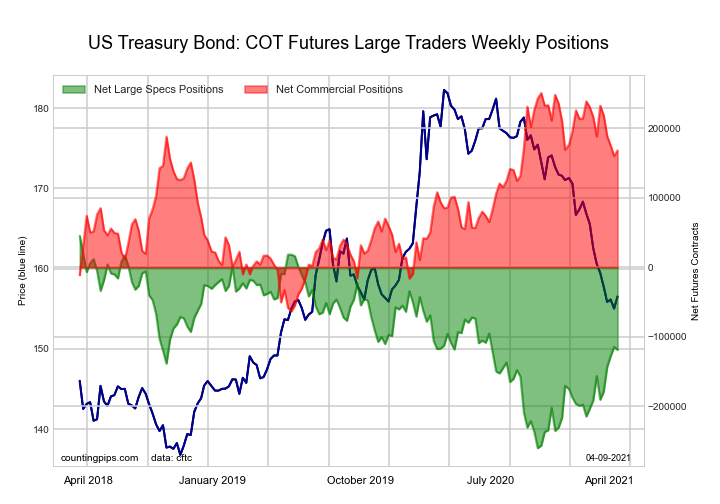
The US Treasury Bonds large speculator standing this week recorded a net position of -118,494 contracts in the data reported through Tuesday. This was a weekly decrease of -4,055 contracts from the previous week which had a total of -114,439 net contracts.

This week’s current strength score (the trader positioning range over the past three years, measured from 0 to 100) shows the speculators are currently Bearish with a score of 46.3 percent. The commercials are Bullish with a score of 73.7 percent and the small traders (not shown in chart) are Bearish-Extreme with a score of 16.2 percent.

US Treasury Bonds StatisticsSPECULATORSCOMMERCIALSSMALL TRADERS
– Percent of Open Interest Longs:6.278.613.2
– Percent of Open Interest Shorts:16.364.317.5
– Net Position:-118,494168,164-49,670
– Gross Longs:72,722920,918154,881
– Gross Shorts:191,216752,754204,551
– Long to Short Ratio:0.4 to 11.2 to 10.8 to 1
NET POSITION TREND:
– COT Index Score (3 Year Range Pct):46.373.716.2
– COT Index Reading (3 Year Range):BearishBullishBearish-Extreme
NET POSITION MOVEMENT INDEX:
– 6-Week Change in Strength Index:12.4-6.4-13.6


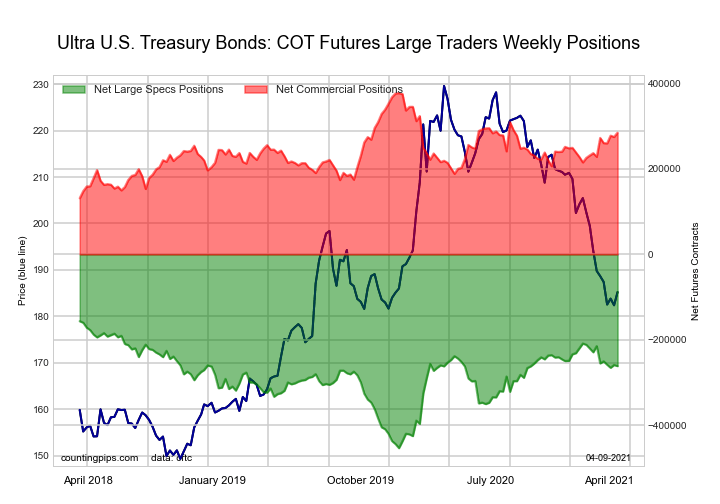
Ultra US Treasury Bonds Futures:

The Ultra US Treasury Bonds large speculator standing this week recorded a net position of -261,819 contracts in the data reported through Tuesday. This was a weekly reduction of -2,695 contracts from the previous week which had a total of -259,124 net contracts.

This week’s current strength score (the trader positioning range over the past three years, measured from 0 to 100) shows the speculators are currently Bullish with a score of 64.6 percent. The commercials are Bullish with a score of 62.3 percent and the small traders (not shown in chart) are Bearish-Extreme with a score of 0.0 percent.

Ultra US Treasury Bonds StatisticsSPECULATORSCOMMERCIALSSMALL TRADERS
– Percent of Open Interest Longs:5.182.711.8
– Percent of Open Interest Shorts:28.257.613.8
– Net Position:-261,819285,070-23,251
– Gross Longs:58,261938,845133,842
– Gross Shorts:320,080653,775157,093
– Long to Short Ratio:0.2 to 11.4 to 10.9 to 1
NET POSITION TREND:
– COT Index Score (3 Year Range Pct):64.662.30.0
– COT Index Reading (3 Year Range):BullishBullishBearish-Extreme
NET POSITION MOVEMENT INDEX:
– 6-Week Change in Strength Index:-15.722.9-7.9


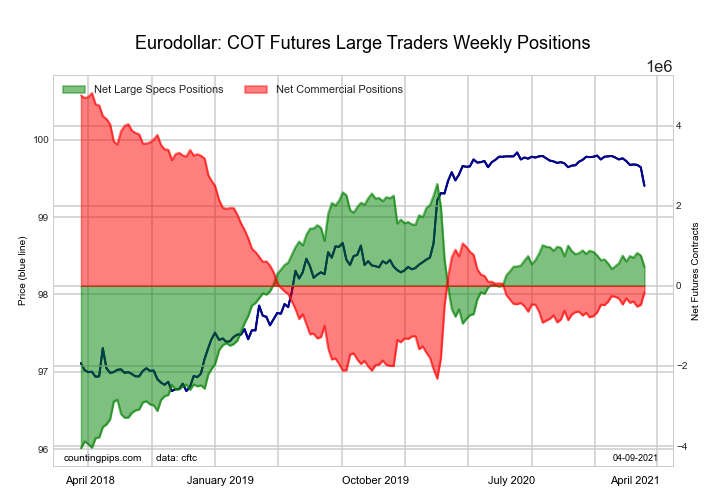
3-Month Eurodollars Futures:

The 3-Month Eurodollars large speculator standing this week recorded a net position of 468,445 contracts in the data reported through Tuesday. This was a weekly fall of -289,661 contracts from the previous week which had a total of 758,106 net contracts.

This week’s current strength score (the trader positioning range over the past three years, measured from 0 to 100) shows the speculators are currently Bullish with a score of 68.5 percent. The commercials are Bearish with a score of 30.2 percent and the small traders (not shown in chart) are Bullish with a score of 63.7 percent.

3-Month Eurodollars StatisticsSPECULATORSCOMMERCIALSSMALL TRADERS
– Percent of Open Interest Longs:20.149.55.1
– Percent of Open Interest Shorts:16.050.97.8
– Net Position:468,445-163,288-305,157
– Gross Longs:2,331,7615,751,008596,999
– Gross Shorts:1,863,3165,914,296902,156
– Long to Short Ratio:1.3 to 11.0 to 10.7 to 1
NET POSITION TREND:
– COT Index Score (3 Year Range Pct):68.530.263.7
– COT Index Reading (3 Year Range):BullishBearishBullish
NET POSITION MOVEMENT INDEX:
– 6-Week Change in Strength Index:-4.34.2-2.3


Article By CountingPips.comReceive our weekly COT Reports by Email

*COT Report: The COT data, released weekly to the public each Friday, is updated through the most recent Tuesday (data is 3 days old) and shows a quick view of how large speculators or non-commercials (for-profit traders) were positioned in the futures markets.

The CFTC categorizes trader positions according to commercial hedgers (traders who use futures contracts for hedging as part of the business), non-commercials (large traders who speculate to realize trading profits) and nonreportable traders (usually small traders/speculators).

Find CFTC criteria here: (http://www.cftc.gov/MarketReports/CommitmentsofTraders/ExplanatoryNotes/index.htm).

COT Energy Futures Charts: Natural Gas, Bloomberg Index, Crude Oil, Heating Oil

By CountingPips.comReceive our weekly COT Reports by Email

Here are the latest charts and statistics for the Commitment of Traders (COT) data published by the Commodities Futures Trading Commission (CFTC).

The latest COT data is updated through Tuesday April 06 2021 and shows a quick view of how large traders (for-profit speculators and commercial entities) were positioned in the futures markets.


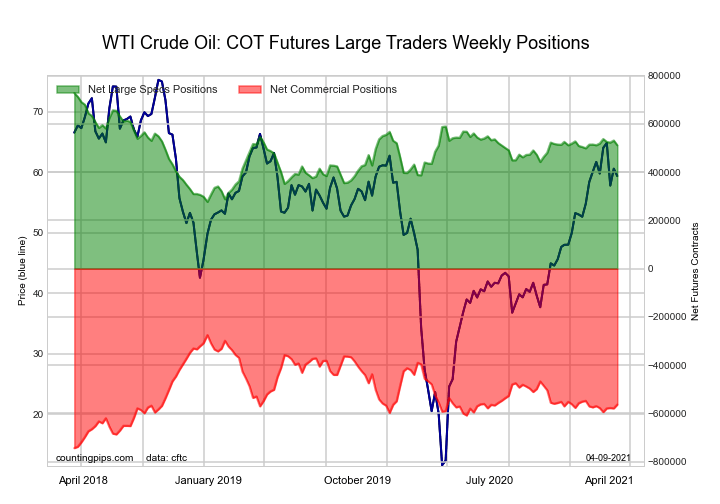
WTI Crude Oil Futures: Futures:


The WTI Crude Oil Futures: large speculator standing this week was a net position of 511,725 contracts in the data reported through Tuesday. This was a weekly reduction of -19,585 contracts from the previous week which had a total of 531,310 net contracts.

This week’s current strength score (the trader positioning range over the past three years, measured from 0 to 100) shows the speculators are currently Bullish with a score of 52.0 percent. The commercials are Bearish with a score of 38.5 percent and the small traders (not shown in chart) are Bullish-Extreme with a score of 88.2 percent.

WTI Crude Oil Futures StatisticsSPECULATORSCOMMERCIALSSMALL TRADERS
– Percent of Open Interest Longs:27.733.54.4
– Percent of Open Interest Shorts:5.957.62.2
– Net Position:511,725-563,47451,749
– Gross Longs:649,237784,153102,770
– Gross Shorts:137,5121,347,62751,021
– Long to Short Ratio:4.7 to 10.6 to 12.0 to 1
NET POSITION TREND:
– COT Index Score (3 Year Range Pct):52.038.588.2
– COT Index Reading (3 Year Range):BullishBearishBullish-Extreme
NET POSITION MOVEMENT INDEX:
– 6-Week Change in Strength Index:-0.01.4-8.8


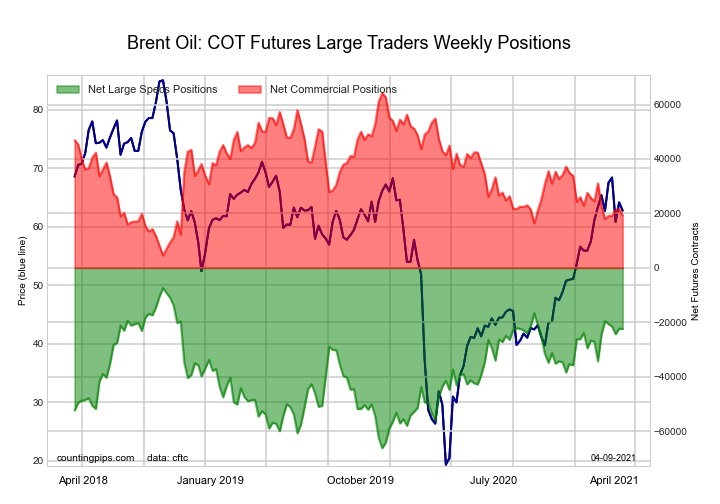
Brent Crude Oil Futures (LAST DAY): Futures:


The Brent Crude Oil Futures (LAST DAY): large speculator standing this week was a net position of -22,410 contracts in the data reported through Tuesday. This was a weekly lowering of -89 contracts from the previous week which had a total of -22,321 net contracts.

This week’s current strength score (the trader positioning range over the past three years, measured from 0 to 100) shows the speculators are currently Bullish with a score of 74.5 percent. The commercials are Bearish with a score of 24.8 percent and the small traders (not shown in chart) are Bearish with a score of 43.5 percent.

Brent Crude Oil Futures StatisticsSPECULATORSCOMMERCIALSSMALL TRADERS
– Percent of Open Interest Longs:18.042.13.4
– Percent of Open Interest Shorts:28.333.22.0
– Net Position:-22,41019,3233,087
– Gross Longs:39,22491,5637,482
– Gross Shorts:61,63472,2404,395
– Long to Short Ratio:0.6 to 11.3 to 11.7 to 1
NET POSITION TREND:
– COT Index Score (3 Year Range Pct):74.524.843.5
– COT Index Reading (3 Year Range):BullishBearishBearish
NET POSITION MOVEMENT INDEX:
– 6-Week Change in Strength Index:3.5-5.47.1


Natural Gas Futures (CME): Futures:


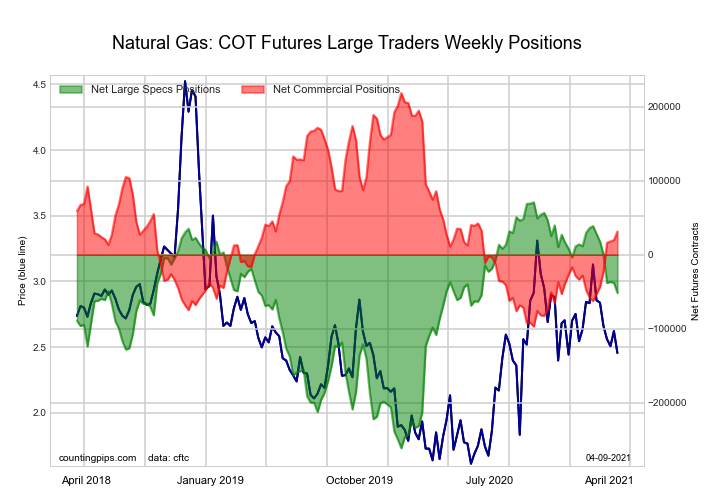
The Natural Gas Futures (CME): large speculator standing this week was a net position of -51,583 contracts in the data reported through Tuesday. This was a weekly lowering of -13,699 contracts from the previous week which had a total of -37,884 net contracts.

This week’s current strength score (the trader positioning range over the past three years, measured from 0 to 100) shows the speculators are currently Bullish with a score of 63.1 percent. The commercials are Bearish with a score of 40.7 percent and the small traders (not shown in chart) are Bearish-Extreme with a score of 11.7 percent.

Natural Gas Futures StatisticsSPECULATORSCOMMERCIALSSMALL TRADERS
– Percent of Open Interest Longs:20.343.94.5
– Percent of Open Interest Shorts:24.541.32.9
– Net Position:-51,58331,49920,084
– Gross Longs:247,254535,66855,021
– Gross Shorts:298,837504,16934,937
– Long to Short Ratio:0.8 to 11.1 to 11.6 to 1
NET POSITION TREND:
– COT Index Score (3 Year Range Pct):63.140.711.7
– COT Index Reading (3 Year Range):BullishBearishBearish-Extreme
NET POSITION MOVEMENT INDEX:
– 6-Week Change in Strength Index:-24.026.8-15.9


Gasoline Blendstock Futures: Futures:


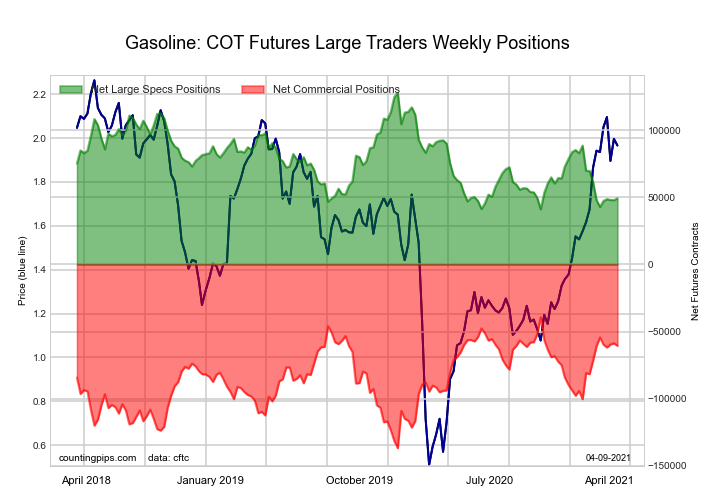
The Gasoline Blendstock Futures: large speculator standing this week was a net position of 49,320 contracts in the data reported through Tuesday. This was a weekly boost of 1,391 contracts from the previous week which had a total of 47,929 net contracts.

This week’s current strength score (the trader positioning range over the past three years, measured from 0 to 100) shows the speculators are currently Bearish-Extreme with a score of 9.4 percent. The commercials are Bullish with a score of 78.1 percent and the small traders (not shown in chart) are Bullish with a score of 78.8 percent.

Nasdaq Mini Futures StatisticsSPECULATORSCOMMERCIALSSMALL TRADERS
– Percent of Open Interest Longs:27.148.36.5
– Percent of Open Interest Shorts:13.764.73.5
– Net Position:49,320-60,57511,255
– Gross Longs:99,723177,45024,075
– Gross Shorts:50,403238,02512,820
– Long to Short Ratio:2.0 to 10.7 to 11.9 to 1
NET POSITION TREND:
– COT Index Score (3 Year Range Pct):9.478.178.8
– COT Index Reading (3 Year Range):Bearish-ExtremeBullishBullish
NET POSITION MOVEMENT INDEX:
– 6-Week Change in Strength Index:1.60.2-9.8


#2 Heating Oil NY-Harbor Futures: Futures:


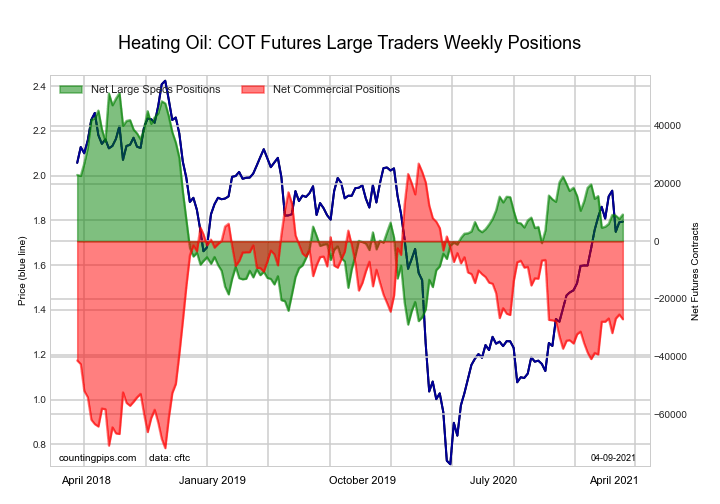
The #2 Heating Oil NY-Harbor Futures: large speculator standing this week was a net position of 9,292 contracts in the data reported through Tuesday. This was a weekly increase of 1,533 contracts from the previous week which had a total of 7,759 net contracts.

This week’s current strength score (the trader positioning range over the past three years, measured from 0 to 100) shows the speculators are currently Bearish with a score of 47.5 percent. The commercials are Bearish with a score of 45.3 percent and the small traders (not shown in chart) are Bullish with a score of 70.7 percent.

Heating Oil Futures StatisticsSPECULATORSCOMMERCIALSSMALL TRADERS
– Percent of Open Interest Longs:15.350.110.6
– Percent of Open Interest Shorts:13.056.76.2
– Net Position:9,292-27,00717,715
– Gross Longs:62,333204,07043,111
– Gross Shorts:53,041231,07725,396
– Long to Short Ratio:1.2 to 10.9 to 11.7 to 1
NET POSITION TREND:
– COT Index Score (3 Year Range Pct):47.545.370.7
– COT Index Reading (3 Year Range):BearishBearishBullish
NET POSITION MOVEMENT INDEX:
– 6-Week Change in Strength Index:5.70.9-22.2


Bloomberg Commodity Index Futures: Futures:


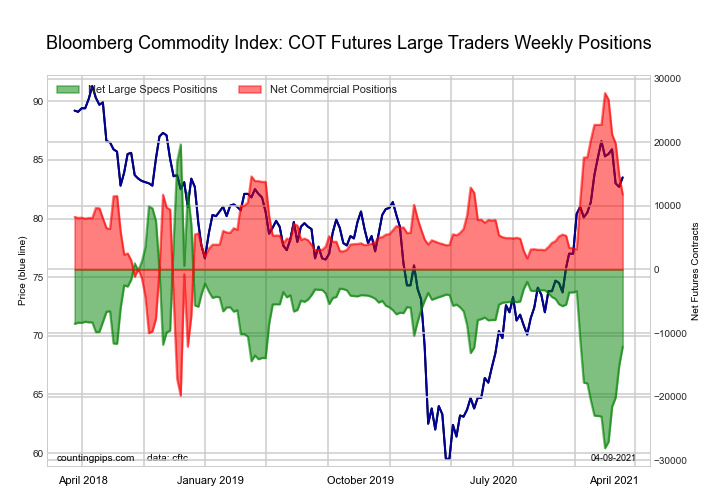
The Bloomberg Commodity Index Futures: large speculator standing this week was a net position of -12,147 contracts in the data reported through Tuesday. This was a weekly lift of 3,051 contracts from the previous week which had a total of -15,198 net contracts.

This week’s current strength score (the trader positioning range over the past three years, measured from 0 to 100) shows the speculators are currently Bearish with a score of 33.4 percent. The commercials are Bullish with a score of 66.4 percent and the small traders (not shown in chart) are Bullish with a score of 70.8 percent.

Bloomberg Index Futures StatisticsSPECULATORSCOMMERCIALSSMALL TRADERS
– Percent of Open Interest Longs:51.247.01.3
– Percent of Open Interest Shorts:86.812.50.2
– Net Position:-12,14711,758389
– Gross Longs:17,45716,018448
– Gross Shorts:29,6044,26059
– Long to Short Ratio:0.6 to 13.8 to 17.6 to 1
NET POSITION TREND:
– COT Index Score (3 Year Range Pct):33.466.470.8
– COT Index Reading (3 Year Range):BearishBullishBullish
NET POSITION MOVEMENT INDEX:
– 6-Week Change in Strength Index:23.0-23.12.6


Article By CountingPips.comReceive our weekly COT Reports by Email

*COT Report: The COT data, released weekly to the public each Friday, is updated through the most recent Tuesday (data is 3 days old) and shows a quick view of how large speculators or non-commercials (for-profit traders) were positioned in the futures markets.

The CFTC categorizes trader positions according to commercial hedgers (traders who use futures contracts for hedging as part of the business), non-commercials (large traders who speculate to realize trading profits) and nonreportable traders (usually small traders/speculators).

Find CFTC criteria here: (http://www.cftc.gov/MarketReports/CommitmentsofTraders/ExplanatoryNotes/index.htm).
COT Stock Market Futures Charts: Nasdaq-Mini, SP500, Russell-Mini, VIX, Dow-Mini

By CountingPips.comReceive our weekly COT Reports by Email

Here are the latest charts and statistics for the Commitment of Traders (COT) data published by the Commodities Futures Trading Commission (CFTC).

The latest COT data is updated through Tuesday April 06 2021 and shows a quick view of how large traders (for-profit speculators and commercial entities) were positioned in the futures markets.


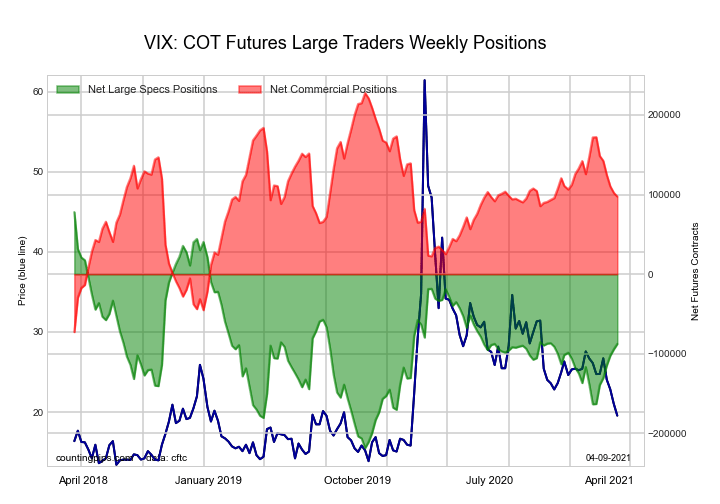
VIX Volatility Futures: Futures:

The VIX Volatility Futures: large speculator standing this week recorded a net position of -87,573 contracts in the data reported through Tuesday. This was a weekly lift of 6,817 contracts from the previous week which had a total of -94,390 net contracts.

This week’s current strength score (the trader positioning range over the past three years, measured from 0 to 100) shows the speculators are currently Bearish with a score of 44.1 percent. The commercials are Bullish with a score of 56.7 percent and the small traders (not shown in chart) are Bearish-Extreme with a score of 18.9 percent.

VIX Volatility Futures StatisticsSPECULATORSCOMMERCIALSSMALL TRADERS
– Percent of Open Interest Longs:19.056.55.5
– Percent of Open Interest Shorts:43.029.88.2
– Net Position:-87,57397,456-9,883
– Gross Longs:69,212205,87120,056
– Gross Shorts:156,785108,41529,939
– Long to Short Ratio:0.4 to 11.9 to 10.7 to 1
NET POSITION TREND:
– COT Index Score (3 Year Range Pct):44.156.718.9
– COT Index Reading (3 Year Range):BearishBullishBearish-Extreme
NET POSITION MOVEMENT INDEX:
– 6-Week Change in Strength Index:25.4-24.9-2.6


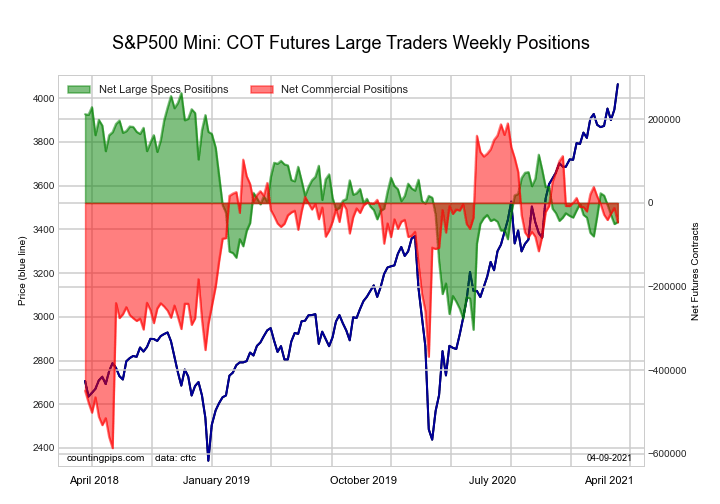
S&P500 Mini Futures: Futures:

The S&P500 Mini Futures: large speculator standing this week recorded a net position of -45,343 contracts in the data reported through Tuesday. This was a weekly rise of 4,988 contracts from the previous week which had a total of -50,331 net contracts.

This week’s current strength score (the trader positioning range over the past three years, measured from 0 to 100) shows the speculators are currently Bearish with a score of 45.6 percent. The commercials are Bullish with a score of 69.5 percent and the small traders (not shown in chart) are Bearish with a score of 40.0 percent.

S&P500 Mini Futures StatisticsSPECULATORSCOMMERCIALSSMALL TRADERS
– Percent of Open Interest Longs:13.173.112.1
– Percent of Open Interest Shorts:14.874.98.6
– Net Position:-45,343-46,32391,666
– Gross Longs:341,6221,908,972316,050
– Gross Shorts:386,9651,955,295224,384
– Long to Short Ratio:0.9 to 11.0 to 11.4 to 1
NET POSITION TREND:
– COT Index Score (3 Year Range Pct):45.669.540.0
– COT Index Reading (3 Year Range):BearishBullishBearish
NET POSITION MOVEMENT INDEX:
– 6-Week Change in Strength Index:-2.5-8.014.0


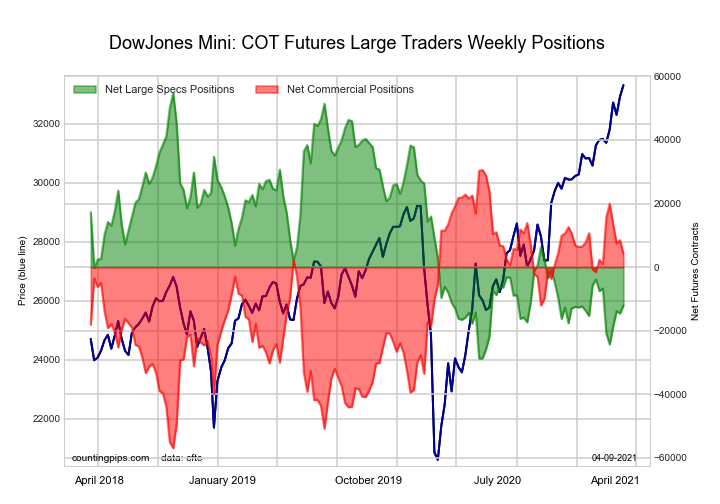
Dow Jones Mini Futures: Futures:

The Dow Jones Mini Futures: large speculator standing this week recorded a net position of -12,055 contracts in the data reported through Tuesday. This was a weekly increase of 2,495 contracts from the previous week which had a total of -14,550 net contracts.

This week’s current strength score (the trader positioning range over the past three years, measured from 0 to 100) shows the speculators are currently Bearish-Extreme with a score of 20.0 percent. The commercials are Bullish with a score of 69.8 percent and the small traders (not shown in chart) are Bullish-Extreme with a score of 93.4 percent.

Dow Jones Mini Futures StatisticsSPECULATORSCOMMERCIALSSMALL TRADERS
– Percent of Open Interest Longs:28.347.021.5
– Percent of Open Interest Shorts:41.142.613.1
– Net Position:-12,0554,1347,921
– Gross Longs:26,64144,32320,301
– Gross Shorts:38,69640,18912,380
– Long to Short Ratio:0.7 to 11.1 to 11.6 to 1
NET POSITION TREND:
– COT Index Score (3 Year Range Pct):20.069.893.4
– COT Index Reading (3 Year Range):Bearish-ExtremeBullishBullish-Extreme
NET POSITION MOVEMENT INDEX:
– 6-Week Change in Strength Index:-6.43.613.7


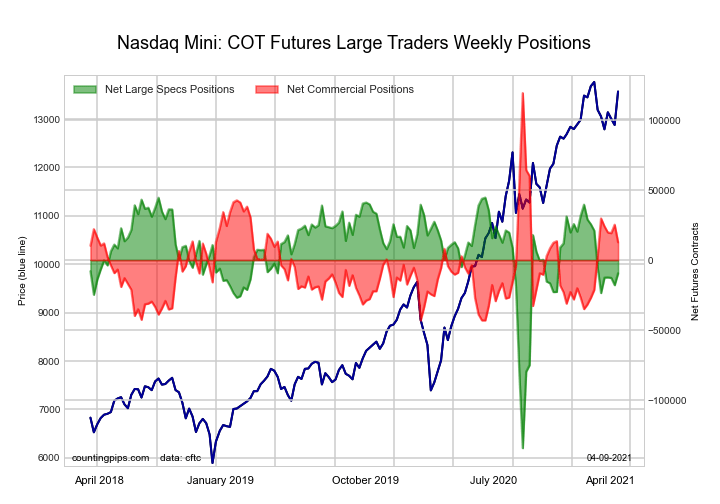
Nasdaq Mini Futures: Futures:

The Nasdaq Mini Futures: large speculator standing this week recorded a net position of -9,396 contracts in the data reported through Tuesday. This was a weekly boost of 8,469 contracts from the previous week which had a total of -17,865 net contracts.

This week’s current strength score (the trader positioning range over the past three years, measured from 0 to 100) shows the speculators are currently Bullish with a score of 69.8 percent. The commercials are Bearish with a score of 34.3 percent and the small traders (not shown in chart) are Bearish with a score of 36.5 percent.

Nasdaq Mini Futures StatisticsSPECULATORSCOMMERCIALSSMALL TRADERS
– Percent of Open Interest Longs:26.855.516.3
– Percent of Open Interest Shorts:31.149.517.9
– Net Position:-9,39612,730-3,334
– Gross Longs:57,439119,01835,071
– Gross Shorts:66,835106,28838,405
– Long to Short Ratio:0.9 to 11.1 to 10.9 to 1
NET POSITION TREND:
– COT Index Score (3 Year Range Pct):69.834.336.5
– COT Index Reading (3 Year Range):BullishBearishBearish
NET POSITION MOVEMENT INDEX:
– 6-Week Change in Strength Index:-2.26.1-13.1


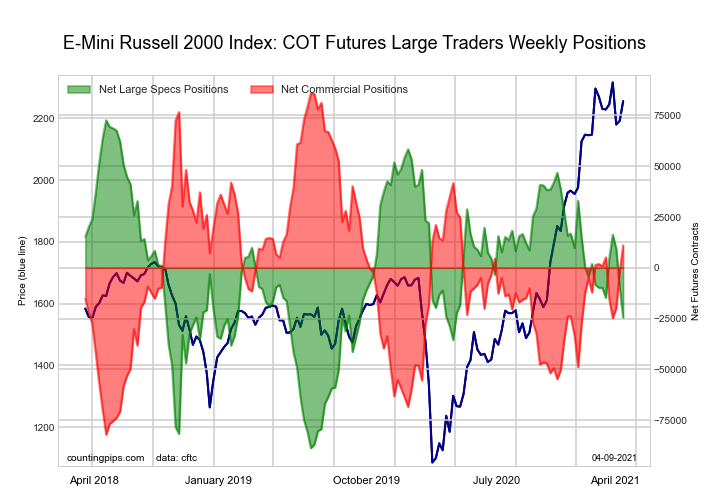
Russell 2000 Mini Futures: Futures:

The Russell 2000 Mini Futures: large speculator standing this week recorded a net position of -24,398 contracts in the data reported through Tuesday. This was a weekly decrease of -14,398 contracts from the previous week which had a total of -10,000 net contracts.

This week’s current strength score (the trader positioning range over the past three years, measured from 0 to 100) shows the speculators are currently Bearish with a score of 39.9 percent. The commercials are Bullish with a score of 55.4 percent and the small traders (not shown in chart) are Bullish with a score of 70.8 percent.

Russell 2000 Mini Futures StatisticsSPECULATORSCOMMERCIALSSMALL TRADERS
– Percent of Open Interest Longs:12.380.86.5
– Percent of Open Interest Shorts:17.478.53.7
– Net Position:-24,39811,02513,373
– Gross Longs:57,946382,08030,669
– Gross Shorts:82,344371,05517,296
– Long to Short Ratio:0.7 to 11.0 to 11.8 to 1
NET POSITION TREND:
– COT Index Score (3 Year Range Pct):39.955.470.8
– COT Index Reading (3 Year Range):BearishBullishBullish
NET POSITION MOVEMENT INDEX:
– 6-Week Change in Strength Index:-9.06.112.3


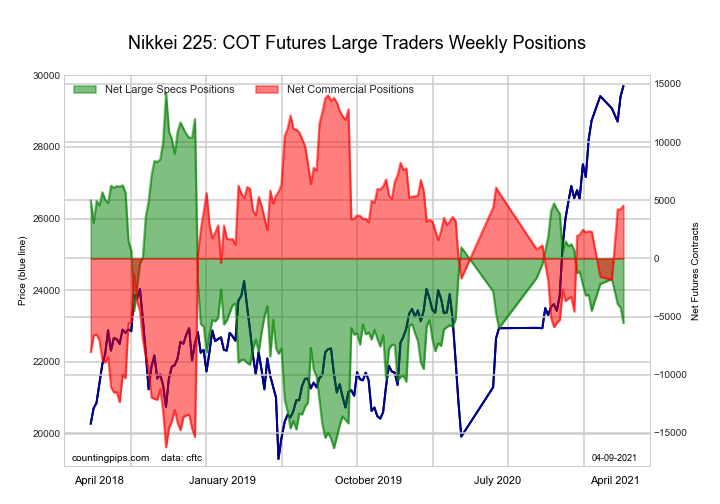
Nikkei Stock Average Futures (USD): Futures:

The Nikkei Stock Average Futures (USD): large speculator standing this week recorded a net position of -5,553 contracts in the data reported through Tuesday. This was a weekly lowering of -1,349 contracts from the previous week which had a total of -4,204 net contracts.

This week’s current strength score (the trader positioning range over the past three years, measured from 0 to 100) shows the speculators are currently Bearish with a score of 35.2 percent. The commercials are Bullish with a score of 68.7 percent and the small traders (not shown in chart) are Bearish with a score of 30.4 percent.

Nikkei Stock Average Futures StatisticsSPECULATORSCOMMERCIALSSMALL TRADERS
– Percent of Open Interest Longs:10.455.434.1
– Percent of Open Interest Shorts:47.724.827.4
– Net Position:-5,5534,5481,005
– Gross Longs:1,5428,2395,071
– Gross Shorts:7,0953,6914,066
– Long to Short Ratio:0.2 to 12.2 to 11.2 to 1
NET POSITION TREND:
– COT Index Score (3 Year Range Pct):35.268.730.4
– COT Index Reading (3 Year Range):BearishBullishBearish
NET POSITION MOVEMENT INDEX:
– 6-Week Change in Strength Index:-8.07.32.6


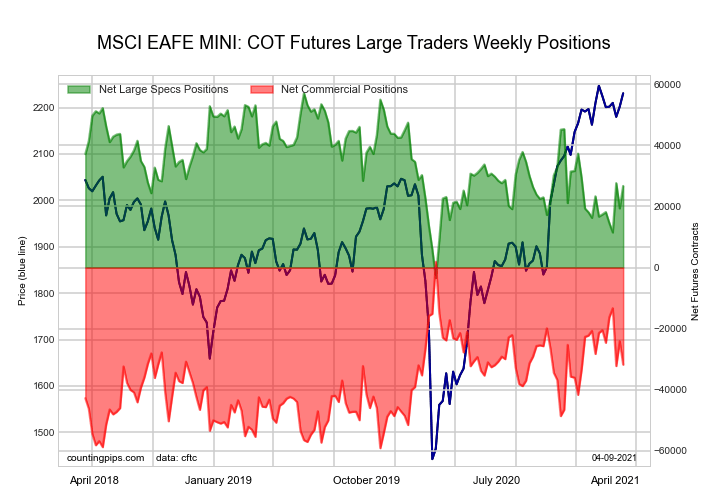
MSCI EAFE Mini Futures: Futures:

The MSCI EAFE Mini Futures: large speculator standing this week recorded a net position of 26,731 contracts in the data reported through Tuesday. This was a weekly increase of 7,338 contracts from the previous week which had a total of 19,393 net contracts.

This week’s current strength score (the trader positioning range over the past three years, measured from 0 to 100) shows the speculators are currently Bearish with a score of 49.7 percent. The commercials are Bearish with a score of 44.8 percent and the small traders (not shown in chart) are Bullish with a score of 62.1 percent.

MSCI EAFE Mini Futures StatisticsSPECULATORSCOMMERCIALSSMALL TRADERS
– Percent of Open Interest Longs:8.888.42.5
– Percent of Open Interest Shorts:2.396.21.2
– Net Position:26,731-31,8215,090
– Gross Longs:35,992362,67010,147
– Gross Shorts:9,261394,4915,057
– Long to Short Ratio:3.9 to 10.9 to 12.0 to 1
NET POSITION TREND:
– COT Index Score (3 Year Range Pct):49.744.862.1
– COT Index Reading (3 Year Range):BearishBearishBullish
NET POSITION MOVEMENT INDEX:
– 6-Week Change in Strength Index:15.4-18.517.9


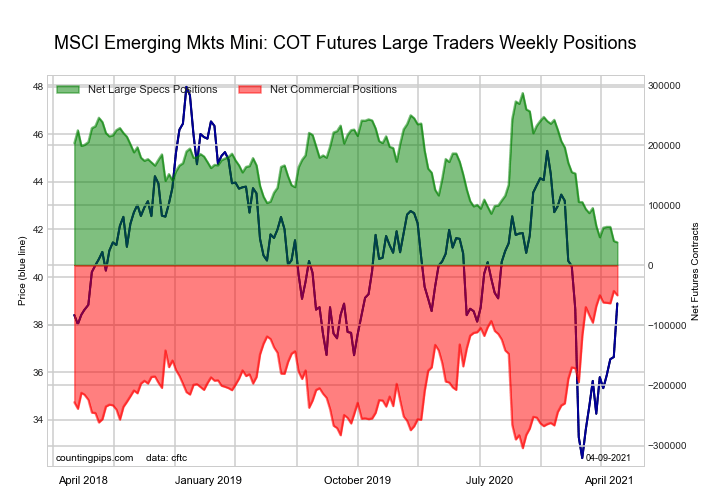
MSCI Emerging Mkts Mini Futures: Futures:

The MSCI Emerging Mkts Mini Futures: large speculator standing this week recorded a net position of 38,211 contracts in the data reported through Tuesday. This was a weekly decline of -2,219 contracts from the previous week which had a total of 40,430 net contracts.

This week’s current strength score (the trader positioning range over the past three years, measured from 0 to 100) shows the speculators are currently Bearish-Extreme with a score of 0.0 percent. The commercials are Bullish-Extreme with a score of 97.2 percent and the small traders (not shown in chart) are Bearish with a score of 40.4 percent.

MSCI Emerging Mkts Mini Futures StatisticsSPECULATORSCOMMERCIALSSMALL TRADERS
– Percent of Open Interest Longs:14.382.22.4
– Percent of Open Interest Shorts:11.086.51.3
– Net Position:38,211-49,88611,675
– Gross Longs:165,150950,68527,250
– Gross Shorts:126,9391,000,57115,575
– Long to Short Ratio:1.3 to 11.0 to 11.7 to 1
NET POSITION TREND:
– COT Index Score (3 Year Range Pct):0.097.240.4
– COT Index Reading (3 Year Range):Bearish-ExtremeBullish-ExtremeBearish
NET POSITION MOVEMENT INDEX:
– 6-Week Change in Strength Index:-11.06.87.3


Article By CountingPips.comReceive our weekly COT Reports by Email

*COT Report: The COT data, released weekly to the public each Friday, is updated through the most recent Tuesday (data is 3 days old) and shows a quick view of how large speculators or non-commercials (for-profit traders) were positioned in the futures markets.

The CFTC categorizes trader positions according to commercial hedgers (traders who use futures contracts for hedging as part of the business), non-commercials (large traders who speculate to realize trading profits) and nonreportable traders (usually small traders/speculators).

Find CFTC criteria here: (http://www.cftc.gov/MarketReports/CommitmentsofTraders/ExplanatoryNotes/index.htm).