Sustainability rankings don’t always identify sustainable companies

By Rumina Dhalla, University of Guelph and Felix Arndt, University of Guelph 

– British American Tobacco (famous for cigarettes), Coca-Cola (world-renowned for its sugary soft drinks) and Glencore (a British/Swiss mining company) were recently ranked in the top five most environmentally and socially responsible companies on the FTSE 100, the share index of the 100 biggest companies listed on the London Stock Exchange.

As consumers and investors, we often look at environmental, social and governance (ESG) rankings to guide our purchase, investment and employment decisions. But what should we make of this list, compiled by British investment services firm Hargreaves Lansdown?

As kids, we learned that smoking kills, yet British American Tobacco has a place at the top of the list, suggesting it’s a highly responsible company.

Obesity, cardiovascular disease and diabetes are life-threatening diseases, yet Coca Cola, a leading sugar purveyor, also has a top ranking.

Glencore is being investigated for alleged fraud offences, yet it’s No. 4 on the same list.

Meaningless?

A number of lists rank companies as being “most responsible” or the “best corporate citizens” or the “most green.”

The Corporate Knights Global 100, for example, is an annual list that evaluates companies based on their sustainability performance. Companies are given a score based on their environmental, social, governance and economic performance and then ranked from one to 100.

Newsweek magazine’s America’s Most Responsible Company list also ranks U.S. companies on their sustainability performance.

Its 2021 list ranked Citigroup as the country’s ninth most responsible firm. The bank was recently fined US$400 million by federal regulators for “unsafe and unsound banking practices.”

Microsoft is ranked third on the same list, yet earlier this year, 250 million client records were exposed online without password protection.

Procter & Gamble, 23rd on the Newsweek list, is currently being scrutinized for its reliance on trees from Canada’s northern boreal forest.

A forest with ferns and tall pine trees.
A portion of Canada’s boreal forest in Québec.
Ali Kazal/Unsplash

In Canada, Corporate Knights ranks Canada’s Best 50 corporate citizens. Leading the pack is Mountain Equipment Co-op, which recently apologized for the lack of diversity in a marketing campaign that excluded people of colour.

Hydro One, in the No. 11 position, has been taken to task for its executive compensation packages.

Consumers, investors look at rankings

Increasing numbers of investors depend on ESG information from third parties for their investment decisions. Similarly, consumers are seeking sustainable products and looking to responsible firms to inform their purchasing decisions.

There are also an increasing number of companies entering the ESG rankings field. Currently there is no regulatory oversight or consistency across ranking agencies on what factors are being assessed in the rankings and who is assessing them.

As well, there are no global or nationally accepted standards or consistent requirements on what should be reported or measured for ESG performance. Companies are evaluated based on a wide range of criteria, making it challenging for consumers and investors to make fully informed decisions.

Should investors look at ESG ratings to assess their investment choices and the associated risks?

We looked at the top five Canadian firms from Corporate Knights 2020 Global 100 list and searched the Sustainalytics ESG Risk Database to see their ESG risk. Sustainalytics, a company initially launched in Canada as Jantzi Research, measures a company’s exposure to industry-specific ESG risks and how well a company is managing those risks, as well as the extent of any unmanaged ESG risk.

Three Canadian companies — the Bank of Montreal, Cascades and Canadian National Railway — were ranked as low risk, while two, Algonquin and Bombardier, which placed even higher on the Corporate Knights Global 100 list than the three aforementioned companies, are considered high risk by the Sustainalytics ESG Risk rating.

ESG rankings and lists aren’t often entirely reliable for consumers or investors wanting to make decisions on companies they buy from or invest in.
Appolinary Kalashnikova/Unsplash

No consistency

Why would one well-known ESG ranking agency rate a company a leader while another flag it as high risk? If all the ratings and rankings are measuring ESG, we would anticipate consistency across rankings.

While rankings should help us in our quest to make better, more sustainable decisions and choose ethical companies as consumers and investors, they can be misleading and provide only a partial view of a company’s ESG commitments.

When determining which rankings to trust, we suggest looking for ranking agencies that use public information to assess companies on ESG performance. Quality ranking organizations are transparent about how they analyze companies and come up with their rankings. Those reading the lists should be able to assess the information provided in the ranking quickly and with confidence about what it really says.

Look for rankings that don’t accept payment from companies to participate; this reduces their power to influence their placement. Look at information from multiple rankings and ratings.

When companies in contested industries (those that do harm) score high in sustainability rankings, it should raise serious questions about the validity of the ranking.

Rather than blindly trusting rankings, understand the information provided by each list. While rankings are designed to offer compressed information, unfortunately, we still need to do our own research to evaluate companies.The Conversation

About the Author:

Rumina Dhalla, Associate Professor, Organizational Studies and Sustainable Commerce and Director, Institute for Sustainable Commerce, University of Guelph and Felix Arndt, John F. Wood Chair in Entrepreneurship, University of Guelph

This article is republished from The Conversation under a Creative Commons license. Read the original article.

Technical Outlook: GBPUSD poised for breakdown?

By Lukman Otunuga Research Analyst, ForexTime

Pound bulls were on a roll yesterday after England moved into the second stage of the government’s roadmap out of lockdown.

While many countries across the globe were tightening lockdown restrictions amid surging Covid-19 cases, the UK was doing the complete opposite. Non-essential retail, restaurants, and pubs with outdoor spaces were reopened. Given how the easing of restrictions is expected to spark a surge in consumer spending, this development is likely to boost confidence in the UK’s economic recovery.

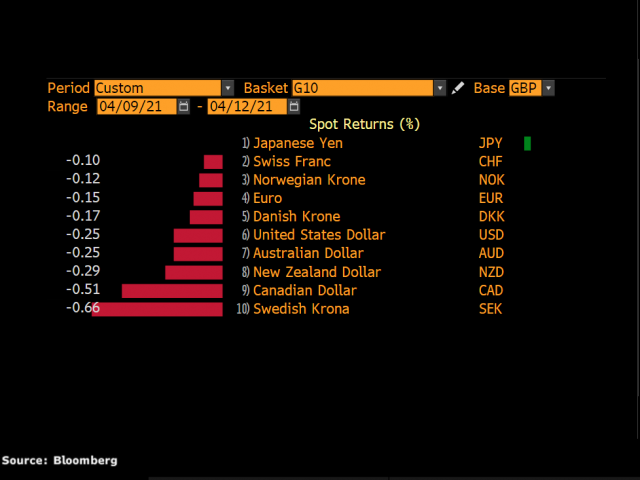
The key question is whether this will be enough to support the British Pound in the short to medium term. Since the start of April, Sterling has weakened against every single G10 currency, shedding over 1.70% against the Euro.

Easing lockdown restrictions is a welcome development for Sterling. However, political risk in the form of the upcoming Scottish parliamentary elections and concerns relating to AstraZeneca Plc’s shot could throw a proverbial wrench in the works for bulls. On top of this, an appreciating Dollar may ensure the GBPUSD remains trapped in the current bearish channel on the daily charts.

A quick look at the fundamentals

The UK GDP report this morning revealed that the economy expanded less-than-expected in February. Growth expanded 0.4% month-on-month as lockdown restrictions remained. Although this was below the 0.5% expectations, it was a solid improvement from the -2.9% in January. Industrial production and manufacturing production figures both exceeded market expectations by rising 1.0% and 1.3%, respectively month-on-month. Unsurpsingly, the Pound offered a muted reaction with prices trading around 1.3745 as of writing.

Technicals swing in favour of bears….

From a technical perspective, the GBPUSD remains under pressure on the daily charts. Prices are trading below the 20 Simple Moving Average while the MACD trades below 0. There seems to be support around the 1.3670 level which is coincidentally above the 100 Simple Moving Average. A solid breakdown and daily close below this level could open the doors towards 1.3570 and 1.3500.

Should 1.3670 prove to be reliable support, a rebound back towards 1.3900 could be a possibility.

For my intraday traders, a potential breakout opportunity is forming on the hourly timeframe. Support can be found at 1.3725 while resistance at 1.3770. If Pound bulls are still in the game, prices may venture towards the 1.3770 level before testing 1.3800. Alternatively, an hourly close under 1.3725 could open the doors towards 1.3670.

Disclaimer: The content in this article comprises personal opinions and should not be construed as containing personal and/or other investment advice and/or an offer of and/or solicitation for any transactions in financial instruments and/or a guarantee and/or prediction of future performance. ForexTime (FXTM), its affiliates, agents, directors, officers or employees do not guarantee the accuracy, validity, timeliness or completeness, of any information or data made available and assume no liability as to any loss arising from any investment based on the same.


Forex-Time-LogoArticle by ForexTime
ForexTime Ltd (FXTM) is an award winning international online forex broker regulated by CySEC 185/12 www.forextime.com

US stocks fall from record highs

by JustForex

US equities tumbled from all-time highs as investors weighed the start of the corporate earnings season and an increase in the total amount of bond offerings that triggered the rally.

Intel plunged together with Nvidia Corp., making the Nasdaq 100 fall as well. Yields rallied as the US Treasury auctioned 3- and 10-year bonds amid weaker demand than in the previous bond sales. The government will place 30-year bonds tomorrow.

While the US recovery is accelerating, several countries in Europe and South America are suffering from rising Covid-19 cases and vaccination problems. The rotation to cyclical and small-cap stocks also appears to have stopped, prompting concerns over the strength of the US economic recovery early in the earnings season.

At the same time, colossal government spendings and stimulus from the central bank can trigger excessive inflation. On Sunday, in an interview with CBS’s 60 Minutes, Federal Reserve Chairman Jerome Powell tried to reassure that any spike in price pressures would be short-lived.

In the world market, oil rose slightly above $60 per barrel. The yield on US government bonds rose just above 1.67%.

Main market quotes:

S&P 500 (F) 4,119.62 -0.63 (-0.02%)

Dow Jones 33,745.40 -55.20 (-0.16%)

DAX 15,255.30 +40.30 (+0.26%)

FTSE 100 6,884.67 -4,45 (-0.06%)

USD Index 92.218 +0.074 (+0.08%)

Important events:
  • – UK Monthly GDP (3m/3m) at 09:00 (GMT+3);
  • – UK Manufacturing Output (m/m) (Feb) at 11:30 (GMT+3);
  • – The ZEW Indicator of Economic Sentiment in Germany (Apr) at 12:00 (GMT+3);
  • – US Core Consumer Price Index (CPI) (m/m) (Mar) at 15:30 (GMT+3).

by JustForex


This article reflects a personal opinion and should not be interpreted as an investment advice, and/or offer, and/or a persistent request for carrying out financial transactions, and/or a guarantee, and/or a forecast of future events.

Technical Outlook: Yen Crosses In Focus

By Lukman Otunuga Research Analyst, ForexTime

The Japanese Yen snatched our attention today after appreciating against almost every single G10 currency.

As investors adopted a cautious stance ahead of the earnings season, global stock markets retreated from record highs with the general risk-off mode boosting appetite for safe-haven currencies

The Swiss franc also performed well on Monday, gaining ground against its major counterparts excluding the British Pound and Japanese Yen. Interestingly, the Dollar slipped towards a three-week low while Sterling rallied across the board as the UK officially eased some of its lockdown restrictions.

This could be a wild week for yen crosses as the risk pendulum swings back and forth. Not only do we have earnings season but speeches from financial heavyweights, important economic reports and the third wave of Covid-19 sweeping through Europe.

USDJPY breakout on the horizon?

The USDJPY remains bullish on the daily charts as there have been consistently higher highs and higher lows. However, prices are trading within a range with resistance around 109.84 and support at 109.00. A solid break below the 109.00 support could signal the end of the bullish trend with the next key point of interest at 108.30. Alternatively, a strong move above 109.84 is likely to open the doors towards the 2021 high of 110.956.

GBPJPY make or break?

Ok, the title sounds slightly dramatic but this could be a turning point for the GBPJPY. After dropping over 300 pips last week, it looks like bears are turning serious. Should the 150.00 region act as reliable support, this could become the new higher low that pushes prices back towards 152.00. Alternatively, a solid breakdown and daily close under 150.00 could result in a selloff towards 148.50 and lower.

EURJPY presses against 130.50

The title says it all. The EURJPY remains bullish on the daily charts. Prices are trading above the 20 Simple Moving Average while the MACD is above 0. A solid breakout above 130.50 could open a path towards 131.70. Should 130.50 prove to be a stubborn resistance (yet again) a decline back towards 129.50 and 128.30 will be on the cards.

Disclaimer: The content in this article comprises personal opinions and should not be construed as containing personal and/or other investment advice and/or an offer of and/or solicitation for any transactions in financial instruments and/or a guarantee and/or prediction of future performance. ForexTime (FXTM), its affiliates, agents, directors, officers or employees do not guarantee the accuracy, validity, timeliness or completeness, of any information or data made available and assume no liability as to any loss arising from any investment based on the same.


Forex-Time-LogoArticle by ForexTime
ForexTime Ltd (FXTM) is an award winning international online forex broker regulated by CySEC 185/12 www.forextime.com

The strength of the DAX30 demonstrates again a two-speed Europe.

By Admiral Markets

After the euro crisis, triggered by the financial and sovereign debt crisis a decade ago, there was much talk of a “two-speed” Europe. This referred not only to the levels of wealth of member countries, but also to the superior growth rate of the Nordic countries compared to the countries of southern Europe.

With the current crisis caused by the Covid-19 pandemic, these differences are emerging once again in the financial markets. If we focus on the main European stock indices, we can note that indices such as the German DAX30, STOXX50 and the French CAC40, have not only recovered to pre-pandemic levels, but have gone on to record all-time highs. On the other hand, the indices of the southern countries such as the Spanish IBEX35, the Portuguese PSI20 and the Italian FTSE MIB, have yet to reach their pre-pandemic levels.

All these indices have experienced strong rallies from last year’s lows thanks to the improved economic outlook brought by the vaccines and the good macroeconomic data of the last few months, even though the current coronavirus data in Europe is bad. However, these two speeds once again demonstrate the strengths of the different economies, even when currently the coronavirus figures are worse in northern Europe than in the southern countries.

DAX30 Analysis

Without a doubt, the DAX30 is the strongest index in Europe and the German economy is the great engine of the Eurozone.

During the last few months, the German index has maintained a strong upward trend that increased after breaking the upper band of the green lateral channel, which acted as its main resistance between July and mid-December. Breaking through this resistance level has led the DAX30 to surpass 15,000 points, marking historical highs at 15327.70 points on 6 April after successive supports at its 18-session average.

Currently, its 18-session average and its previous resistance level at the previous all-time highs act as its main support. As long as we do not lose this important level, the long term trend remains bullish.

At the moment, we can see that the DAX30 is trading with a significant overbought level and that the price is far from its main support levels. Therefore, we cannot rule out that, despite the strength of the trend, the price could make a correction or a sideways movement to get out of this accumulated overbought level.

Depicted: Admirals (Formerly Admiral Markets) MetaTrader 5 – DAX30 Daily Chart. Date Range: 28 November 2019 – 12 April 2021. Date Captured: 12 April 2021. Past performance is not necessarily an indication of future performance.

Price evolution of the last five years:

  • 2020: 3.6%
  • 2019: 25.48%
  • 2018: -18.26%
  • 2017: 12.51%
  • 2016: 6.87%

IBEX35 Analysis

As we mentioned earlier, the Spanish index is not only trading far from its historical highs, but has not even recovered its trading levels prior to the outbreak of the pandemic. At the time of writing, it has only recovered 61.8% of the falls and not without difficulties along the way, as after a strong recovery during the summer of 2020, the index fell sharply almost back to the annual lows, this being the starting point for the current upward trend.

It is true that the Spanish economy has been particularly affected by this crisis due to its dependence on tourism and the political instability generated by the current coalition government, which is why Spanish GDP in 2020 was one of the worst hit internationally.

If we look at the chart, the uptrend seems clear and the Spanish index may still have upside potential if it manages to consolidate these levels, as the first important resistance can be found at 9,000 points.

Depicted: Admirals MetaTrader 5 – IBEX35 Daily Chart. Date Range: 30 August 2018 – 12 April 2021. Date Captured: 12 April 2021. Past performance is not necessarily an indication of future performance.

Price evolution of the last five years:

  • 2020: -15.45%
  • 2019: 11.82%
  • 2018: -14.97%
  • 2017: 7.40%
  • 2016: -2.01%

Trade With Admirals

With a Trade.MT5 account from Admirals, you can trade Contracts For Difference (CFDs) on the DAX30, IBEX35 and many other financial instruments! CFDs allow traders to attempt to profit from both rising and falling prices, whilst also benefiting from the use of leverage. In order to open an account and start trading, click the banner below!

Trade With MetaTrader 5

INFORMATION ABOUT ANALYTICAL MATERIALS:

The given data provides additional information regarding all analysis, estimates, prognosis, forecasts, market reviews, weekly outlooks or other similar assessments or information (hereinafter “Analysis”) published on the websites of Admiral Markets investment firms operating under the Admiral Markets trademark (hereinafter “Admiral Markets”) Before making any investment decisions please pay close attention to the following:

  1. This is a marketing communication. The content is published for informative purposes only and is in no way to be construed as investment advice or recommendation. It has not been prepared in accordance with legal requirements designed to promote the independence of investment research, and that it is not subject to any prohibition on dealing ahead of the dissemination of investment research.
  2. Any investment decision is made by each client alone whereas Admiral Markets shall not be responsible for any loss or damage arising from any such decision, whether or not based on the content.
  3. With view to protecting the interests of our clients and the objectivity of the Analysis, Admiral Markets has established relevant internal procedures for prevention and management of conflicts of interest.
  4. The Analysis is prepared by an independent analyst, Roberto Rojas (analyst), (hereinafter “Author”) based on their personal estimations.
  5. Whilst every reasonable effort is taken to ensure that all sources of the content are reliable and that all information is presented, as much as possible, in an understandable, timely, precise and complete manner, Admiral Markets does not guarantee the accuracy or completeness of any information contained within the Analysis.
  6. Any kind of past or modeled performance of financial instruments indicated within the content should not be construed as an express or implied promise, guarantee or implication by Admiral Markets for any future performance. The value of the financial instrument may both increase and decrease and the preservation of the asset value is not guaranteed.
  7. Leveraged products (including contracts for difference) are speculative in nature and may result in losses or profit. Before you start trading, please ensure that you fully understand the risks involved.

By Admiral Markets

The Easiest Money in History

If raising money doesn’t get any easier than this, what’s next?

By Murray Gunn

The latest data from Refinitiv shows that companies have raised a record $140 billion in the U.S. dollar junk bond market during the first quarter of this year. That beats the previous record set during the second quarter last year when companies scrambled to issue debt in a bid to raise cash during the pandemic. The three biggest issuance quarters in history have been set in the past year. With investors falling over themselves to lend money to any venture offering a U.S. dollar yield above 4%, companies are now not only finding that they can raise money easily in order to roll over existing debt, but some are using the proceeds to pay dividends to owners. It’s beyond absurd.

When a mania is in full force, though, the vast majority of participants are blind to the absurdity. Investors, for instance, think that they must lend because 4% or higher is such a juicy yield when compared with anything else. And the central banks will not let companies fail, so it’s a free lunch.

Right.

This era of central bank-induced gushing liquidity, combined with a manic social mood, has created statistics that, when looked back on in the cold light of day, will be viewed as clearly insane. At this juncture, it is seen as entirely normal, indeed clever, to give your money to someone who will not tell you what they are going to do with it. The SPAC (Special Purpose Acquisition Company) mania is a prime candidate for the financial bubble history books.

And then, when we think we’ve seen it all, along come NFTs. Non-fungible tokens are the new hot, must-have accessory in town. According to Wikipedia, “a non-fungible token is a unit of data on a digital ledger called a blockchain, where each NFT can represent a unique digital item, and thus they are not interchangeable. NFTs can represent digital files such as art, audio, videos, items in video games and other forms of creative work.” Ah, life in the cloud.

But it doesn’t matter if anyone understands them. The crowd is besotted by them and that’s all there is to it. This week, a New York Times columnist sold his column as a non-fungible token for $560,000, writing “Why can’t a journalist join the NFT party, too?”

210401 - Mg

The free lunch party is in full swing. We say enjoy it while it lasts because the hangover is going to be biblical. If you need some religion, check out the free report, Money Making Rules for Investors. Get instant access with a free Club EWI membership.

This article was syndicated by Elliott Wave International and was originally published under the headline The Easiest Money in History. EWI is the world’s largest market forecasting firm. Its staff of full-time analysts led by Chartered Market Technician Robert Prechter provides 24-hour-a-day market analysis to institutional and private investors around the world.

A Widening Gap? UK GDP & German ZEW Survey

By Orbex

The difference in vaccine rollout within Europe is most likely to have a major impact on the respective economies.

Just as the UK moved to reopen certain non-essential businesses, Germany was headed in the opposite direction. The disconnect, aside from the political wrangling over vaccines, has had important effects on forex and their respective stock markets.

Despite the political controversy inside Germany over measures to deal with the virus, German businesses remain quite optimistic about the future.

For traders looking at the longer term, that might have further implications. The gap opening now in favor of the UK could potentially close once vaccine coverage through the continent is finally achieved.

That reversal of trade flows could be another opportunity, just as the current cycle has pushed the GBPEUR cross higher.

What the data says

Tomorrow sees the release of monthly UK GDP data from February.

Understandably, the UK was struggling in the middle of winter under the strictest lockdown yet. However, analysts broadly agree that January marked the low watermark for the UK this year. Projections for the February monthly GDP are of a 0.6% increase, compared to -2.9% in the prior month.

Under those circumstances, the March GDP would have to grow in excess of 2.4% for the UK to avoid a contraction in Q1. Still, having secured growth in the final quarter of the year, the UK is in a comfortable position to avoid a technical recession.

Unlike the continent.

Germany the best of the pack?

Later in the day, we get the ZEW survey of major German and EU businesses. This survey compares their current situation to where they think things will be in six months.

Most EU authorities agree that by the end of autumn, there would be enough vaccination to be hopeful of economic normalization. That’s within the timeframe of the ZEW survey. Therefore, this suggests that the survey reflects where businesses expect the economy to be when covid is finally behind us.

Expectations are for the German ZEW current situation to show a modest improvement, but remain extremely depressed. The consensus is for -52 compared to -61 prior.

This is likely to not really change anyone’s understanding of the economic situation in the Eurozone’s largest economy. So we wouldn’t expect much of a market reaction.

Where the difference lies

Expectations for ZEW Economic Sentiment, on the other hand, are for a move up to 79.5. This would be the highest on record once again, above last month’s 76.6 reading.

It appears that German businesses think that the worse things are now, the stronger the rebound will be.

This sentiment isn’t shared across Europe, though. Expectations are for the ZEW Economic Sentiment for the Eurozone to drop modestly to 73.2 compared to 74.0 in the prior reading. Although slightly lower, it’s still only a few decimals off the record high as well.

The consensus remains that Europe still has potential for a strong rebound, just that it has been delayed by half a year compared to other countries with more advanced vaccination programs such as the US and UK.

By Orbex

Arox Capital Review

What is Arox Capital?

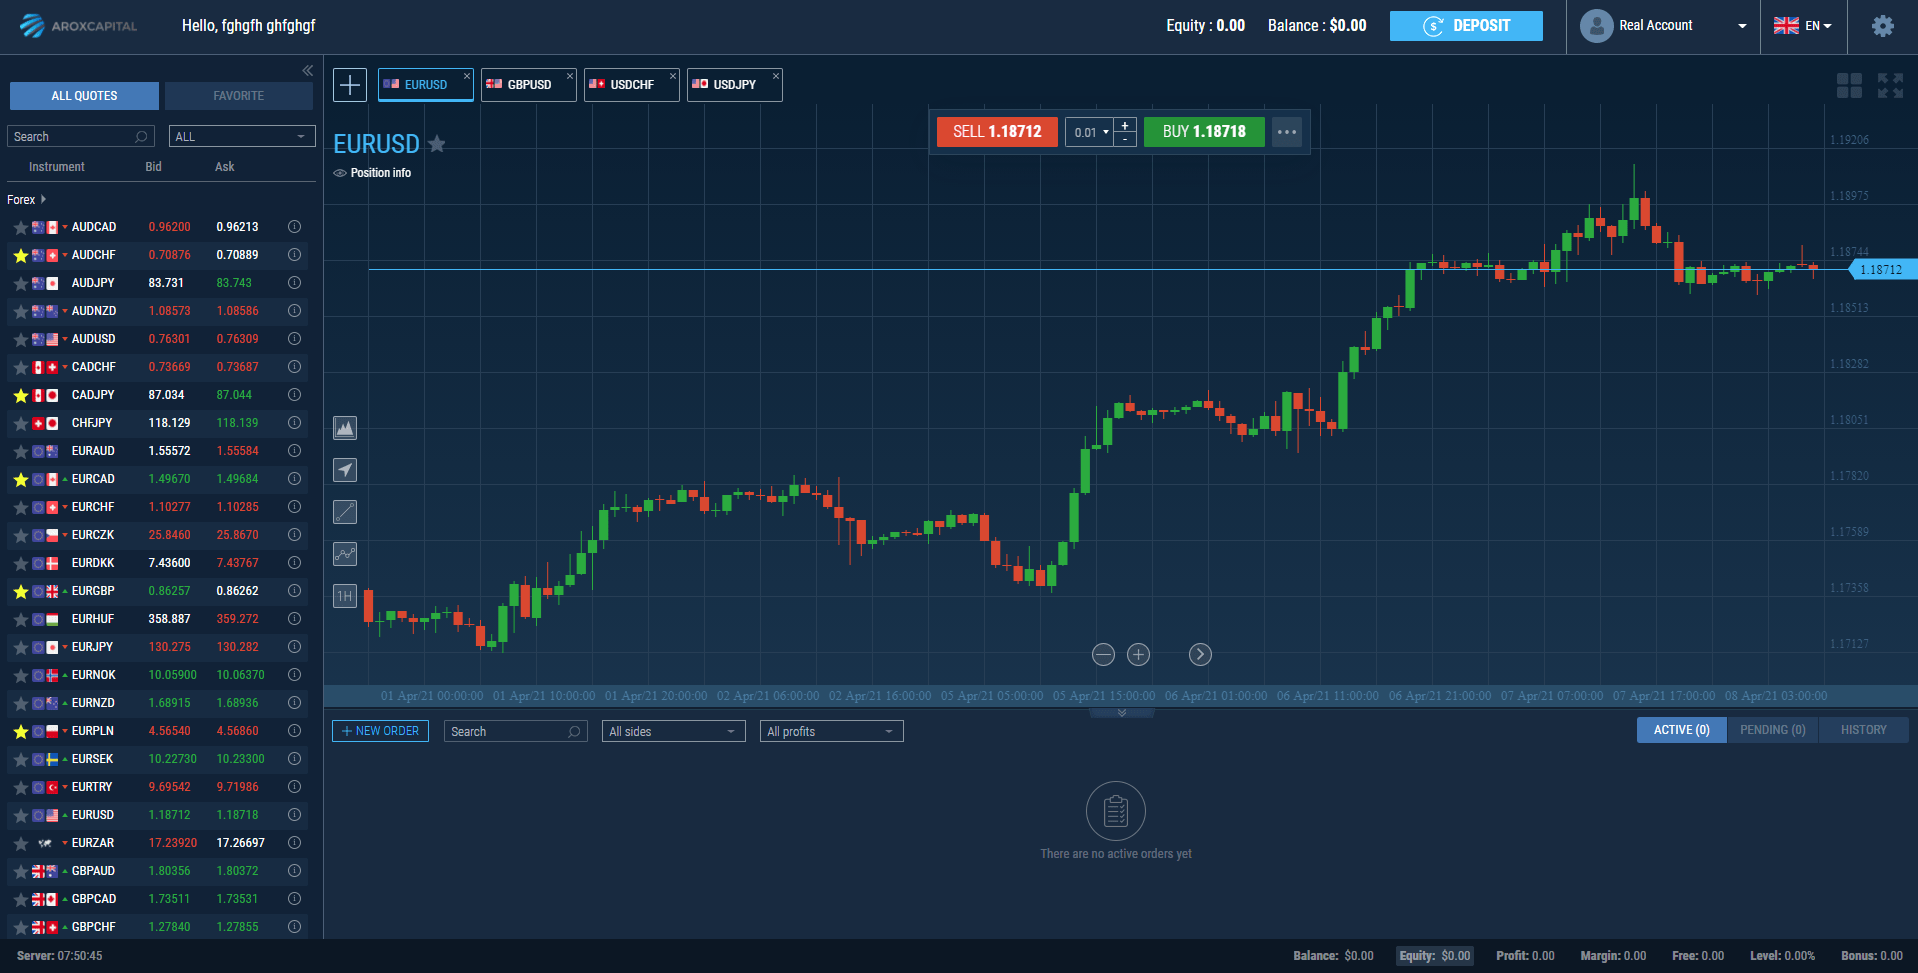
Arox Capital is a multi-asset trading platform offering access to a broad range of benefits for traders wanting to leverage the opportunities emerging across the financial markets. It was founded in 2018 and since the first day the brand witnessed impressive growth due to competitive conditions.

Traders working with this brand can enjoy ultra-fast order execution, an industry-leading trade engine, and strong security. Arox Capital wants to create a dynamic yet innovative ecosystem where users with different backgrounds can find the right tools and features. At first glance, it appears to have a very client-centric approach, so it would be appropriate to see what other features are worth noting.

Arox Capital logo

Arox Capital Assets

The Arox Capital trading products are diversified, covering some of the largest and popular markets in the world:

  • Forex
  • Indices
  • Commodities
  • Stocks
  • Cryptocurrencies

Access to as many trading instruments as possible should be available with any brand, given the activity seen in the financial markets. With an account at Arox Capital, traders can find the right assets for them, based on country of residence or trading style. Variable spreads start at 0.1 pips, but you should keep in mind that the trading account type and the market liquidity can have an impact on these values.

Trading Software

Thanks to the Arox Capital WebTrader, a unique trading experience can be provided. This is a platform accessible via a browser that can be the right choice for both professionals and those just getting started. At first glance, it is a simple and intuitive platform, well-structured so there won’t be any issues in finding the trading tools or placing trades fast.

Arox Capital WebTrader

The platform works the same on desktop, laptop, or mobile devices, which means traders won’t need to worry about hardware specs or compatibility. Multiple chart types and execution modes, risk management tools, and other features like making deposits or changing account settings, make the Arox Capital WebTrader a versatile and multi-functional trading solution.  This is the only option currently available with the broker.

Arox Capital Account Types

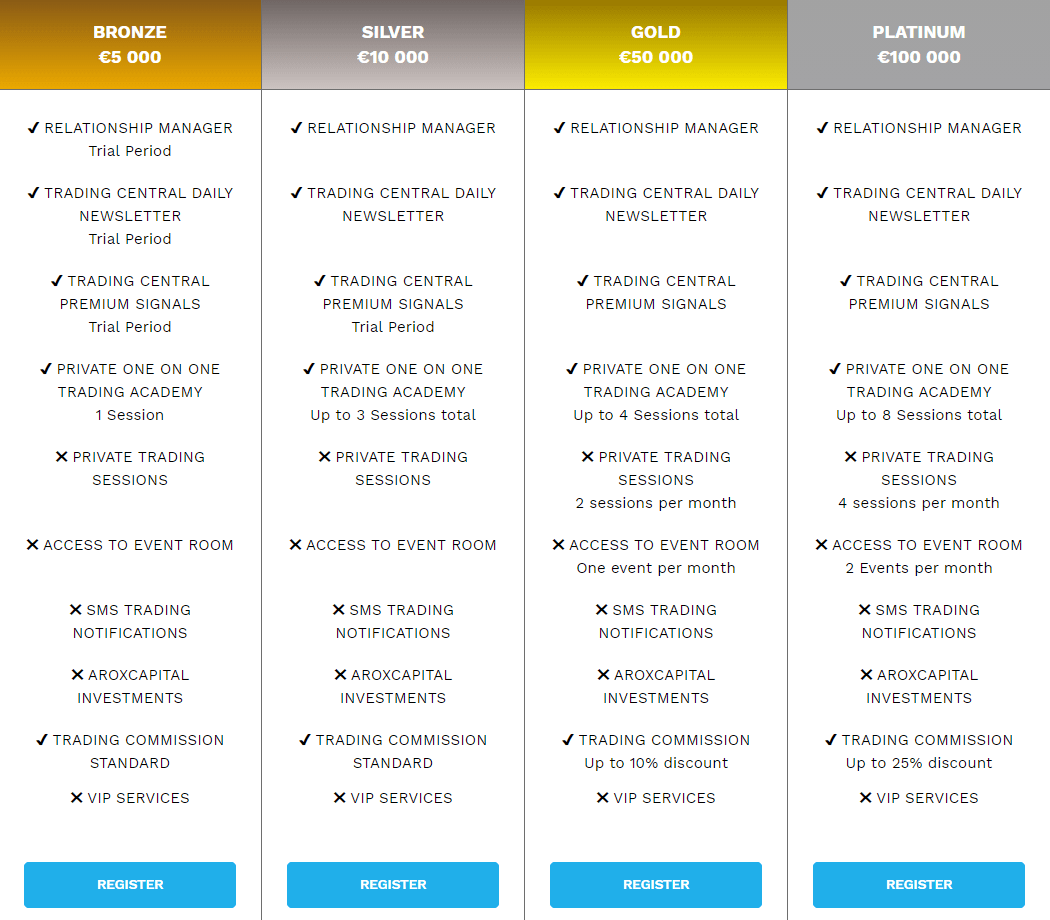
When speaking about the Arox Capital trading accounts, diversity is the first word that comes to mind. Not only because there are 5 account options available, but also due to the broad range of features available.

Arox Capital trading accounts

Regardless of choice, all accounts will benefit from online chat support, funds stored in segregated bank accounts, STP/ no dealing desk execution, and plenty of educational resources. Trading live with Arox Capital is available from deposits of 200 euros, even though the broker recommends a bronze account to start from a low of 1000 euros.

Traders can start small and test the live trading conditions without any other roadblocks and increase their accounts once they’re sure this is the right place to be. In terms of the account types, it is important to consider that for each larger account, new premium features are unlocked.  To fund an account or make withdrawals, traders can use credit/debit cards, wire transfers, or popular e-wallets.

Pros

  • A variety of trading products available for all customers
  • Resources provided by Trading Central
  • Strong financial security granted

Cons

  • Not all asset classes are covered at Arox Capital
  • Traders need to consider potential geographical restrictions
  • Standard trading commissions for Bronze and Silver accounts

Arox Capital Review Conclusion

Considering the favorable conditions in the financial markets combined with the diversity of trading benefits associated with the Arox Capital, it would be fair to assume this is a broker to watch by all retail traders. The customer-centric approach and constant upgrades are making this a place where financial markets are affordable for everyone.

By Taylor Wilman

Intraday Market Analysis – Last Chance To Rebound

By Orbex

GBPUSD meets critical support

gbpusd

The pound falls back as traders take profit after a strong performance from the start of the year.

The price action has retreated to March’s low at 1.3670, a support on the daily chart to keep the uptrend intact. The pair is likely to consolidate from that major level while the RSI recovers from the sub-30 area.

1.3770 is the immediate resistance and a bullish breakout may convince buyers that the correction is over.

To the downside, 1.3600 would be the target if the pair struggles to find bids.

USDCAD struggles to bounce higher

usdcad

A fall in Canada’s unemployment rate from 8.2 % to 7.5 % in March helped lift the loonie against its US counterpart.

The pair has met strong selling pressure around the supply area (1.2640) found on the daily chart.

An overbought RSI has prompted short-term traders to take profit. However, the price’s subsequent failure to make a higher high signals weakness in the past week’s rally.

A drop below 1.2535 could trigger a broader sell-off in the continuation of the downtrend with 1.2470 as the next target.

EURAUD pierces through multiple resistances

euraud

The Aussie was spoiled by the government’s restrictions on the AstraZeneca vaccine which would delay its vaccination campaign.

After bouncing off a three-year low (1.5260) the euro has been building up its momentum. The latest surge above the key resistance at 1.5600 suggests that buyers are gaining confidence and aiming for 1.5690.

An overbought RSI might temper the optimism and 1.5530 is first support in case of a pullback. As long as the price is above the base of the recent rally (1.5430), the bias will remain bullish.

By Orbex

Forex Technical Analysis & Forecast 12.04.2021

Article By RoboForex.com

EURUSD, “Euro vs US Dollar”

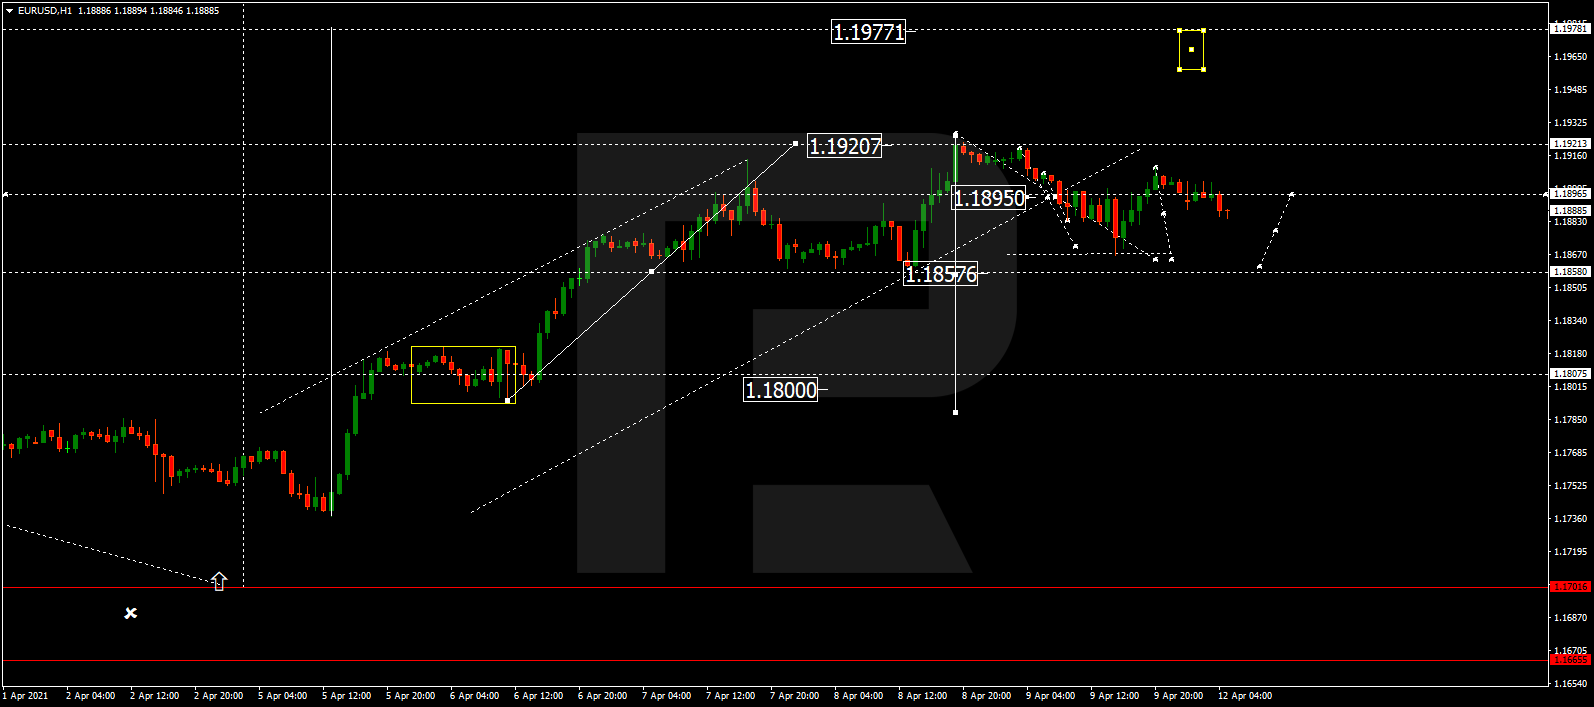
EURUSD is falling towards 1.1855 and may later grow to reach 1.1895, thus forming a new consolidation range between these two levels. If the price breaks this range to the downside, the market may fall to reach 1.1800; if to the upside – resume trading upwards with the target at 1.1977 and then form a new descending structure towards 1.1740.

EURUSD
Risk Warning: the result of previous trading operations do not guarantee the same results in the future

GBPUSD, “Great Britain Pound vs US Dollar”

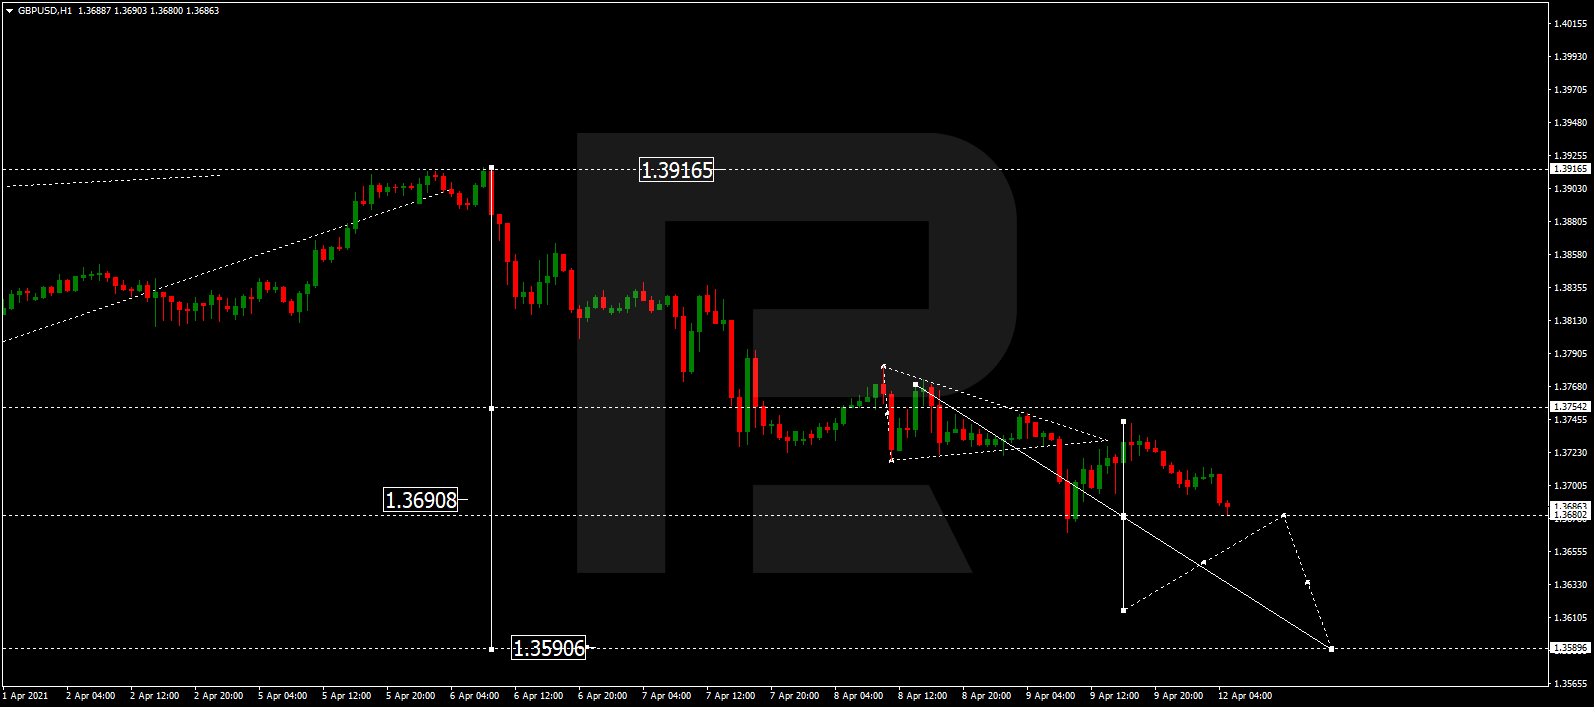
GBPUSD continue trading downwards with the short-term target at 1.3590. After that, the instrument may form one more ascending structure towards 1.3755 and then resume falling with the target at 1.3500.

GBPUSD
Risk Warning: the result of previous trading operations do not guarantee the same results in the future

USDRUB, “US Dollar vs Russian Ruble”

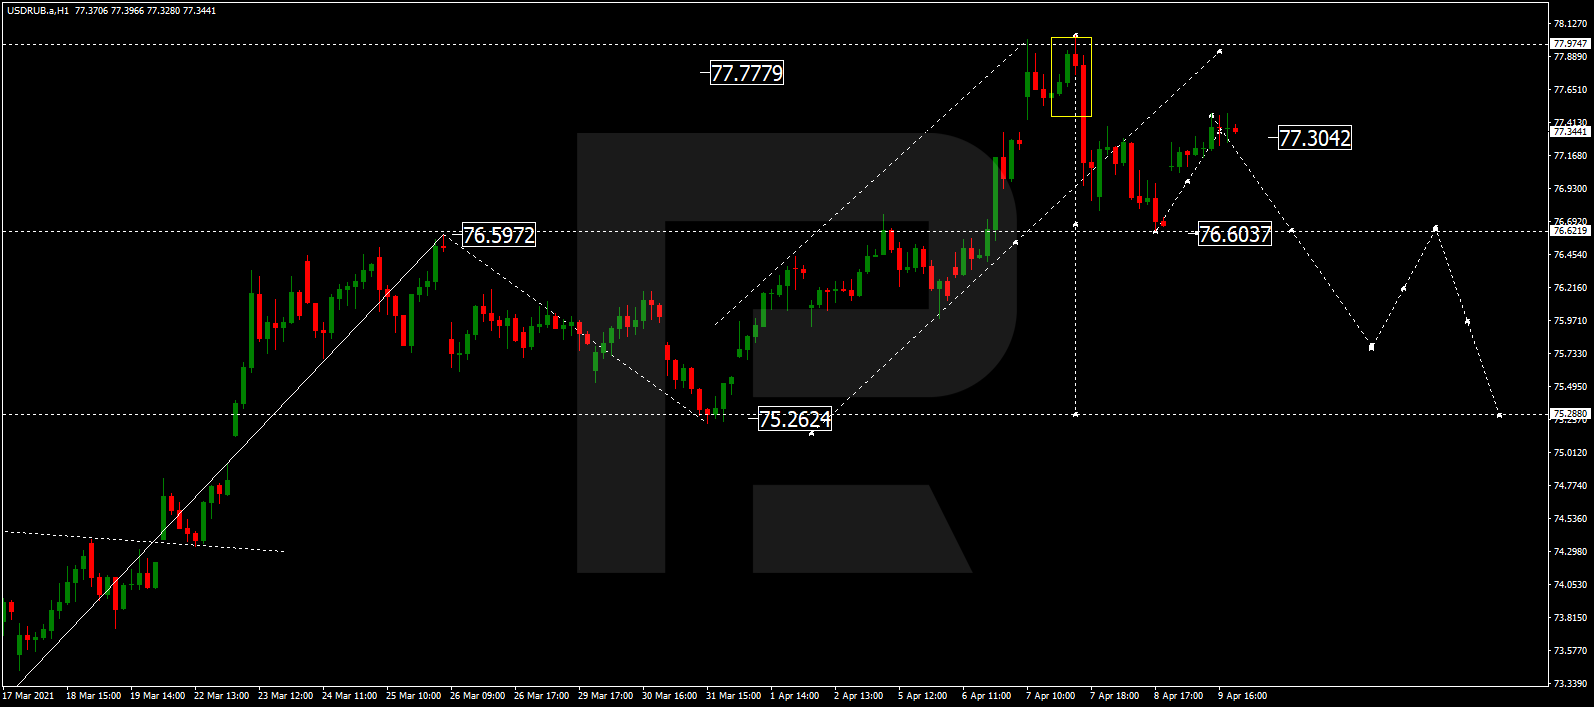
After reaching the closest correctional target at 77.30, USDRUB may extend this correction up to 77.70. Later, the market may form a new descending structure to break 76.60 and then continue falling with the first target at 75.00.

USDRUB
Risk Warning: the result of previous trading operations do not guarantee the same results in the future

USDJPY, “US Dollar vs Japanese Yen”

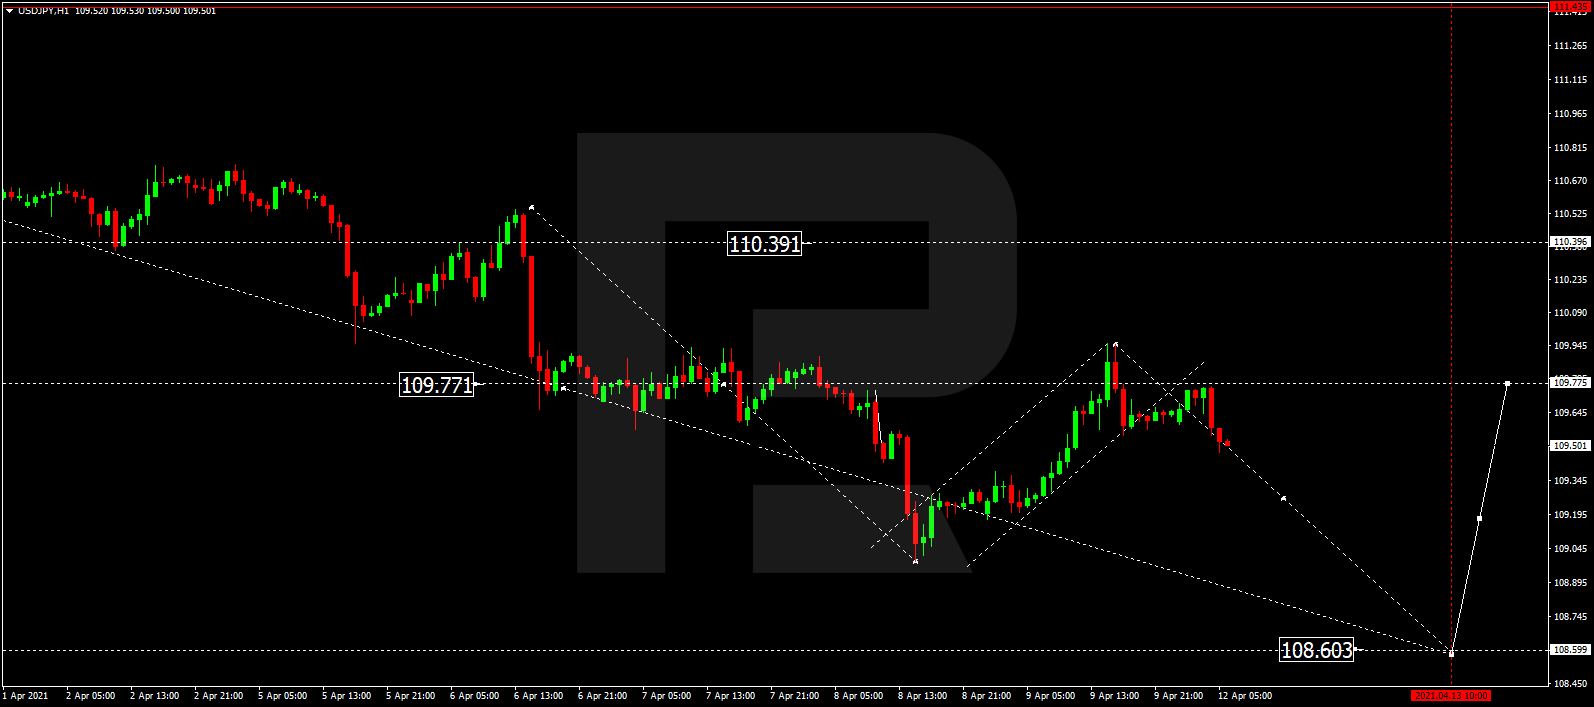
USDJPY is trading downwards to reach 108.68. After that, the instrument may start a new correction with the target at 109.77.

USDJPY
Risk Warning: the result of previous trading operations do not guarantee the same results in the future

USDCHF, “US Dollar vs Swiss Franc”

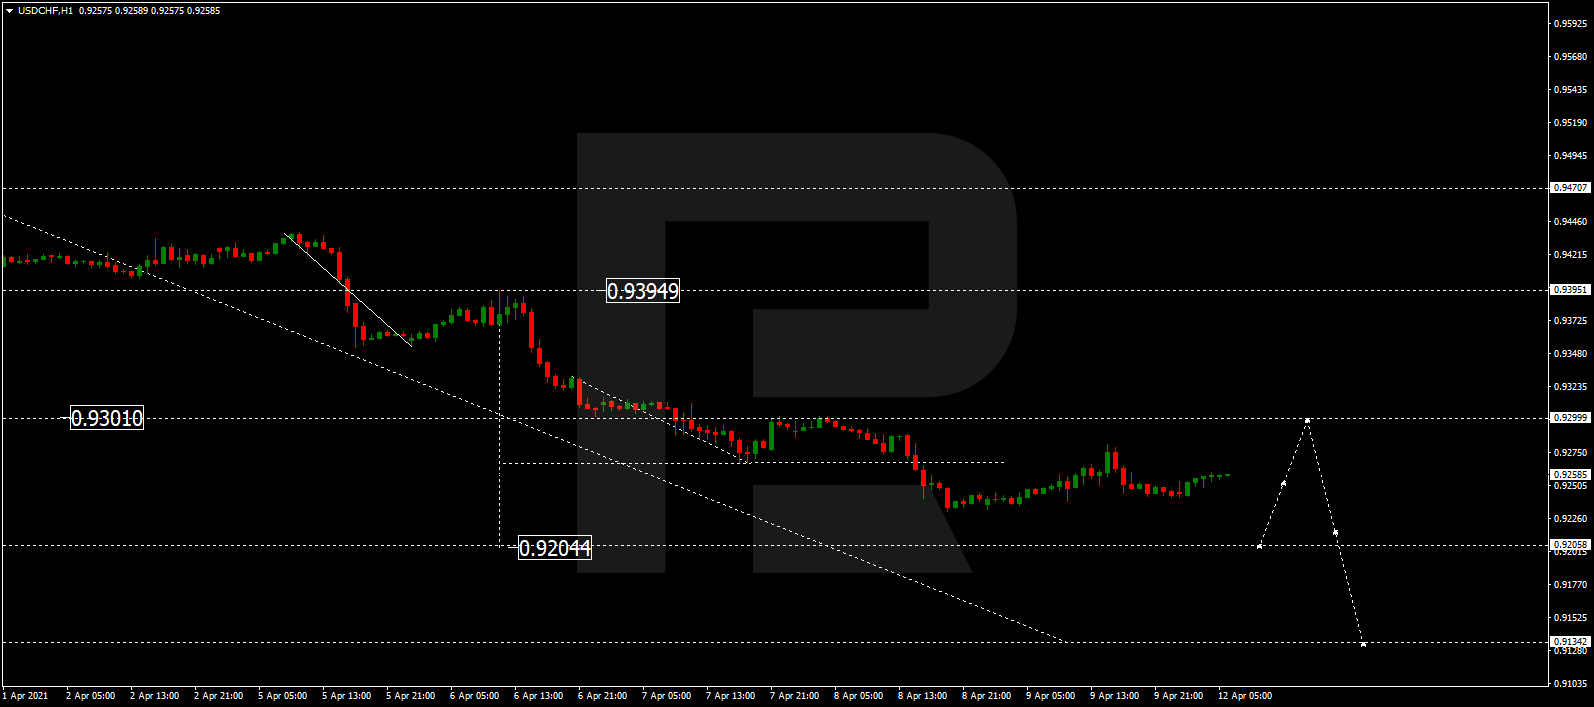
USDCHF is correcting towards 0.9313. Later, the market may start a new decline with the target at 0.9194.

USDCHF
Risk Warning: the result of previous trading operations do not guarantee the same results in the future

AUDUSD, “Australian Dollar vs US Dollar”

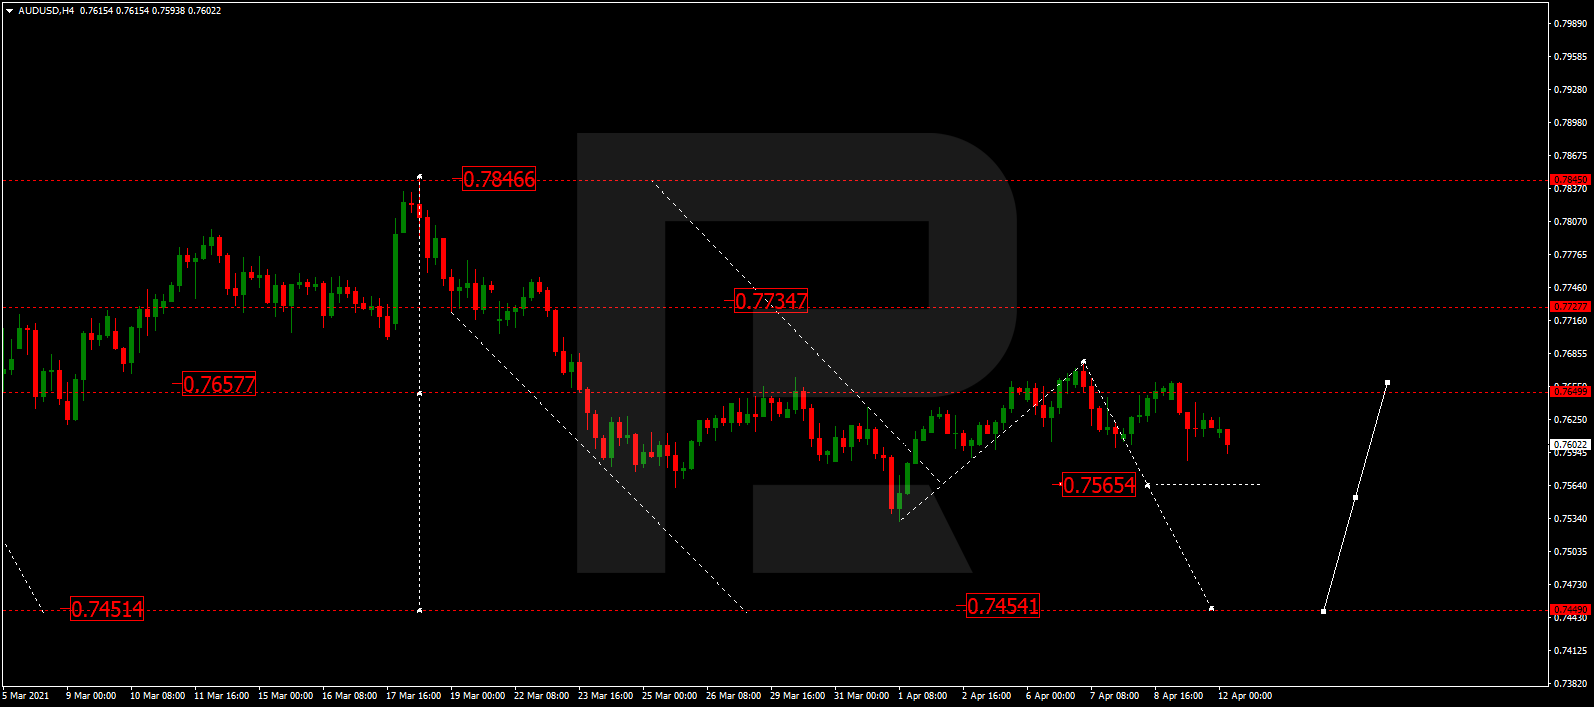
AUDUSD is consolidating below 0.7655 without any particular direction. If the price breaks this range to the downside, the market may fall to break 0.7565 and then continue trading downwards with the target at 0.7454.

AUDUSD
Risk Warning: the result of previous trading operations do not guarantee the same results in the future

BRENT

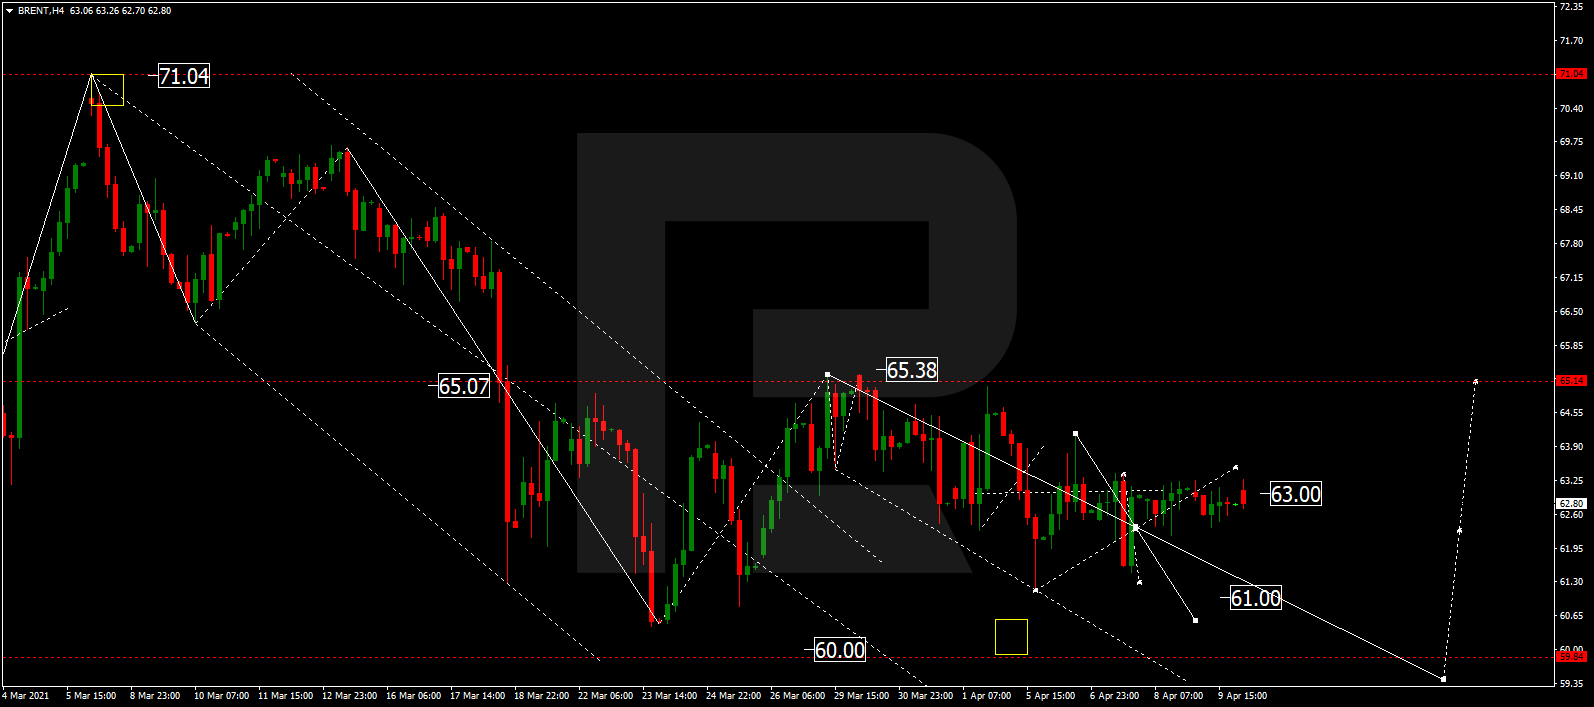
Brent is still consolidating around 63.00 without any particular direction. Possibly, today the asset may continue falling to reach the key target at 60.00. Later, the market may form a new ascending wave towards 65.50.

BRENT
Risk Warning: the result of previous trading operations do not guarantee the same results in the future

XAUUSD, “Gold vs US Dollar”

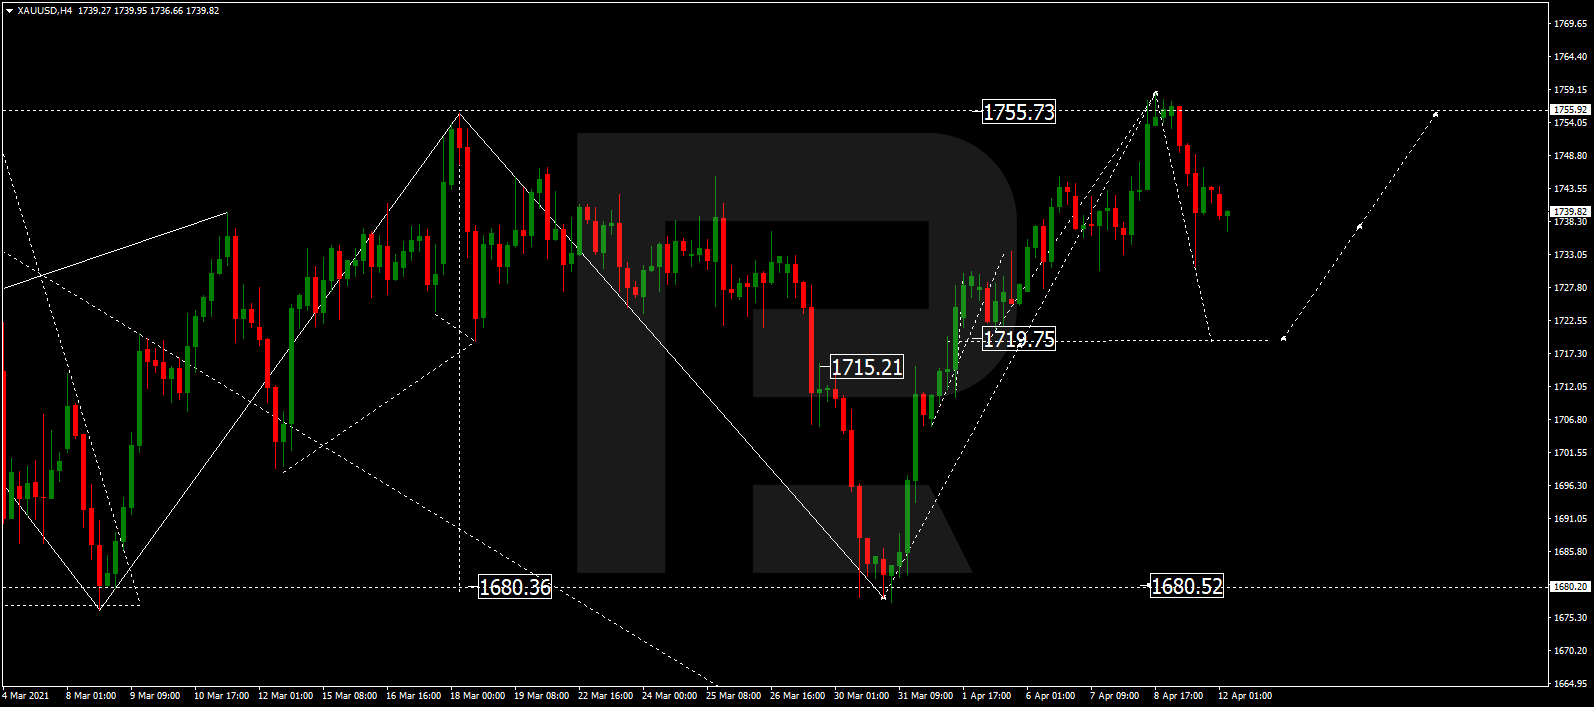
Gold is correcting downwards to reach 1720.00. After that, the instrument may form one more ascending structure to break 1755.75 and then continue growing with the short-term target at 1850.50.

GOLD
Risk Warning: the result of previous trading operations do not guarantee the same results in the future

S&P 500

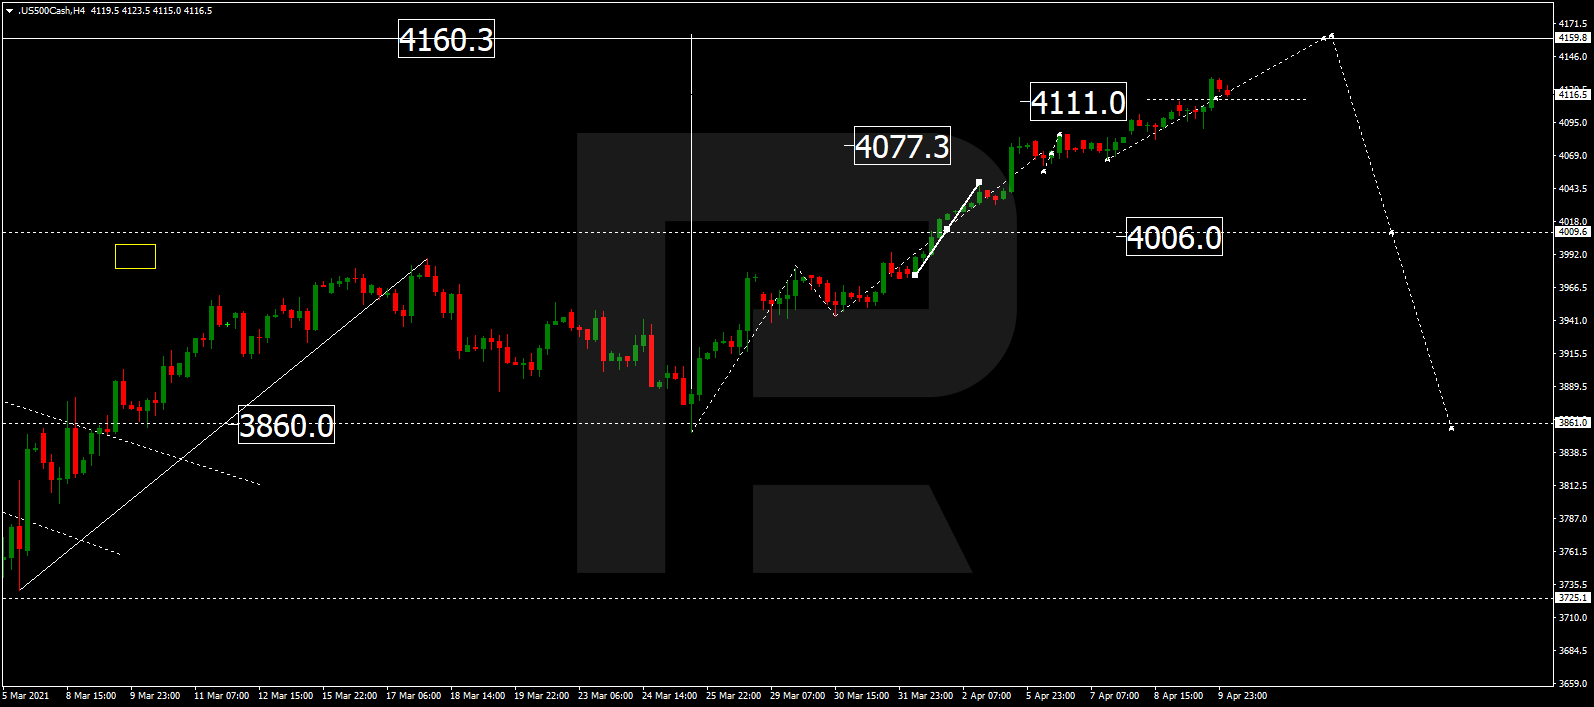
After breaking 4111.0 to the upside, the S&P index is expected to continue groping with the short-term target at 4160.3. Later, the market may resume falling with the first target at 4006.0.

S&P 500

Article By RoboForex.com

Attention!
Forecasts presented in this section only reflect the author’s private opinion and should not be considered as guidance for trading. RoboForex LP bears no responsibility for trading results based on trading recommendations described in these analytical reviews.