Week Ahead: 3 events that could move EURUSD over 100 pips

By ForexTime 

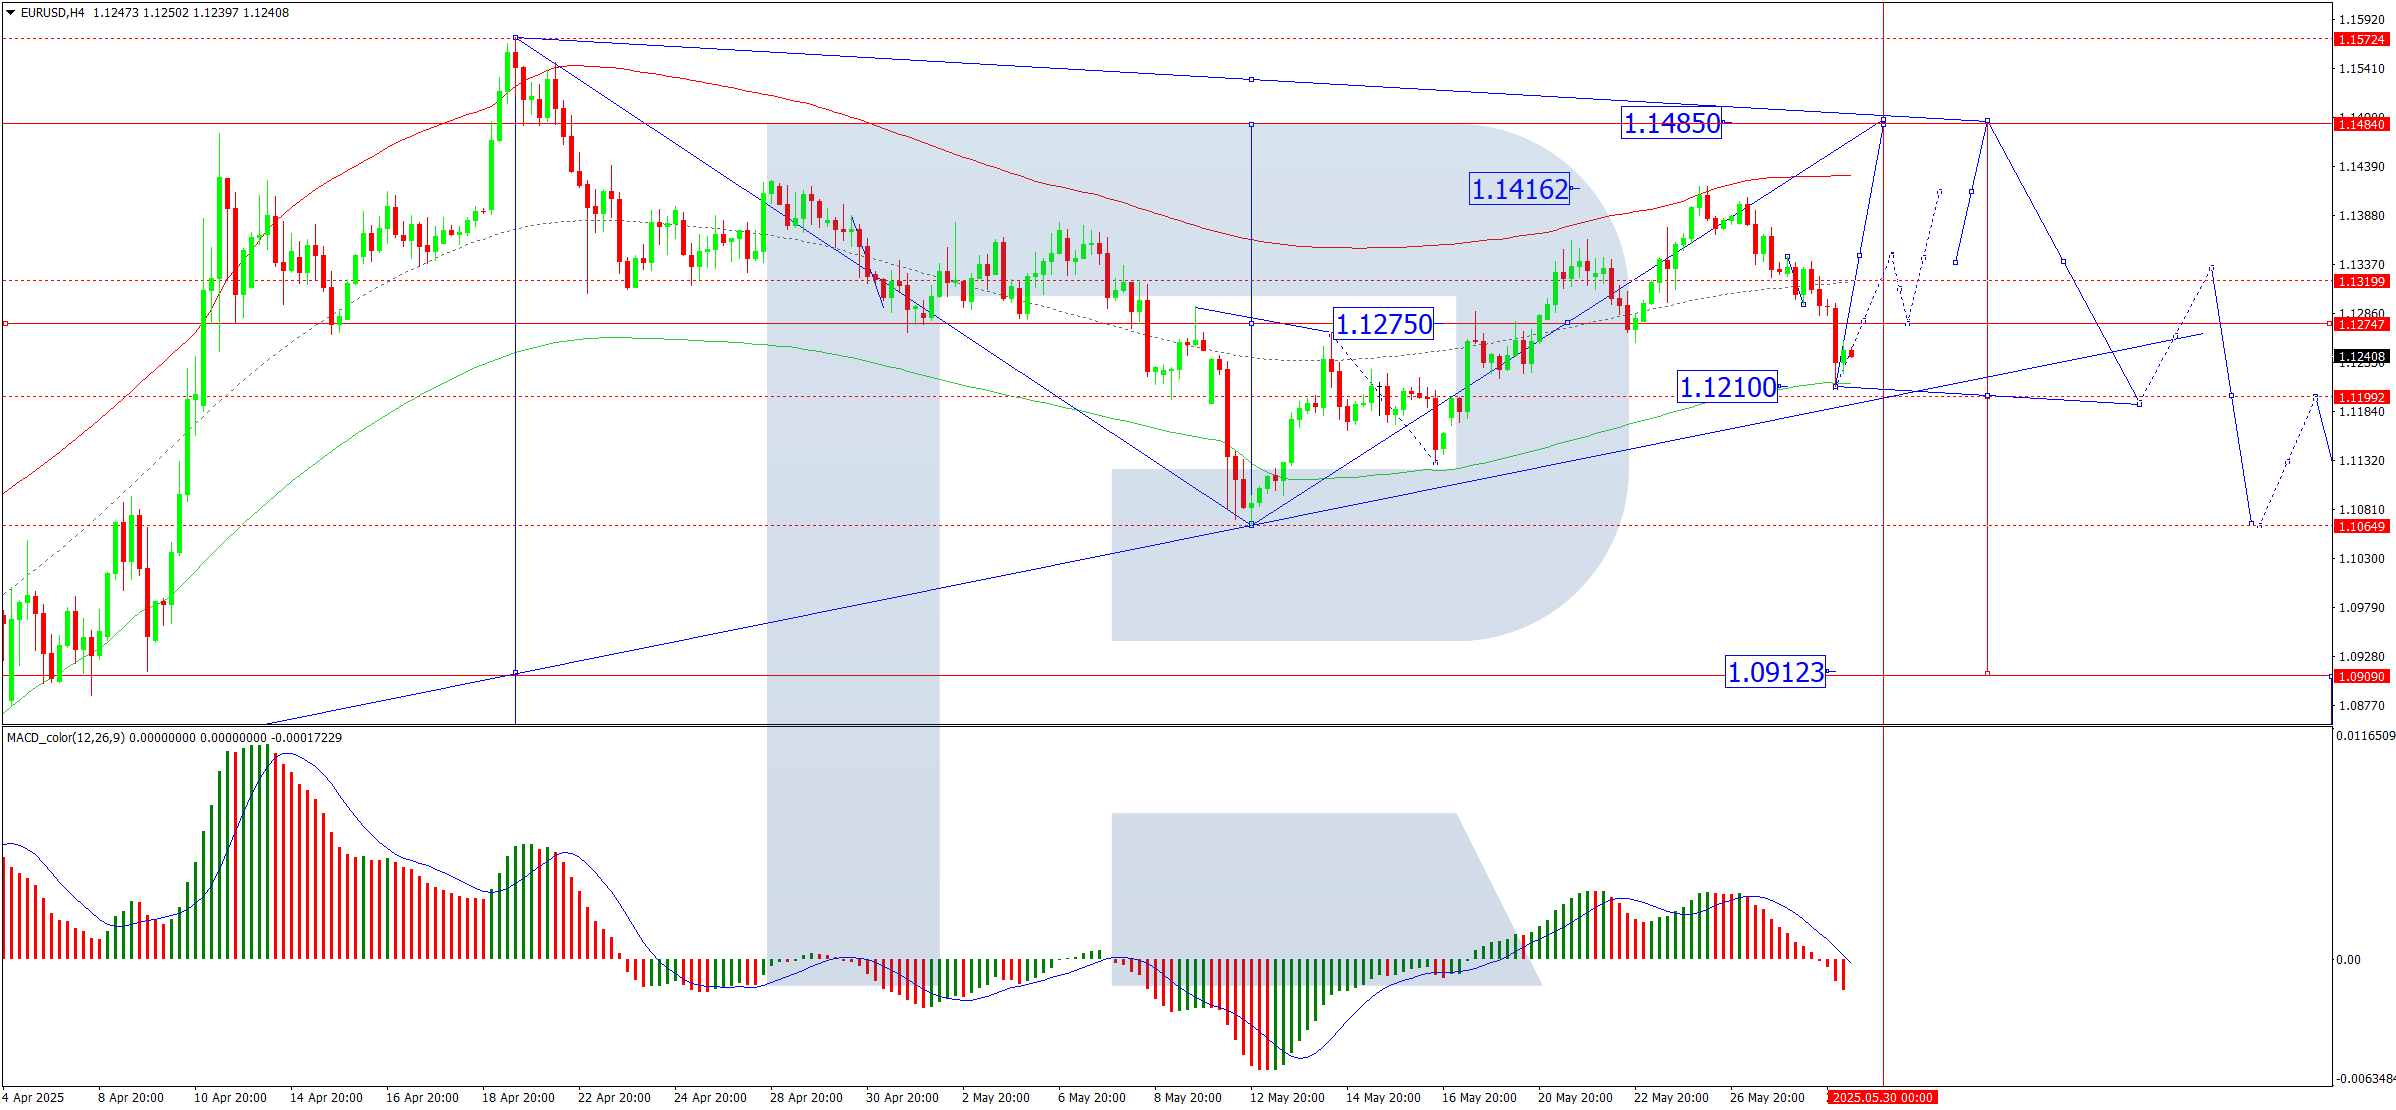
  • EURUSD set to end May unchanged; mostly kept to 1.11 – 1.14 range this month
  • June 3: Eurozone inflation (CPI) expected to slow in May
  • June 5: European Central Bank set to cut rates again, signal future cuts
  • June 6: US jobs report may add to US risks – fiscal deficit, tariff rollout, etc.
  • Bloomberg model: 74% chance EURUSD trades between 1.118 – 1.149 next week


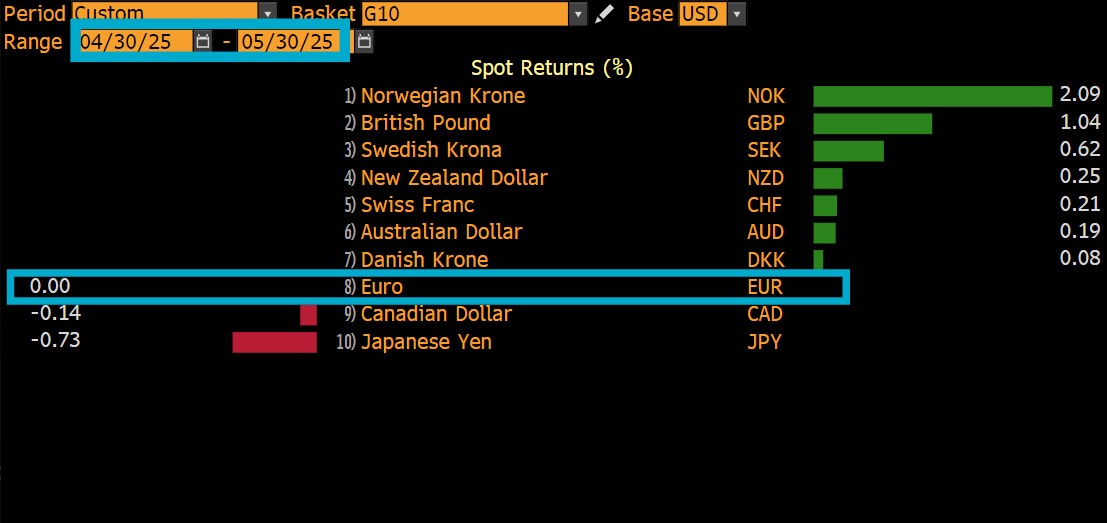
The euro is flat against the US dollar this month.

At the time of writing, EURUSD is right back where it began May 2025, with just hours remaining in the last trading day of the month (though the US PCE data is still due prior to the weekend).

The euro has clearly lagged behind its G10 peers’ performance against the USD:

(IMPORTANT: The data below was generated before the US PCE data is released)

Imagen
euro flat against USD in May 2025


FX markets still gripped by Trump policies

As we enter the first week of June, of course markets remain watchful over:

  • US fiscal deficit

The Senate is set to have their take on the tax and spending legislation, which had already been passed by the House, and stoked fears of a widening fiscal deficit (US government spending more than it earns from taxes)


  • US tariff policies
    President Trump’s on-then-off tariff rollout, along with the shifting percentage numbers, have rocked markets. 

    Although the shock-and-awe from these tariff-related developments have waned of late, they still warrant constant vigilance.


The above-listed factors will be a common theme during a week that features all these economic events:

Monday, June 2

  • SGD: Singapore May PMI
  • US30 index: US May ISM manufacturing
  • USDInd: Speeches by Fed Chair Jerome Powell, Fed Governor Christopher Waller, Dallas Fed President Lorie Logan, Chicago Fed President Austan Goolsbee
  • NAS100 index: US Senate to hash out Trump’s tax and spending bill this week?

Tuesday, June 3

  • AUD: RBA meeting minutes; Australia 1Q current account balance
  • CN50 index: China May manufacturing PMI
  • EU50 index: Eurozone May CPI; April unemployment rate
  • US400 index: US April JOLTS job openings, factory orders
  • USDInd: Chicago Fed President Austan Goolsbee, Dallas Fed President Lorie Logan speech

Wednesday, June 4

  • AU200 index: Australia 1Q GDP
  • SG20 index: Singapore May PMI
  • CAD: Bank of Canada rate decision
  • USDInd: Speeches by Atlanta Fed President Raphael Bostic and Fed Governor Lisa Cook

Thursday, June 5

  • AUD: Australia April trade balance
  • CHINAH index: China May services, composite PMI
  • TWN index: Taiwan May CPI, PPI
  • EU50 index: Eurozone April PPI; Germany April factory orders
  • EUR: ECB rate decision
  • US30 index: US weekly initial jobless claims
  • USDInd: Fed Governor Adriana Kugler, Philadelphia Fed President Patrick Harker speech

Friday, June 6

  • EU50 index: Eurozone April retail sales; 1Q GDP and employment (final)
  • EUR: Germany April industrial production, trade balance
  • CAD: Canada May unemployment
  • US500 index: US May nonfarm payrolls


3 scheduled events that could rock EURUSD

For EURUSD in particular, these scheduled events could have a major say on whether the world’s most-traded FX pair could get a catch-up boost:

1) Tuesday, June 3: Eurozone May consumer price index (CPI)

Economists predict that Eurozone inflation eased lower in May:

  • CPI year-on-year (May 2025 vs. May 2024): 2%
    If so, that would lower than April’s 2.2% y/y print
  • CPI month-on-month (May 2025 vs. April 2025): 0%
    Unchanged from April
  • Core CPI year-on-year (excluding energy, food, alcohol, tobacco prices): 2.4%
    If so, that would lower than April’s core 2.7% y/y print

Slower-than-expected inflation, closer to the ECB’s 2% target, should pave the way for more rate cuts. Such prospects could keep the euro on the backfoot.

However, a surprise uptick in the CPI figures may boost EURUSD.

EURUSD is expected to react with a 0.44% climb or a 0.25% drop in the 6 hours after this CPI release.


2) Thursday, June 5th: European Central Bank (ECB) rate decision

The ECB is widely expected to again lower its rates by a further 25-basis points – anything else would be a shocker.

More importantly, forward-looking traders and investors are eager to get more clues about the timing of the next ECB rate cut.

Markets currently predict that, after the June policy meeting, there’s a 78% chance that the ECB will cut rates again in September – the final cut for 2025.

EURUSD could get a lift if the ECB pushes back against such forecasts, setting the bar higher for future rate cuts.

However, if the ECB next week opens the door wide open and hints at more-than-one cut (after next week) by end-2025, that could soften the euro.

EURUSD could move 0.36% up or 0.23% down in the 6 hours after ECB’s rate decision.


3) Friday, June 6th: US May nonfarm payrolls (NFP)

Here are what economists predict for this always-pivotal monthly jobs report out of the world’s largest economy:

  • May headline NFP number: 130,000
    If so, that would be lower than the 177k new jobs added in April
  • May unemployment rate: 4.2%
    Unchanged from April

The US dollar could weaken/EURUSD could rise on a weaker-than-expected US jobs report (fewer-jobs added/higher unemployment) that makes for a more challenging economic outlook.

However, a still-robust US labour market could strengthen the buck and drag EURUSD lower.

EURUSD could move 0.27% up or 0.8% down in the 6 hours after this US NFP release.


Imagen
Week Ahead: 3 events that could rock EURUSD

Potential Scenarios

According to the Bloomberg FX forecast model …

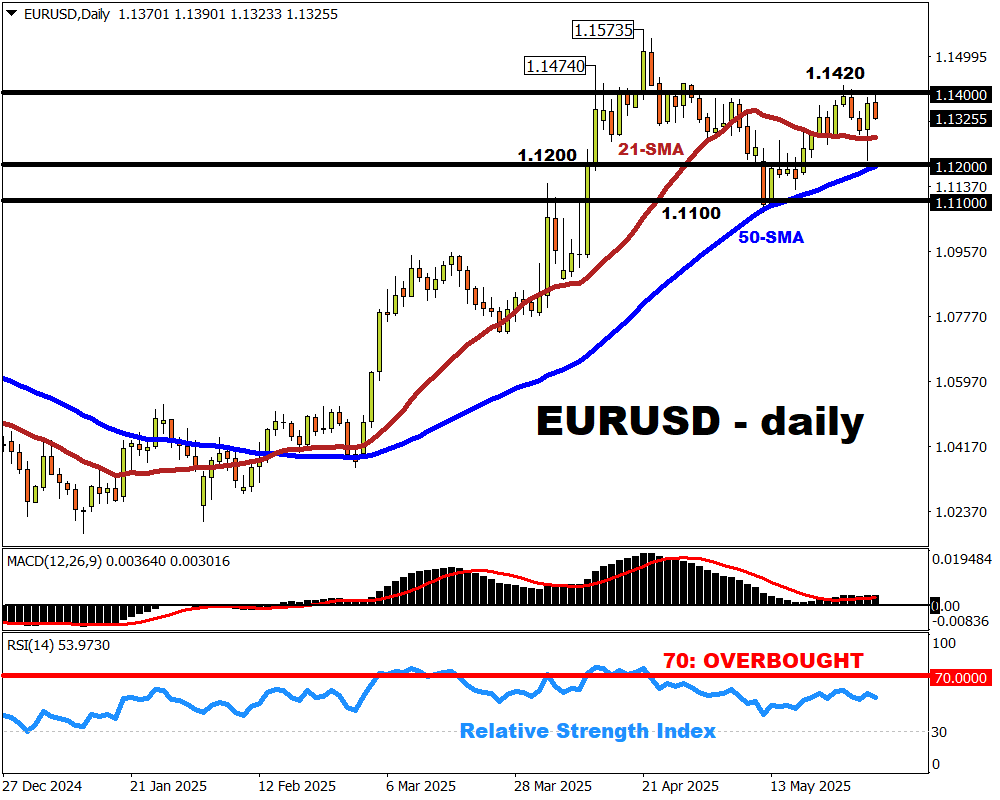
EURUSD is likely (74% chance) to trade between 1.118 – 1.149 next week.

  • BULLISH: If EURUSD can break above the stubborn resistance around 1.1420, then bulls can set their sights on the 1.1490 region – the upper bound of Bloomberg’s FX forecasted range.

A major bout of US dollar weakness may encourage EURUSD bulls (those hoping prices will go higher) to revisit the 1.157 peak in April – also the highest levels since November 2021.


  • BEARISH: A daily close below its 21-day simple moving average (SMA) – a critical support in recent days – may see EURUSD re-testing support around the 1.1200/50-day SMA.


Forex-Time-LogoArticle by ForexTime

ForexTime Ltd (FXTM) is an award winning international online forex broker regulated by CySEC 185/12 www.forextime.com

Gold Ends the Week Lower as Risk Appetite Returns

By RoboForex Analytical Department 

The price of gold fell below 3,300 USD per troy ounce on Friday, closing the week with a loss of approximately 1%.

Key drivers behind gold’s movement

Investors remain cautious ahead of today’s US PCE inflation report, which could offer fresh clues on potential Federal Reserve rate adjustments.

On Thursday, gold prices gained nearly 1% after an appeals court temporarily upheld tariffs imposed during Donald Trump’s presidency. This followed a ruling by a US trade court a day earlier, which had blocked the tariffs, deeming their implementation unlawful.

San Francisco Fed President Mary Daly reiterated that the Fed could still deliver two rate cuts this year, as projected in March. However, she emphasised that rates must hold steady for now to achieve the 2% inflation target.

Gold faced volatility in May as global risk sentiment improved, reducing demand for safe-haven assets. Hopes of a resolution in US trade disputes spurred investors back into equity markets.

Technical analysis: XAU/USD

H4 Chart:

  • The market completed a correction wave to 3,246, followed by an upward impulse to 3,331
  • Currently, a downward pullback towards 3,280 is forming, with consolidation around 3,320
  • A downside breakout could extend losses to 3,200, while an upside breakout may fuel a rally towards 3,388, exhausting the bullish wave
  • A subsequent downtrend towards 3,060 is anticipated
  • MACD confirmation: The signal line has exited the histogram zone, indicating a firm upward trend

H1 Chart:

  • The upward wave to 3,331 has concluded, with a correction to at least 3,255 expected today
  • Thereafter, another upswing towards 3,355 (potentially extending to 3,388) may follow, although this is viewed as a corrective pullback within the broader downtrend
  • Once complete, a new decline towards 3,222 (possibly 3,060) is likely
  • The stochastic indicator supports this view: The signal line is below 20, rising sharply towards 80


Conclusion

Gold’s near-term direction hinges on breakouts from the current range, with technical indicators suggesting further volatility ahead.


Disclaimer

Any forecasts contained herein are based on the author’s particular opinion. This analysis may not be treated as trading advice. RoboForex bears no responsibility for trading results based on trading recommendations and reviews contained herein.

Top Healthcare Companies scored from recent earnings including Humana

By InvestMacro Research

Earnings season continues on and our latest update highlights some of the top companies that have been recently added to our Cosmic Rays Watchlist.

Today, we have a selection of healthcare companies. The healthcare sector has been one of the weak links so far this year among the sector stock indexes and is considered a defensive stock category (in favor when growth and stocks are not under pressure).

The Cosmic Rays Watchlist is the output from our proprietary fundamental analysis algorithm. The algo examines company fundamental metrics, earnings trends and overall sector strength trends. The aim is identify quality dividend-paying companies on the NYSE and Nasdaq stock exchanges. If a company scores over 50, it gets added to our Watchlist for further analysis.

We use this system as a stock market ideas generator and to update our Watchlist every quarter. However, be aware the fundamental system does not take the stock price as a direct element in our rating so one must compare each idea with their current stock prices (this is not a timing tool).

Many studies are consistently showing overvalued markets and that has to be taken into consideration with any stock market idea. As with all investment ideas, past performance does not guarantee future results. A stock added to our list is not a recommendation to buy or sell the security.


Here we go with 5 of our of Top Healthcare Stocks scored in Q1 2025:


CONMED Corporation (CNMD):

CONMED Corporation (Symbol: CNMD) was recently added to our Cosmic Rays WatchList. CNMD scored a 68 in our fundamental rating system on May 1st.

At time of writing, only 4.44% of stocks have scored a 60 or better out of a total of 13,007 scores in our earnings database. This stock has made our Watchlist a total of 3 times and rose by 8 system points from our last update.

CNMD is a Small Cap stock and part of the Healthcare sector. The industry focus for CNMD is Medical – Devices.

ConMed sports a PE ratio of approximately 15.64. The dividend yield at this moment is 1.39% with a dividend payout ratio around 20%. ConMed has beaten analyst earnings expectations 4 quarters in a row.

On a price return basis, ConMed has fared worse than its healthcare benchmark with a 52-week price return of over -23% compared to the healthcare benchmark which has fallen almost -9% in the past 52 weeks.

Company Description (courtesy of SEC.gov):

CONMED Corporation, a medical technology company, develops, manufactures, and sells surgical devices and related equipment for surgical procedures worldwide. Company Website: https://www.conmed.com


Asset vs Sector Benchmark:*P/E Ratio (TTM)*52-Week Price Return
– Stock: CONMED Corporation (CNMD)15.64-23.03
– Benchmark Symbol: XLV24.92-8.97


* Data through May 29, 2025


Novartis AG (NVS):

Novartis AG (Symbol: NVS) was recently added to our Cosmic Rays WatchList. NVS scored a 77 in our fundamental rating system on April 30th.

At time of writing, only 1.81% of stocks have scored a 70 or better out of a total of 13,007 scores in our earnings database. This stock has made our Watchlist a total of 9 times and rose by 20 system points from our last update.

NVS is a Mega Cap stock and part of the Healthcare sector. The industry focus for NVS is Drug Manufacturers – General.

Novatis (NVS) is a company with a PE ratio of 17.43. The current dividend yield is approximately 3.50%. This company is a mega cap and has seen its EPS beat analysts’ expectations for 4 quarters in a row. The payout ratio currently is approximately 65%.

The NVS price return has beaten the healthcare benchmark over the last 52 weeks with a return of over 11% compared to a -9% benchmark return.

Company Description (courtesy of SEC.gov):

Novartis AG researches, develops, manufactures, and markets healthcare products worldwide. The company operates through two segments, Innovative Medicines and Sandoz. The Innovative Medicines segment offers prescription medicines for patients and healthcare providers. Company Website: https://www.novartis.com


Asset vs Sector Benchmark:*P/E Ratio (TTM)*52-Week Price Return
– Stock: Novartis AG (NVS)17.4311.14
– Benchmark Symbol: XLV24.92-8.97


* Data through May 29, 2025


Novo Nordisk A/S (NVO):

Novo Nordisk A/S (Symbol: NVO) was recently added to our Cosmic Rays WatchList. NVO scored a 65 in our fundamental rating system on May 8th.

At time of writing, only 4.44% of stocks have scored a 60 or better out of a total of 13,007 scores in our earnings database. This stock has made our Watchlist a total of 4 times and rose by 62 system points from our last update.

NVO is a Mega Cap stock and part of the Healthcare sector. The industry focus for NVO is Drug Manufacturers – General.

Novo Nordisk (NVO), a healthcare company out of Denmark that engages in the manufacturing distribution of pharmaceutical products. The PE ratio for NVO is approximately 20.50. The dividend yield comes in at approximately 2.43% with a payout ratio on its dividend near 51%. NVO has beaten analysts’ earnings expectations 3 out of the last 4 quarters and for the last 3 quarters in a row.

NVO has significantly underperformed the benchmark over the last 52 weeks with an almost -50% return over that time compared to the -9% for the healthcare benchmark. NVO had previously surged higher with a return of over +200% from September 2022 to June 2024 before retreating lower.

Company Description (courtesy of SEC.gov):

Novo Nordisk A/S, together with its subsidiaries, engages in the research and development, manufacture, and distribution of pharmaceutical products in Europe, the Middle East, Africa, Mainland China, Hong Kong, Taiwan, North America, and internationally. It operates in two segments, Diabetes and Obesity Care, and Rare Disease. Company Website: https://www.novonordisk.com


Asset vs Sector Benchmark:*P/E Ratio (TTM)*52-Week Price Return
– Stock: Novo Nordisk A/S (NVO)20.58-49.47
– Benchmark Symbol: XLV24.92-8.97


* Data through May 29, 2025


CVS Health Corporation (CVS):

CVS Health Corporation (Symbol: CVS) was recently added to our Cosmic Rays WatchList. CVS scored a 55 in our fundamental rating system on May 2nd.

At time of writing, only 7.77% of stocks have scored a 50 or better out of a total of 13,007 scores in our earnings database. This stock has made our Watchlist a total of 4 times and rose by 9 system points from our last update.

CVS is a Large Cap stock and part of the Healthcare sector. The industry focus for CVS is Medical – Healthcare Plans.

CVS has a PE ratio of just below 15.00 at the moment. The dividend yield for CVS is 4.30% with a payout ratio of around 63%. CVS has beaten analysts’ expectations 3 out of the last 4 quarters.

CVS has beaten the healthcare benchmark with a 12% return over the last 52 weeks compared to the -9% healthcare benchmark price return.

Company Description (courtesy of SEC.gov):

CVS Health Corporation provides health services in the United States. The company’s Health Care Benefits segment offers traditional, voluntary, and consumer-directed health insurance products and related services. Company Website: https://www.cvshealth.com


Asset vs Sector Benchmark:*P/E Ratio (TTM)*52-Week Price Return
– Stock: CVS Health Corporation (CVS)14.9212.26
– Benchmark Symbol: XLV24.92-8.97


* Data through May 29, 2025


Humana Inc. (HUM):

Humana Inc. (Symbol: HUM) was recently added to our Cosmic Rays WatchList. HUM scored a 57 in our fundamental rating system on May 1st.

At time of writing, only 7.77% of stocks have scored a 50 or better out of a total of 13,007 scores in our earnings database. This stock is on our Watchlist for the first time and rose by 62 system points from our last update.

HUM is a Medium Cap stock and part of the Healthcare sector. The industry focus for HUM is Medical – Healthcare Plans.

Humana (HUM) has a PE ratio of 16.11. The estimated yield is 1.45% with a dividend payout ratio of right around 25%. Humana has beaten analysts’ expectations for 4 quarters in a row on its earnings per share. Argus Research and Refinitiv/Verus recently upgraded Humana to BUY.

Humana has fared worse than the healthcare benchmark over the last 52 weeks with a return of roughly -35% compared to the price return for the healthcare benchmark of approximately -9%.

Company Description (courtesy of SEC.gov):

Humana Inc., together with its subsidiaries, operates as a health and well-being company in the United States. It operates through three segments: Retail, Group and Specialty, and Healthcare Services. The company offers medical and supplemental benefit plans to individuals. Company Website: https://www.humana.com


Asset vs Sector Benchmark:*P/E Ratio (TTM)*52-Week Price Return
– Stock: Humana Inc. (HUM)16.11-35.14
– Benchmark Symbol: XLV24.92-8.97


* Data through May 29, 2025


By InvestMacro – Be sure to join our stock market newsletter to get our updates and to see more top companies we add to our stock watch list.

All information, stock ideas and opinions on this website are for general informational purposes only and do not constitute investment advice. Stock scores are a data driven process through company fundamentals and are not a recommendation to buy or sell a security. Company descriptions provided by sec.gov.

Managing forests and other ecosystems under rising threats requires thinking across wide-ranging scenarios

By Kyra Clark-Wolf, University of Colorado Boulder; Brian W. Miller, U.S. Geological Survey, and Imtiaz Rangwala, University of Colorado Boulder 

In Sequoia and Kings Canyon National Parks in California, trees that have persisted through rain and shine for thousands of years are now facing multiple threats triggered by a changing climate.

Scientists and park managers once thought giant sequoia forests nearly impervious to stressors like wildfire, drought and pests. Yet, even very large trees are proving vulnerable, particularly when those stressors are amplified by rising temperatures and increasing weather extremes.

The rapid pace of climate change – combined with threats like the spread of invasive species and diseases – can affect ecosystems in ways that defy expectations based on past experiences. As a result, Western forests are transitioning to grasslands or shrublands after unprecedented wildfires. Woody plants are expanding into coastal wetlands. Coral reefs are being lost entirely.

To protect these places, which are valued for their natural beauty and the benefits they provide for recreation, clean water and wildlife, forest and land managers increasingly must anticipate risks they have never seen before. And they must prepare for what those risks will mean for stewardship as ecosystems rapidly transform.

As ecologists and a climate scientist, we’re helping them figure out how to do that.

Thinking through scenarios allows land managers to prepare for many potential outcomes.
Benjamin Slyngstad via USGS

Managing changing ecosystems

Traditional management approaches focus on maintaining or restoring how ecosystems looked and functioned historically.

However, that doesn’t always work when ecosystems are subjected to new and rapidly shifting conditions.

Ecosystems have many moving parts – plants, animals, fungi and microbes; and the soil, air and water in which they live – that interact with one another in complex ways.

When the climate changes, it’s like shifting the ground on which everything rests. The results can undermine the integrity of the system, leading to ecological changes that are hard to predict.

To plan for an uncertain future, natural resource managers need to consider many different ways changes in climate and ecosystems could affect their landscapes. Essentially, what scenarios are possible?

Preparing for multiple possibilities

At Sequoia and Kings Canyon, park managers were aware that climate change posed some big risks to the iconic trees under their care. More than a decade ago, they undertook a major effort to explore different scenarios that could play out in the future.

It’s a good thing they did, because some of the more extreme possibilities they imagined happened sooner than expected.

In 2014, drought in California caused the giant sequoias’ foliage to die back, something never documented before. In 2017, sequoia trees began dying from insect damage. And, in 2020 and 2021, fires burned through sequoia groves, killing thousands of ancient trees.

While these extreme events came as a surprise to many people, thinking through the possibilities ahead of time meant the park managers had already begun to take steps that proved beneficial. One example was prioritizing prescribed burns to remove undergrowth that could fuel hotter, more destructive fires.

The key to effective planning is a thoughtful consideration of a suite of strategies that are likely to succeed in the face of many different changes in climates and ecosystems. That involves thinking through wide-ranging potential outcomes to see how different strategies might fare under each scenario – including preparing for catastrophic possibilities, even those considered unlikely.

For example, prescribed burning may reduce risks from both catastrophic wildfire and drought by reducing the density of plant growth, whereas suppressing all fires could increase those risks in the long run.

Strategies undertaken today have consequences for decades to come. Managers need to have confidence that they are making good investments when they put limited resources toward actions like forest thinning, invasive species control, buying seeds or replanting trees. Scenarios can help inform those investment choices.

Constructing credible scenarios of ecological change to inform this type of planning requires considering the most important unknowns. Scenarios look not only at how the climate could change, but also how complex ecosystems could react and what surprises might lay beyond the horizon.

A chart shows different ecological changes
Scientists at the North Central Climate Adaptation Science Center are collaborating with managers in the Nebraska Sandhills to develop scenarios of future ecological change under different climate conditions, disturbance events like fires and extreme droughts, and land uses like grazing.
Photos: T. Walz, M. Lavin, C. Helzer, O. Richmond, NPS (top to bottom)., CC BY

Key ingredients for crafting ecological scenarios

To provide some guidance to people tasked with managing these landscapes, we brought together a group of experts in ecology, climate science, and natural resource management from across universities and government agencies.

We identified three key ingredients for constructing credible ecological scenarios:

1. Embracing ecological uncertainty: Instead of banking on one “most likely” outcome for ecosystems in a changing climate, managers can better prepare by mapping out multiple possibilities. In Nebraska’s Sandhills, we are exploring how this mostly intact native prairie could transform, with outcomes as divergent as woodlands and open dunes.

2. Thinking in trajectories: It’s helpful to consider not just the outcomes, but also the potential pathways for getting there. Will ecological changes unfold gradually or all at once? By envisioning different pathways through which ecosystems might respond to climate change and other stressors, natural resource managers can identify critical moments where specific actions, such as removing tree seedlings encroaching into grasslands, can steer ecosystems toward a more desirable future.

3. Preparing for surprises: Planning for rare disasters or sudden species collapses helps managers respond nimbly when the unexpected strikes, such as a severe drought leading to widespread erosion. Being prepared for abrupt changes and having contingency plans can mean the difference between quickly helping an ecosystem recover and losing it entirely.

Over the past decade, access to climate model projections through easy-to-use websites has revolutionized resource managers’ ability to explore different scenarios of how the local climate might change.

What managers are missing today is similar access to ecological model projections and tools that can help them anticipate possible changes in ecosystems. To bridge this gap, we believe the scientific community should prioritize developing ecological projections and decision-support tools that can empower managers to plan for ecological uncertainty with greater confidence and foresight.

Ecological scenarios don’t eliminate uncertainty, but they can help to navigate it more effectively by identifying strategic actions to manage forests and other ecosystems.The Conversation

About the Author:

Kyra Clark-Wolf, Research Scientist in Ecological Transformation, University of Colorado Boulder; Brian W. Miller, Research Ecologist, U.S. Geological Survey, and Imtiaz Rangwala, Research Scientist in Climate, Cooperative Institute for Research in Environmental Sciences, University of Colorado Boulder

This article is republished from The Conversation under a Creative Commons license. Read the original article.


Weaponized storytelling: How AI is helping researchers sniff out disinformation campaigns

By Mark Finlayson, Florida International University and Azwad Anjum Islam, Florida International University 

It is not often that cold, hard facts determine what people care most about and what they believe. Instead, it is the power and familiarity of a well-told story that reigns supreme. Whether it’s a heartfelt anecdote, a personal testimony or a meme echoing familiar cultural narratives, stories tend to stick with us, move us and shape our beliefs.

This characteristic of storytelling is precisely what can make it so dangerous when wielded by the wrong hands. For decades, foreign adversaries have used narrative tactics in efforts to manipulate public opinion in the United States. Social media platforms have brought new complexity and amplification to these campaigns. The phenomenon garnered ample public scrutiny after evidence emerged of Russian entities exerting influence over election-related material on Facebook in the lead-up to the 2016 election.

While artificial intelligence is exacerbating the problem, it is at the same time becoming one of the most powerful defenses against such manipulations. Researchers have been using machine learning techniques to analyze disinformation content.

At the Cognition, Narrative and Culture Lab at Florida International University, we are building AI tools to help detect disinformation campaigns that employ tools of narrative persuasion. We are training AI to go beyond surface-level language analysis to understand narrative structures, trace personas and timelines and decode cultural references.

Disinformation vs. misinformation

In July 2024, the Department of Justice disrupted a Kremlin-backed operation that used nearly a thousand fake social media accounts to spread false narratives. These weren’t isolated incidents. They were part of an organized campaign, powered in part by AI.

Disinformation differs crucially from misinformation. While misinformation is simply false or inaccurate information – getting facts wrong – disinformation is intentionally fabricated and shared specifically to mislead and manipulate. A recent illustration of this came in October 2024, when a video purporting to show a Pennsylvania election worker tearing up mail-in ballots marked for Donald Trump swept platforms such as X and Facebook.

Within days, the FBI traced the clip to a Russian influence outfit, but not before it racked up millions of views. This example vividly demonstrates how foreign influence campaigns artificially manufacture and amplify fabricated stories to manipulate U.S. politics and stoke divisions among Americans.

Humans are wired to process the world through stories. From childhood, we grow up hearing stories, telling them and using them to make sense of complex information. Narratives don’t just help people remember – they help us feel. They foster emotional connections and shape our interpretations of social and political events.

Stories have profound effects on human beliefs and behavior.

This makes them especially powerful tools for persuasion – and, consequently, for spreading disinformation. A compelling narrative can override skepticism and sway opinion more effectively than a flood of statistics. For example, a story about rescuing a sea turtle with a plastic straw in its nose often does more to raise concern about plastic pollution than volumes of environmental data.

Usernames, cultural context and narrative time

Using AI tools to piece together a picture of the narrator of a story, the timeline for how they tell it and cultural details specific to where the story takes place can help identify when a story doesn’t add up.

Narratives are not confined to the content users share – they also extend to the personas users construct to tell them. Even a social media handle can carry persuasive signals. We have developed a system that analyzes usernames to infer demographic and identity traits such as name, gender, location, sentiment and even personality, when such cues are embedded in the handle. This work, presented in 2024 at the International Conference on Web and Social Media, highlights how even a brief string of characters can signal how users want to be perceived by their audience.

For example, a user attempting to appear as a credible journalist might choose a handle like @JamesBurnsNYT rather than something more casual like @JimB_NYC. Both may suggest a male user from New York, but one carries the weight of institutional credibility. Disinformation campaigns often exploit these perceptions by crafting handles that mimic authentic voices or affiliations.

Although a handle alone cannot confirm whether an account is genuine, it plays an important role in assessing overall authenticity. By interpreting usernames as part of the broader narrative an account presents, AI systems can better evaluate whether an identity is manufactured to gain trust, blend into a target community or amplify persuasive content. This kind of semantic interpretation contributes to a more holistic approach to disinformation detection – one that considers not just what is said but who appears to be saying it and why.

Also, stories don’t always unfold chronologically. A social media thread might open with a shocking event, flash back to earlier moments and skip over key details in between.

Humans handle this effortlessly – we’re used to fragmented storytelling. But for AI, determining a sequence of events based on a narrative account remains a major challenge.

Our lab is also developing methods for timeline extraction, teaching AI to identify events, understand their sequence and map how they relate to one another, even when a story is told in nonlinear fashion.

Objects and symbols often carry different meanings in different cultures, and without cultural awareness, AI systems risk misinterpreting the narratives they analyze. Foreign adversaries can exploit cultural nuances to craft messages that resonate more deeply with specific audiences, enhancing the persuasive power of disinformation.

Consider the following sentence: “The woman in the white dress was filled with joy.” In a Western context, the phrase evokes a happy image. But in parts of Asia, where white symbolizes mourning or death, it could feel unsettling or even offensive.

In order to use AI to detect disinformation that weaponizes symbols, sentiments and storytelling within targeted communities, it’s critical to give AI this sort of cultural literacy. In our research, we’ve found that training AI on diverse cultural narratives improves its sensitivity to such distinctions.

Who benefits from narrative-aware AI?

Narrative-aware AI tools can help intelligence analysts quickly identify orchestrated influence campaigns or emotionally charged storylines that are spreading unusually fast. They might use AI tools to process large volumes of social media posts in order to map persuasive narrative arcs, identify near-identical storylines and flag coordinated timing of social media activity. Intelligence services could then use countermeasures in real time.

In addition, crisis-response agencies could swiftly identify harmful narratives, such as false emergency claims during natural disasters. Social media platforms could use these tools to efficiently route high-risk content for human review without unnecessary censorship. Researchers and educators could also benefit by tracking how a story evolves across communities, making narrative analysis more rigorous and shareable.

Ordinary users can also benefit from these technologies. The AI tools could flag social media posts in real time as possible disinformation, allowing readers to be skeptical of suspect stories, thus counteracting falsehoods before they take root.

As AI takes on a greater role in monitoring and interpreting online content, its ability to understand storytelling beyond just traditional semantic analysis has become essential. To this end, we are building systems to uncover hidden patterns, decode cultural signals and trace narrative timelines to reveal how disinformation takes hold.The Conversation

About the Author:

Mark Finlayson, Associate Professor of Computer Science, Florida International University and Azwad Anjum Islam, Ph.D. Student in Computing and Information Sciences, Florida International University

This article is republished from The Conversation under a Creative Commons license. Read the original article.


Junior Gold, Silver, or Uranium Stocks

Source: Stewart Thomson (5/28/25)

Newsletter writer Stewart Thomson addresses the question: Should investors own junior gold stocks, junior silver stocks, or junior uranium stocks?

With the U.S. government’s new and righteous backing of nuclear energy (fission for now and ultimately fusion), gold and silver stock enthusiasts may wonder if they should be adding some yellowcake stocks to their portfolios.

First, a bit of background on the CDNX venture market, where most of the world’s junior resource stocks trade. There’s no ETF (one was tried back around the year 2006, but it failed), so investors need to focus on the individual companies.

Here’s a look at the daily chart:

A significant breakout from a broadening pattern is in play and the target is a nice one, at 900. The long-term monthly chart is even more stunning, and here it is:

The target of this massive H&S pattern is at least 1500 and as high as round number 2000.  Given the amount of time that has gone into it, it’s reasonable to expect the CDNX to reach much higher prices, even, perhaps, an all-time high.

Note the key Stochastics oscillator at the bottom of the chart. During regular rallies, an overbought situation is an amber light for investors.

In contrast, when the price is rallying towards a key breakout point, overbought Stochastics adds weight to the upside scenario.

When it comes to yellowcake (uranium) stocks, it’s difficult to find ones with a lot of liquidity on the CDNX. Most of them are on the bigger TSX. The good news is that there are many juniors there too.

Here’s a look at Sprott’s URNJ junior uranium stocks ETF chart:

Investors who are new to the uranium sector should consider starting with the ETF and adding individual stocks from there. Denison Mines Corp. (DML:TSX; DNN:NYSE.MKT) is an experienced uranium player, with a stock price junior investors will like.

Here’s the chart:

Most of the junior uranium stocks look poised for 50%-100% gains. For gold, an interesting play is Cabral Gold Inc. (CBR:TSX.V; CBGZF:OTCMKTS).

Here’s a look at the bio for the company’s no-nonsense president:

The good news is that the chart looks as enticing as the robust management team indicates it could be:

It looks like Michelangelo sculpted it!

The target is at least the highs near 80 cents, and the breakout looks solid.

Silver?

Well, here’s my take on Santacruz Silver Mining Ltd. (SCZ:TSX.V; SCZMF:OTC; 1SZ:FSE):

If I had to pick just one CDNX silver stock to buy right now, well, I couldn’t.

There are many of them leaping up from massive base patterns and that’s just one of many reasons the CDNX index charts look so fantastic!

Special Offer for Streetwise Readers: Please send me an Email to [email protected] and I’ll send you my free “CNDX Ten Baggers: The Time To Buy Is Now!” report. I highlight stocks with breakout gaps, big volume, solid projects, great management, and rock-solid investor tactics to play the action!

I write my junior resource stocks newsletter about twice a week, and at just $199/12mths it’s an investor favourite. I’m doing a special pricing this week of $169 for 14mths.  Click this link or send me an email if you want the offer and I’ll get you onboard. Thank-you.


Important Disclosures:

  1. Stewart Thomson: I, or members of my immediate household or family, own securities of: None. My company has a financial relationship with: None. My company has purchased stocks mentioned in this article for my management clients: None. I determined which companies would be included in this article based on my research and understanding of the sector.
  2. Statements and opinions expressed are the opinions of the author and not of Streetwise Reports, Street Smart, or their officers. The author is wholly responsible for the accuracy of the statements. Streetwise Reports was not paid by the author to publish or syndicate this article. Streetwise Reports requires contributing authors to disclose any shareholdings in, or economic relationships with, companies that they write about. Any disclosures from the author can be found  below. Streetwise Reports relies upon the authors to accurately provide this information and Streetwise Reports has no means of verifying its accuracy.
  3.  This article does not constitute investment advice and is not a solicitation for any investment. Streetwise Reports does not render general or specific investment advice and the information on Streetwise Reports should not be considered a recommendation to buy or sell any security. Each reader is encouraged to consult with his or her personal financial adviser and perform their own comprehensive investment research. By opening this page, each reader accepts and agrees to Streetwise Reports’ terms of use and full legal disclaimer. Streetwise Reports does not endorse or recommend the business, products, services or securities of any company.

For additional disclosures, please click here.

Stewart Thomson Disclosures

Stewart Thomson is no longer an investment advisor. The information provided by Stewart and Graceland Updates is for general information purposes only. Before taking any action on any investment, it is imperative that you consult with multiple properly licensed, experienced and qualified investment advisors and get numerous opinions before taking any action. Your minimum risk on any investment in the world is: 100% loss of all your money. You may be taking or preparing to take leveraged positions in investments and not know it, exposing yourself to unlimited risks. This is highly concerning if you are an investor in any derivatives products. There is an approx $700 trillion OTC Derivatives Iceberg with a tiny portion written off officially. The bottom line:

Are You Prepared?

Can you upload a human mind into a computer? A neuroscientist ponders what’s possible

By Dobromir Rahnev, Georgia Institute of Technology 

Curious Kids is a series for children of all ages. If you have a question you’d like an expert to answer, send it to [email protected].


Is it possible to upload the consciousness of your mind into a computer? – Amreen, age 15, New Delhi, India


The concept, cool yet maybe a little creepy, is known as mind uploading. Think of it as a way to create a copy of your brain, a transmission of your mind and consciousness into a computer. There you would live digitally, perhaps forever. You’d have an awareness of yourself, you’d retain your memories and still feel like you. But you wouldn’t have a body.

Within that simulated environment, you could do anything you do in real life – eating, driving a car, playing sports. You could also do things impossible in the real world, like walking through walls, flying like a bird or traveling to other planets. The only limit is what science can realistically simulate.

Doable? Theoretically, mind uploading should be possible. Still, you may wonder how it could happen. After all, researchers have barely begun to understand the brain.

Yet science has a track record of turning theoretical possibilities into reality. Just because a concept seems terribly, unimaginably difficult doesn’t mean it’s impossible. Consider that science took humankind to the Moon, sequenced the human genome and eradicated smallpox. Those things too were once considered unlikely.

As a brain scientist who studies perception,
I fully expect mind uploading to one day be a reality. But as of today, we’re nowhere close.

Living in a laptop

The brain is often regarded as the most complex object in the known universe. Replicating all that complexity will be extraordinarily difficult.

One requirement: The uploaded brain needs the same inputs it always had. In other words, the external world must be available to it. Even cloistered inside a computer, you would still need a simulation of your senses, a reproduction of the ability to see, hear, smell, touch, feel – as well as move, blink, detect your heart rate, set your circadian rhythm and do thousands of other things.

But why is that? Couldn’t you just exist in a pure mental bubble, inside the computer without sensory input?

Depriving people of their senses, like putting them in total darkness, or in a room without sound, is known as sensory deprivation, and it’s regarded as a form of torture. People who have trouble sensing their bodily signals – thirst, hunger, pain, an itch – often have mental health challenges.

That’s why for mind uploading to work, the simulation of your senses and the digital environment you’re in must be exceptionally accurate. Even minor distortions could have serious mental consequences.

For now, researchers don’t have the computing power, much less the scientific knowledge, to perform such simulations.

New and updated scanning technology is a necessity.

Scanning billions of pinheads

The first task for a successful mind upload: Scanning, then mapping the complete 3D structure of the human brain. This requires the equivalent of an extraordinarily sophisticated MRI machine that could detail the brain in an advanced way. At the moment, scientists are only at the very early stages of brain mapping – which includes the entire brain of a fly and tiny portions of a mouse brain.

In a few decades, a complete map of the human brain may be possible. Yet even capturing the identities of all 86 billion neurons, all smaller than a pinhead, plus their trillions of connections, still isn’t enough. Uploading this information by itself into a computer won’t accomplish much. That’s because each neuron constantly adjusts its functioning, and that has to be modeled, too.

It’s hard to know how many levels down researchers must go to make the simulated brain work. Is it enough to stop at the molecular level? Right now, no one knows.

Technological immortality comes with significant ethical concerns.

2045? 2145? Or later?

Knowing how the brain computes things might provide a shortcut. That would let researchers simulate only the essential parts of the brain, and not all biological idiosyncrasies. It’s easier to manufacture a new car knowing how a car works, compared to attempting to scan and replicate an existing car without any knowledge of its inner workings.

However, this approach requires that scientists figure out how the brain creates thoughts – how collections of thousands to millions of neurons come together to perform the computations that make the human mind come alive. It’s hard to express how very far we are from this.

Here’s another way: Replace the 86 billion real neurons with artificial ones, one at a time. That approach would make mind uploading much easier. Right now, though, scientists can’t replace even a single real neuron with an artificial one.

But keep in mind the pace of technology is accelerating exponentially. It’s reasonable to expect spectacular improvements in computing power and artificial intelligence in the coming decades.

One other thing is certain: Mind uploading will certainly have no problem finding funding. Many billionaires appear glad to part with lots of their money for a shot at living forever.

Although the challenges are enormous and the path forward uncertain, I believe that one day, mind uploading will be a reality. The most optimistic forecasts pinpoint the year 2045, only 20 years from now. Others say the end of this century.

But in my mind, both of these predictions are probably too optimistic. I would be shocked if mind uploading works in the next 100 years. But it might happen in 200 – which means the first person to live forever could be born in your lifetime.


Hello, curious kids! Do you have a question you’d like an expert to answer? Ask an adult to send your question to [email protected]. Please tell us your name, age and the city where you live.

And since curiosity has no age limit – adults, let us know what you’re wondering, too. We won’t be able to answer every question, but we will do our best.The Conversation

Dobromir Rahnev, Associate Professor of Psychology, Georgia Institute of Technology

This article is republished from The Conversation under a Creative Commons license. Read the original article.

The US Court of International Trade ruled Trump’s tariffs illegal. The Bank of Mexico will extend its cycle of rate cuts

By JustMarkets

At the end of Wednesday, the Dow Jones Index (US30) fell by 0.56%. The S&P 500 Index (US500) fell by 0.58%. The Nasdaq technology Index (US100) closed down 0.51%. Stocks fell amid President Trump’s expansion of restrictions on chip software supplies to China.

According to the Fed, the announced tariff increase was much more significant and extensive than expected, and they noted considerable uncertainty regarding the direction of trade policy, as well as the magnitude, scale, timing, and duration of its economic consequences, according to the minutes of the May FOMC meeting. Policymakers viewed this uncertainty as unusually high and believed that the risks of a decline in employment and economic activity, as well as the risks of higher inflation, had increased. In May 2025, the Federal Reserve kept its benchmark interest rate at 4.25-4.50% for the third consecutive meeting, in line with expectations.

The US Court of International Trade ruled that the tariffs were illegal and ordered them to be repealed and permanently blocked, dealing a significant blow to the president’s economic agenda. The White House is expected to appeal the decision.

Nvidia reported better-than-expected first-quarter results on Wednesday, but the chipmaker warned of an $8 billion negative impact on its second-quarter expectations due to the US ban on chip sales to China. Nvidia (NVDA) shares rose more than 2% after the close of trading on the back of the report.

The Mexican peso (MXN) fell to 19.4 per US dollar from an eight-month high of 19.2 reached on May 23, under pressure from some strengthening of the dollar and the Bank of Mexico’s dovish expectations. At the same time, expectations that the Bank of Mexico will extend its cycle of rate cuts this year prevailed after the latest core inflation figures matched expectations. The Bank of Mexico has made three consecutive 50 bps rate cuts in the current cycle, lowering its benchmark rate to 8.5%.

European stock markets were mostly lower on Wednesday. Germany’s DAX (DE40) fell by 0.78%, France’s CAC 40 (FR40) closed down 0.49%, and Spain’s IBEX35 (ES35) lost 0. 98%, and the British FTSE 100 (UK100) closed down 0.59%. Median inflation expectations in the Eurozone rose for the second month in a row to 3.1% in April 2025, the highest since February 2024, compared to 2.9% in March. Uncertainty about inflation expectations for the next 12 months also increased, reaching the same level as in June 2024. At the same time, inflation expectations for the next three years remained unchanged at 2.5%.

WTI crude oil futures rose to around $62.6 per barrel, marking the second consecutive session of growth, helped by lower tariff risks and prospects for reduced supply. On Wednesday, the US Court of International Trade ruled that President Trump had exceeded his authority in imposing global tariffs, declaring them illegal and ordering them to be rescinded. Although the administration is expected to appeal, the ruling helped reduce trade uncertainty and improved the outlook for global oil demand.

The US natural gas prices rose to $3.40/MMBtu, the highest level in a week, thanks to lower production, rising demand, and expectations for hotter weather. Looking ahead, LNG supplies are expected to remain below April’s peak.

Asian markets were mostly down yesterday. Japan’s Nikkei 225 (JP225) fell by 0.01%, China’s FTSE China A50 (CHA50) dropped 0.03%, Hong Kong’s Hang Seng (HK50) lost 0. 53%, and Australia’s ASX 200 (AU200) showed a negative result of 0.13%. Hong Kong stocks rose to 23,360 at the start of trading on Thursday, recovering from the previous session’s decline. The growth was almost universal, led by technology, consumer, and financial companies. Sentiment improved after a strong rally in US futures after a federal court blocked President Donald Trump’s tariffs imposed on “Liberation Day”.

New Zealand’s ANZ Business Outlook Index fell sharply to 36.6 in May 2025 from 49.3 the previous month, reaching its lowest level since July 2024. The decline is the third consecutive month amid growing concerns about the impact of rising US tariffs.

S&P 500 (US500) 5,888.55 −32.99 (−0.56%)

Dow Jones (US30) 42,098.70 −244.95 (−0.58%)

DAX (DE40) 24,038.19 −188.30 (−0.78%)

FTSE 100 (UK100) 8,726.01 −52.04 (−0.59%)

USD Index 99.87 +0.35 (+0.35%)

News feed for: 2025.05.29

  • New Zealand ANZ Business Confidence (m/m) at 04:00 (GMT+3);
  • Japan Consumer Confidence (m/m) at 08:00 (GMT+3);
  • US Initial Jobless Claims (w/w) at 15:30 (GMT+3);
  • US GDP (q/q) at 15:30 (GMT+3);
  • US Pending Home Sales (m/m) at 17:00 (GMT+3);
  • US Natural Gas Storage (w/w) at 17:30 (GMT+3);
  • US Crude Oil Reserves (w/w) at 18:00 (GMT+3);
  • UK BOE Gov Bailey Speaks at 22:00 (GMT+3).

By JustMarkets


This article reflects a personal opinion and should not be interpreted as an investment advice, and/or offer, and/or a persistent request for carrying out financial transactions, and/or a guarantee, and/or a forecast of future events.

NASDAQ Listing for Crypto Co. a Milestone

Source: Mark Palmer (5/27/25)

The upgrade from the OTC should afford this growing fintech various benefits, including greater visibility, noted a Benchmark report.

DeFi Technologies Inc. (DEFT:NASDAQ; DEFI:CBOE; R9B:FSE) received approval to list its common shares on the NASDAQ starting today, under the symbol DEFT, reported Benchmark Analyst Mark Palmer in a May 12 research note. Benchmark increased its target price on the fintech firm on expected growth in 2025.

“We believe DeFi’s uplisting to the NASDAQ is likely to result in significantly increased liquidity for the stock, broader institutional ownership and sell-side coverage of its shares and a lower overall cost of capital for the company,” Palmer wrote.

DeFi, offering exposure to a differentiated portfolio of cryptocurrencies, no longer will trade on the OTC. It will, however, continue on the CBOE in Canada (symbol DEFI), where it has traded since September 2016, and on the Frankfurt Stock Exchange (symbol R9B).

Target Price Raised

Benchmark raised its target price on the digital assets firm to CA$8 per share from CA$5 based on 15x its forecasted full-year 2025 earnings per share (EPS) of CA$0.53, noted Palmer.

“Our bullish stance toward DeFi’s shares is rooted in our confidence that it will be able to execute on its aggressive growth plans during the balance of the year and beyond,” wrote the analyst.

Those include adding at least 40 new crypto-focused exchange-traded products (ETPs) by year-end, taking the total count to more than 100. Plans also include expansion in the U.K., Africa, Asia, and the Middle East, toward which the company has been working.

DeFi announced in its last monthly update that it increased its assets under management (AUM) in April to CA$988 (CA$988M), reflecting an 11.7% month-over-month increase. This is attributed to rising crypto prices and CA$10.8M of net inflows into DeFi’s ETPs. In other growth news, the DeFi Alpha trading desk closed a CA$30.5M arbitrage trade on May 5.

Stock Undervalued, 44% Uplift

DeFi was trading, at the time of Palmer’s report, at CA$5.55 per share, the analyst noted. While this level is consistent with the fintech’s growth prospects, it is at a steep discount to other crypto-related stocks, including Coinbase Global Inc. (COIN:NASDAQ), Robinhood Markets Inc. (HOOD:NASDAQ) and Galaxy Digital Holdings Ltd. (GXLY:TSX).

From this share price, the return to target is 44%. DeFi is a Buy.

Changes to Estimates

Palmer reported that Benchmark tweaked its estimates for DeFi to account for its progress as well as the recent uptick in crypto prices. For Q1/25, estimated revenue was reduced to CA$27M from CA$52.7M and estimate earnings per share was lowered to CA$0.06 from CA$0.09.

Q2/25 EPS was raised to CA$0.16 from CA$0.10 to reflect DeFi Alpha’s May 5 arbitrage trade.

More Stock Details

Palmer reported that on May 12, DeFi had 298 million shares outstanding, a market cap of CA$1.2 billion and a 52-week range of CA$0.75–5.56 per share.


Important Disclosures:

  1. Doresa Banning wrote this article for Streetwise Reports LLC and provides services to Streetwise Reports as an independent contractor.
  2.  This article does not constitute investment advice and is not a solicitation for any investment. Streetwise Reports does not render general or specific investment advice and the information on Streetwise Reports should not be considered a recommendation to buy or sell any security. Each reader is encouraged to consult with his or her personal financial adviser and perform their own comprehensive investment research. By opening this page, each reader accepts and agrees to Streetwise Reports’ terms of use and full legal disclaimer. Streetwise Reports does not endorse or recommend the business, products, services or securities of any company.

For additional disclosures, please click here.

Disclosures for Benchmark Equity Research, DeFi Technologies Inc., May 12, 2025

alyst Certification The Benchmark Company, LLC (“Benchmark”) analyst(s) whose name(s) appears on the front page of this research report certifies that the recommendations and opinions expressed herein accurately reflect the research analyst’s personal views about any and all of the subject securities or issues discussed herein. Furthermore, no part of the research analyst’s compensation was, is, or will be, directly or indirectly, related to the specific recommendations or views expressed by the research analyst(s) in this research report.

Equity Research Ratings System Firm-Wide Stock Ratings Distribution As of March 31, 2025 All Covered Companies Investment Banking Clients Buy 266 73.7% 57 15.8% Hold 73 20.2% 5 1.4% Speculative Buy 20 5.5% 11 3.0% Sell 2 0.6% 0 0.0% Company Ratings Buy: Stock is expected to outperform the analyst’s defined Sector/Industry Index* over the following 6 to 12 months. Speculative Buy: The stock has a market value below $100M and/or a higher financial risk profile. It is expected to outperform the analyst’s defined sector/industry index over the following 6 to 12 months. Hold: Stock is expected to perform in-line with the analyst’s defined Sector/Industry Index* over the following 6 to 12 months. Sell: Stock is expected to underperform the analyst’s defined Sector/Industry Index* over the following 6 to 12 months. Industry Ratings Overweight: Analyst’s defined Sector/Industry Index* is expected to outperform the S&P 500 over the following 6 to 12 months. Market Weight: Analyst’s defined Sector/Industry Index* is expected to perform in-line with the S&P 500 over the following 6 to 12 months. Underweight: Analyst’s defined Sector/Industry Index* is expected to underperform the S&P 500 over the following 6 to 12 months. Benchmark Disclosures as of May 12, 2025 Company Disclosure DeFi Technologies Inc Research Disclosure Legend 1. In the past 12 months, Benchmark and its affiliates have received compensation for investment banking services from the subject company. 2. In the past 12 months, Benchmark and its affiliates have managed or comanaged a public offering of securities for the subject company. 3. Benchmark and its affiliates expect to receive or intend to seek compensation for investment banking services from the subject company in the next three months. 4. The research analyst, a member of the research analyst’s household, any associate of the research analyst, or any individual directly involved in the preparation of this report has a long position in the shares or derivatives of the subject company. 5. The research analyst, a member of the research analyst’s household, any associate of the research analyst, or any individual directly involved in preparation of this report has a short position in the shares or derivatives of this subject company. 6. A member of the research analyst’s household serves as an officer, director or advisory board member of the subject company. 7. As of the month end immediately preceding the date of publication of this report, or the prior month end if publication is within 10 days following a month end, Benchmark and its affiliates, in the aggregate, beneficially owned 1% or more of any class of equity securities of the subject company. 8. A partner, director, officer, employee or agent of Benchmark, or a member of his/her household, is an officer, director or advisor, board member of the subject company and/or one of its subsidiaries. 9. Benchmark makes a market in the securities of the subject company. 10. In the past 12 months, Benchmark, its partners, affiliates, officers or directors, or any analyst involved in the preparation of this report, has provided non-investment banking securities-related services to the subject company for remuneration. 11. In the past 12 months, Benchmark, its partners, affiliates, officers or directors, or any analyst involved in the preparation of this report, has provided non-securities related services to the subject company for remuneration. Investment Risk Risks to our investment thesis include crypto market volatility, regulatory risk, changing investor sentiment resulting in reduced ETP flows, and liquidity risk. Valuation Methodology Our C$8.00 price target for DEFI is based on 15x the company’s FY25E diluted earnings per share of C$0.53. We believe the multiple we have used reflects DEFI’s ample growth prospects. Price Charts Benchmark’s disclosure price charts are updated within the first fifteen days of each new calendar quarter per FINRA regulations. Price charts for companies initiated upon in the current quarter, and rating and target price changes occurring in the current quarter, will not be displayed until the following quarter. Additional information on recommended securities is available on request.

General Disclosures The Benchmark Company, LLC. (“Benchmark” or “the Firm”) compensates research analysts, like other Firm employees, based on the Firm’s overall revenue and profitability, which includes revenues from the Firm’s institutional sales, trading, and investment banking departments. No portion of the analyst’s compensation is based on a specific banking transaction. Analyst compensation is based upon a variety of factors, including the quality of analysis, performance of recommendations and overall service to the Firm’s institutional clients. This publication does not constitute an offer or solicitation of any transaction in any securities referred to herein. Ratings that use the “Speculative” risk qualifier are considered higher risk. Any recommendation contained herein may not be suitable for all investors. The Benchmark Company, LLC makes every effort to use reliable, comprehensive information, but we make no representation that it is accurate or complete. We have no obligation to disclose when information in this report changes apart from when we intend to discontinue research coverage of a subject company. Although the information contained in the subject report has been obtained from sources, we believe to be reliable, its accuracy and completeness cannot be guaranteed. This publication and any recommendation contained herein speak only as of the date hereof and are subject to change without notice. The Benchmark Company, LLC and its affiliated companies and employees shall have no obligation to update or amend any information herein. This publication is being furnished to you for informational purposes only and on the condition that it will not form a primary basis for any investment decision. Each investor must make its own determination of the appropriateness of an investment in any securities referred to herein based on the legal, tax and accounting considerations applicable to such investor and its own investment strategy. By virtue of this publication, none of The Benchmark Company, LLC or any of its employees shall be responsible for any investment decision. This report may discuss numerous securities, some of which may not be qualified for sale in certain states and may therefore not be offered to investors in such states. The “Recent Price” stated on the cover page reflects the nearest closing price prior to the date of publication. For additional disclosure information regarding the companies in this report, please contact The Benchmark Company, LLC, 150 East 58th Street, New York, NY 10155, 212-312-6770. The Benchmark Company, LLC is not in any way affiliated with or endorsed by the Menlo Park, California venture capital firm Benchmark Capital.

EUR/USD Extends Losses for Third Consecutive Day

By RoboForex Analytical Department 

The euro/dollar pair continues to decline on Thursday, edging closer to 1.1256 as the US dollar strengthens for a third straight session. This development follows a US federal court ruling that former President Donald Trump overstepped his authority by imposing retaliatory tariffs.

Key factors driving EUR/USD movement

The US Court of International Trade ruled that the tariffs were unlawful not only for the five companies that brought the lawsuit but also for all parties. The court ordered the immediate and permanent revocation of these tariffs, although the Trump administration is expected to appeal the decision.

Meanwhile, investors are closely monitoring debates in the US Senate over Trump’s expansive tax and budget bill, which is likely to face substantial amendments in the upper chamber.

Yesterday’s release of the Federal Reserve meeting minutes revealed a cautious, wait-and-see stance among officials. Policymakers are evaluating the economic repercussions of recent government measures and the ongoing tariff dispute, with noted concerns over rising inflation and unemployment risks.

Thursday’s market focus will shift to key economic data, including the second estimate of US Q1 GDP and the weekly US jobless claims report.

Technical analysis: EUR/USD

H4 Chart:

  • The pair formed a consolidation range around 1.1313 before breaking downward to 1.1210
  • A technical retracement to 1.1313 (testing from below) is anticipated today
  • If the price breaks downward from this range, the downtrend could extend towards 1.1080
  • Conversely, an upward breakout may signal a corrective move towards 1.1485
  • The MACD indicator supports this outlook, with its signal line below zero and pointing sharply downward.

H1 Chart:

  • The market completed a downward wave to 1.1313, followed by consolidation and a further drop to 1.1210 in a double-wave extension structure
  • Today, a potential upside wave to 1.1260 is in play, with a possible continuation towards 1.1313
  • The Stochastic oscillator aligns with this scenario, with its signal line above 50 and rising towards 80


Conclusion

The EUR/USD remains under pressure amid dollar strength and political uncertainty, with technical indicators suggesting further downside potential unless a corrective rebound materialises.


Disclaimer

Any forecasts contained herein are based on the author’s particular opinion. This analysis may not be treated as trading advice. RoboForex bears no responsibility for trading results based on trading recommendations and reviews contained herein.