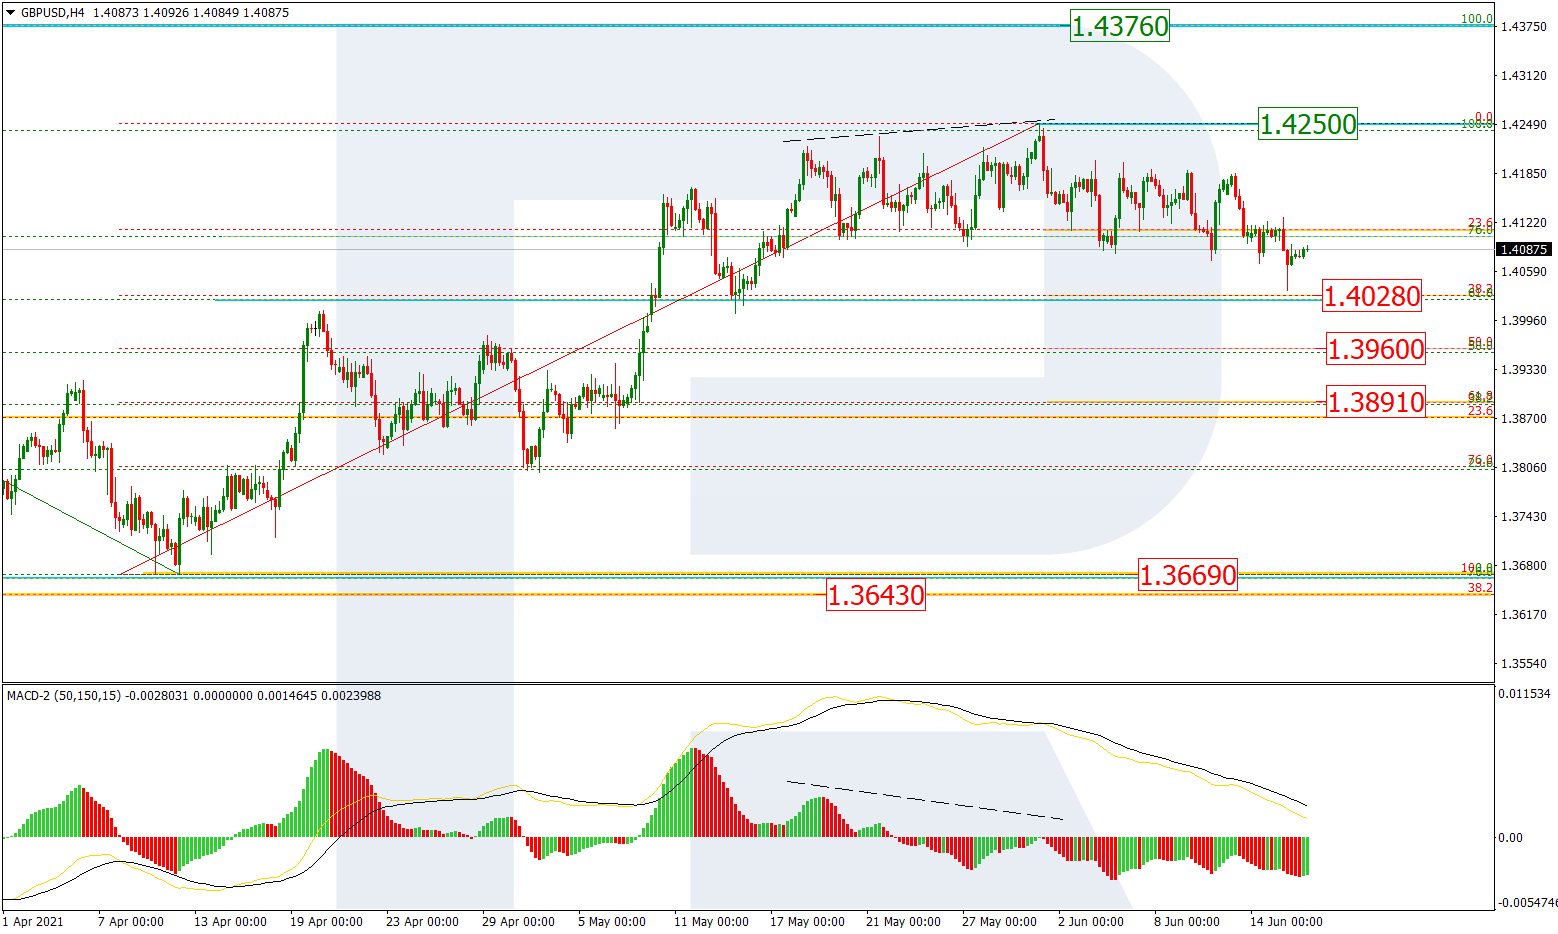
As we can see in the H4 chart, the asset is finishing the correctional decline at 38.2% fibo (1.4028) and may later start a new growth towards the local high at 1.4250, a breakout of which may lead to a further uptrend towards the long-term high at 1.4376. However, as long as the pair is moving below the high, there might be another scenario, which implies one more descending impulse to reach 50.0% and 61.8% fibo at 1.3960 and 1.3891 respectively.
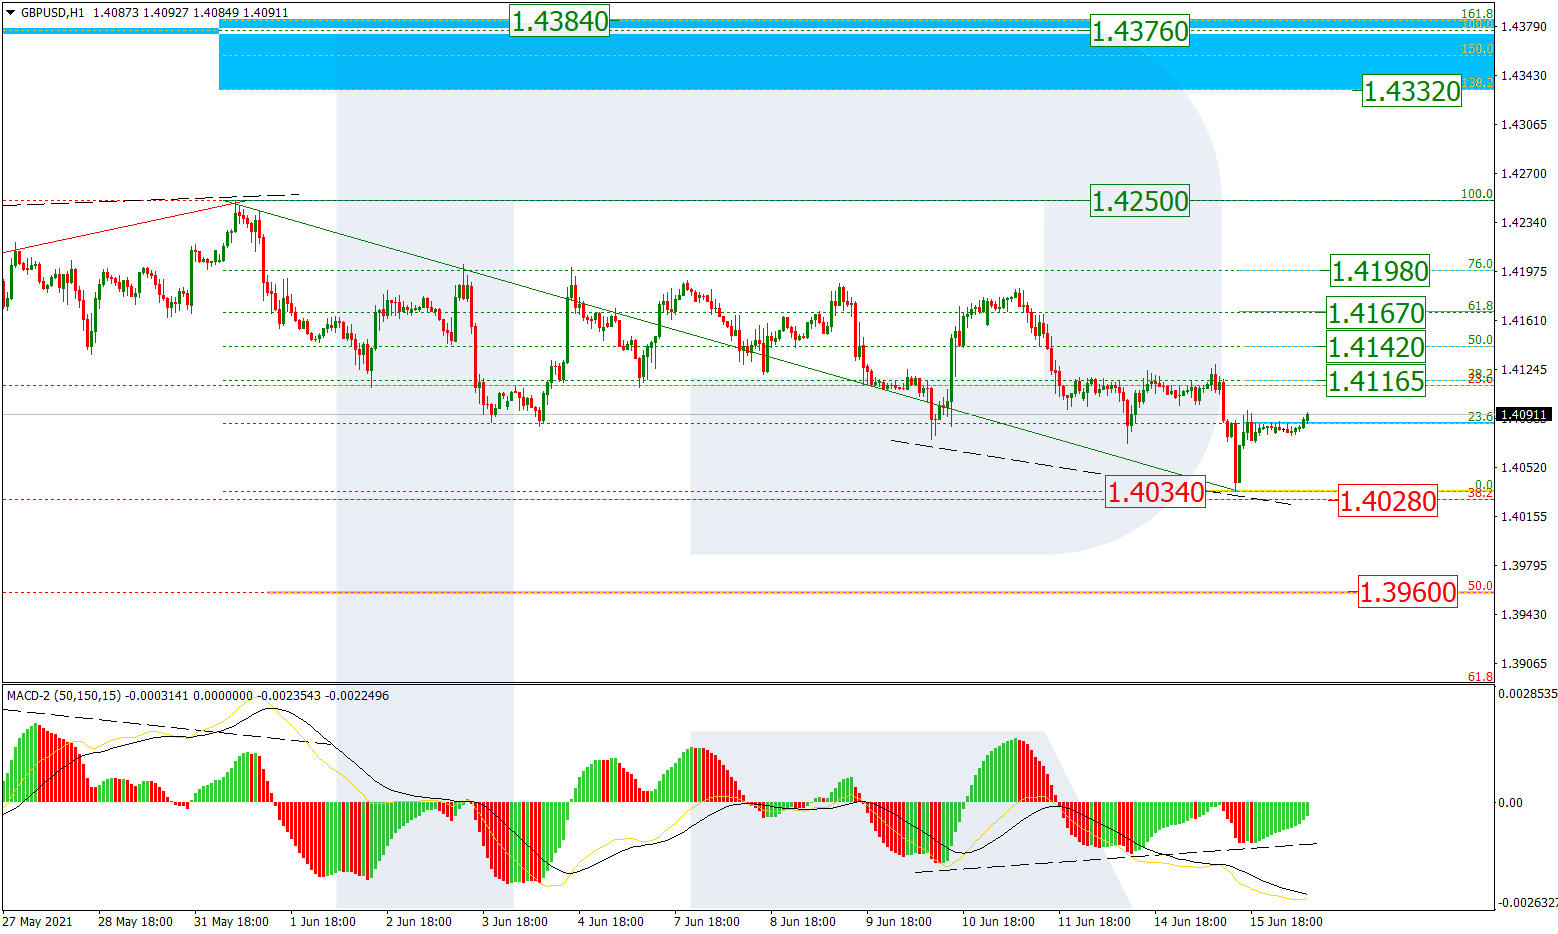
In the H1 chart, GBPUSD is growing after a convergence on MACD and has already reached 23.6% fibo. Later, the price may continue moving upwards to reach 38.2%, 50.0%, 61.8%, and 76.0% fibo at 1.4116, 1.4142. 1.4167. and 1.4198 respectively. However, the key upside target is the high at 1.4250, a breakout of which may lead to a further uptrend towards the post-correctional extension area between 138.2% and 161.8% fibo at 1.4332 and 1.4384 respectively. The support is the local low at 1.4034.
EURJPY, “Euro vs. Japanese Yen”
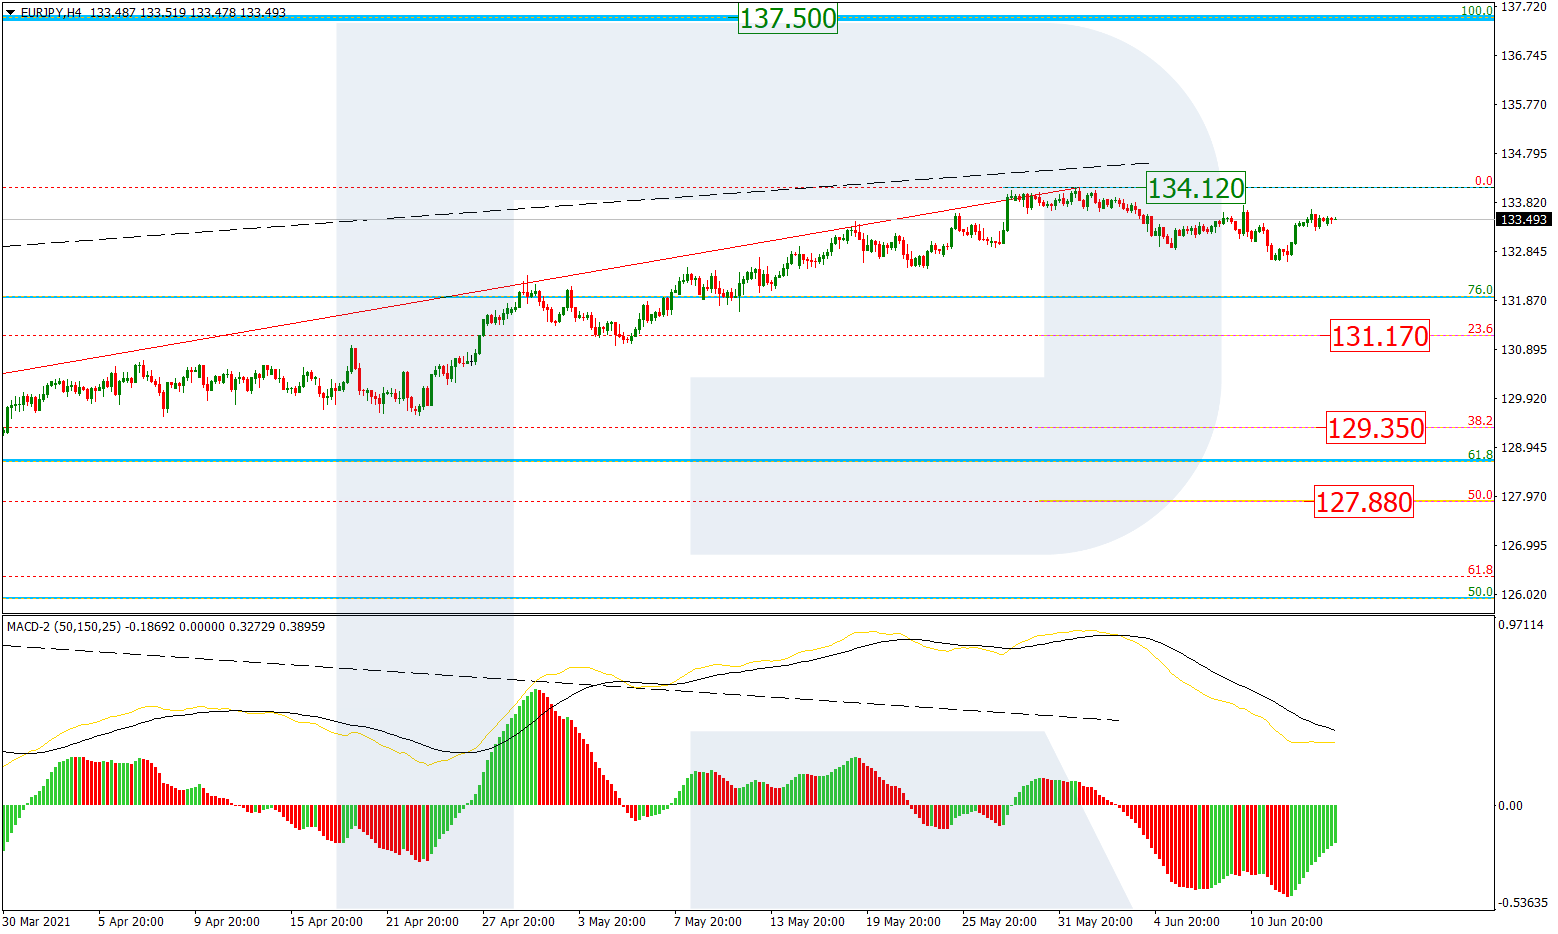
In the H4 chart, the situation hasn’t changed much; however, the decline was rather weak and couldn’t even reach 23.6% fibo at 131.17. Still, as long as the price is moving below the high, there might be another scenario, which implies a new descending wave towards 38.2% and 50.0% fibo at 129.35 and 127.88 respectively. At the same time, a breakout of the current high at 134.12 will complete the correction and lead to a further uptrend towards the key high at 137.50.
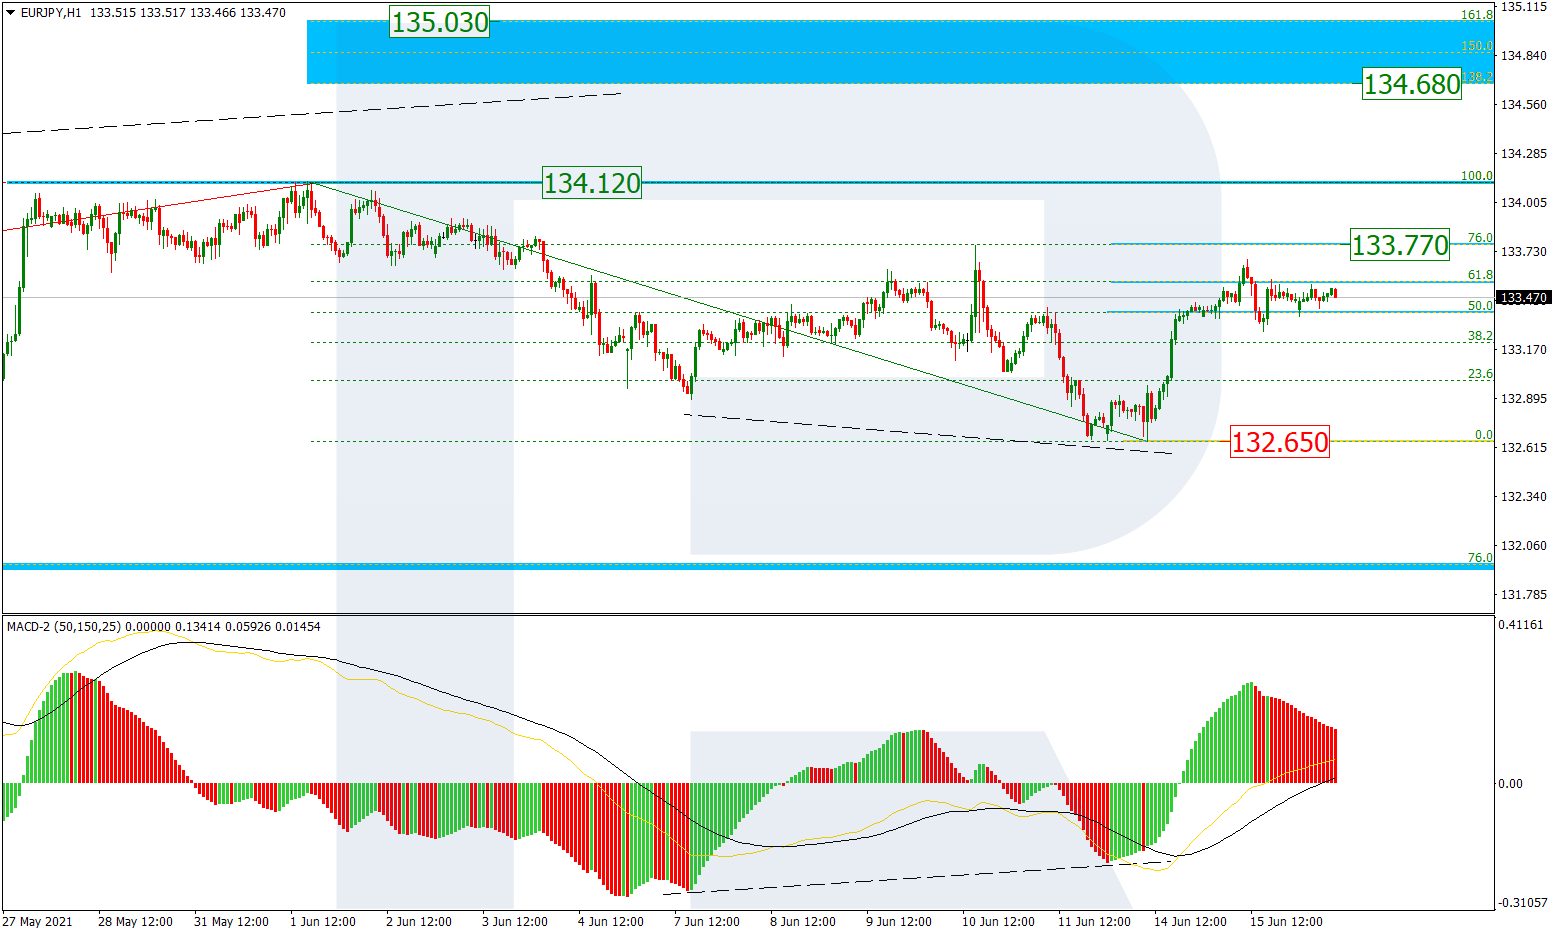
As we can see in the H1 chart, the asset is trading upwards after a convergence on MACD. It has already reached 61.8% fibo and may later continue growing towards 76.0% fibo and the high at 133.77 and 134.12 respectively, a breakout of which will lead to a further uptrend to reach the post-correctional extension area between 138.2% and 161.8% fibo at 134.68 and 135.03 respectively. The support is the low at 132.65.
Attention! Forecasts presented in this section only reflect the author’s private opinion and should not be considered as guidance for trading. RoboForex LP bears no responsibility for trading results based on trading recommendations described in these analytical reviews.
AAPL is forming a large wave a, of a cycle degree, which takes the form of a ①-②-③-④-⑤ impulse.
The bearish correction wave ④ is currently under construction. It could take the form of an intermediate double (W)-(X)-(Y) zigzag. Perhaps the market has already started to build a minor wave C, which can complete the wave (Y) near 110.04.
At that level, correction wave ④ will be at 38.2% of primary impulse ③.
After that, the market can turn around and start moving up in the final wave ⑤. This is well above the level of 145.30, which is at the third wave of the primary degree.
Alternatively, we see the completed wave ④ in the form of an intermediate simple zigzag.
It is assumed that in the first half of March, the market started to build the initial part of the primary fifth wave. This could take the form of an ending diagonal (1)-(2)-(3)-(4)-(5) of the intermediate degree.
In the coming trading weeks, we could expect a gradual increase in the intermediate sub-waves (3)-(4)-(5), to the 162.27 area. At that level, wave ⑤ will be at the 50% Fibonacci extension of the third wave.
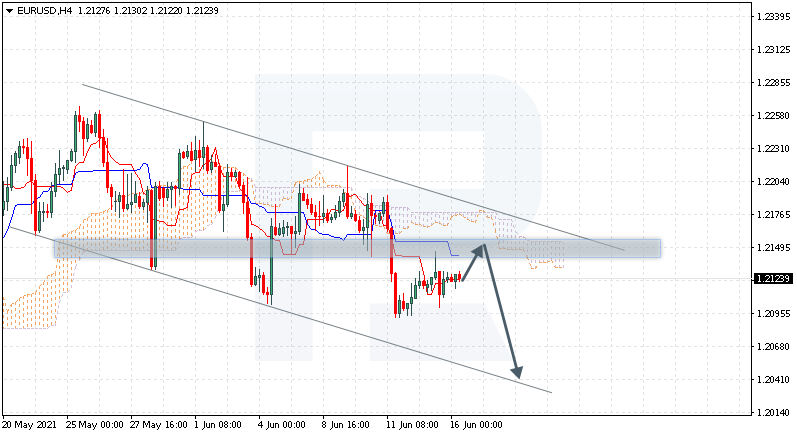
EURUSD is trading at 1.2123; the instrument is moving below Ichimoku Cloud, thus indicating a descending tendency. The markets could indicate that the price may test Tenkan-Sen and Kijun-Sen at 1.2150 and then resume moving downwards to reach 1.2040. Another signal in favor of a further downtrend will be a rebound from the resistance level. However, the bearish scenario may be canceled if the price breaks the cloud’s upside border and fixes above 1.2205. In this case, the pair may continue growing towards 1.2295.
USDCAD, “US Dollar vs Canadian Dollar”
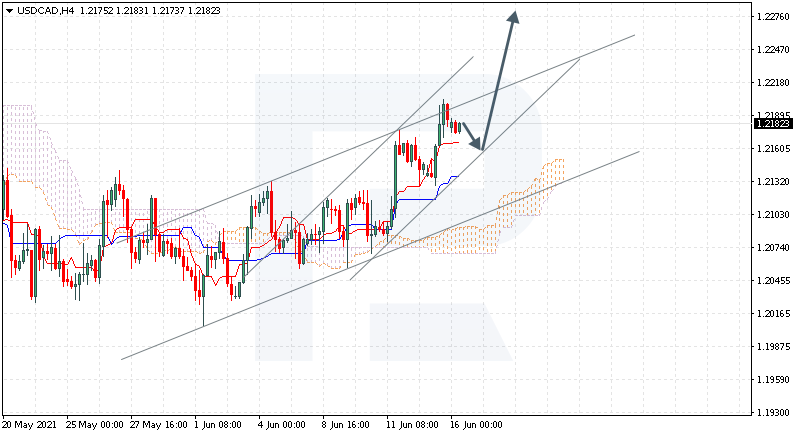
USDCAD is trading at 1.2182; the instrument is moving above Ichimoku Cloud, thus indicating an ascending tendency. The markets could indicate that the price may test Tenkan-Sen and Kijun-Sen at 1.2160 and then resume moving upwards to reach 1.2275. Another signal in favor of a further uptrend will be a rebound from the rising channel’s downside border. However, the bullish scenario may no longer be valid if the price breaks the cloud’s downside border and fixes below 1.2035. In this case, the pair may continue falling towards 1.1945. To confirm further growth, the asset must break the rising channel’s upside border and fix above 1.2225.
NZDUSD, “New Zealand Dollar vs US Dollar”
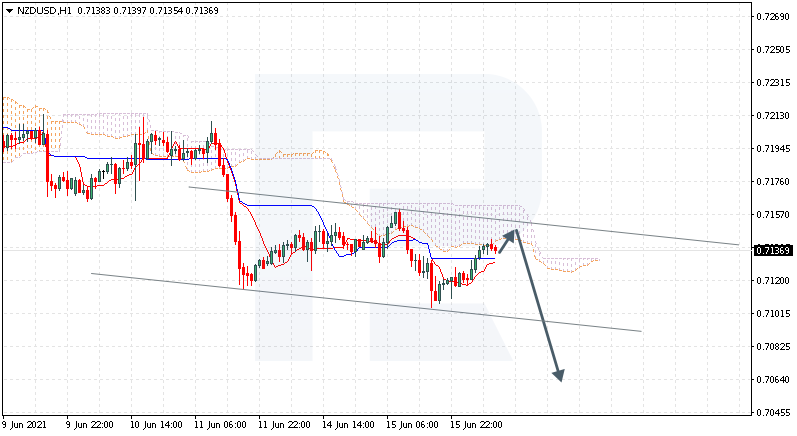
NZDUSD is trading at 0.7136; the instrument is moving below Ichimoku Cloud, thus indicating a descending tendency. The markets could indicate that the price may test the cloud’s downside border at 0.7145 and then resume moving downwards to reach 0.7065. Another signal in favor of a further downtrend will be a rebound from the descending channel’s upside border. However, the bearish scenario may be canceled if the price breaks the cloud’s upside border and fixes above 0.7185. In this case, the pair may continue growing towards 0.7295.
Attention! Forecasts presented in this section only reflect the author’s private opinion and should not be considered as guidance for trading. RoboForex LP bears no responsibility for trading results based on trading recommendations described in these analytical reviews.
The EUR/USD currency pair continues to trade in a narrow flat. Now the price is slowly moving up to the moving average line. So, most likely, there will be no significant volatility before the Fed meeting. Analysts are confident that euro quotes will rise after the meeting, as there are no fundamental reasons for the price to fall.
Trading recommendations
Support levels: 1.2114, 1.2085, 1.2026, 1.2002, 1.1957
The sellers’ pressure remains high, while the buyers are very weak. The MACD indicator is inactive. The best strategy for traders is to look for sell trades from resistance levels. But considering the deviation from the middle line, it is also possible to look for buy trades from the support levels. Though, it is better to buy on intraday timeframes.
Alternative scenario: if the price breaks out through the 1.2212 resistance level and fixes above, the general uptrend is likely to resume.
News feed for 2021.06.16:
– US Building Permits (m/m) at 15:30 (GMT+3);
– US FOMC Meeting Minutes Release at 21:00 (GMT+3);
– US FOMC Statement at 21:00 (GMT+3);
– US Fed Interest Rate Decision at 21:00 (GMT+3);
– US FOMC Press Conference at 21:30 (GMT+3).
The GBP/USD currency pair
Technical indicators of the currency pair:
Prev Open: 1.4108
Prev Close: 1.4083
% chg. over the last day: -0.18%
Yesterday, the GBP/USD currency pair unexpectedly fell below the priority change level of 1.4075 but failed to consolidate there. By the end of the trading session, the buyers quickly brought the price back above the level. The trigger for the sell-off was the postponement of the opening of the economy to the next month. The situation on GBP/USD becomes contradictory, as the fundamental picture for the British currency in the medium term is positive.
Trading recommendations
Support levels: 1.4075, 1.3996, 1.3913,1.3835, 1.3801, 1.3756, 1.3690
Resistance levels: 1.4110, 1.4191, 1.4212, 1.4338
The GBP/USD currency pair trend remains bullish, as the price is above the priority change level. But traders should pay attention to the sellers’ pressure. At the moment, the price is trading below the moving average. The MACD indicator is signaling a divergence. The price is right at the support level, so under such market conditions, traders are better to look for buy trades. Sell positions can also be considered, but from resistance levels and with short targets.
Alternative scenario: if the price breaks down through the 1.4075 support level and consolidates below, the bullish scenario is likely to be canceled.
News feed for 2021.06.16:
– UK Consumer Price Index (m/m, y/y) at 09:00 (GMT+3);
– US FOMC Meeting Minutes Release at 21:00 (GMT+3).
The USD/JPY currency pair
Technical indicators of the currency pair:
Prev Open: 110.05
Prev Close: 110.04
% chg. over the last day: -0.01%
The USD/JPY currency pair formed a narrow flat right at the resistance level. As a rule, such behavior of the price occurs before the breakout. But considering that the Japanese currency is highly correlated with the dollar index, the outcome will depend on the Fed meeting.
Trading recommendations
Support levels: 109.83, 109.63, 109.35, 109.18, 108.66, 108.44, 108.19, 107.77
Resistance levels: 110.09 110.51, 110.73
Technically, the mid-term trend is bullish as the price is above the priority change level of 109.18. Now the price has reached the resistance level, and the MACD indicator is signaling a weak divergence. Considering the strong deviation from the moving average, there is a high probability of a small corrective move down. Traders can look for both buy trades from the nearest support levels after the correction as well as sell trades from resistance levels on intraday timeframes.
Alternative scenario: if the price falls below 109.18, the general downtrend is likely to resume.
News feed for 2021.06.16:
– US FOMC Meeting Minutes Release at 21:00 (GMT+3).
The USD/CAD currency pair
Technical indicators of the currency pair:
Prev Open: 1.2138
Prev Close: 1.2185
% chg. over the last day: +0.39%
The USD/CAD currency pair continues to rise. The quotes of the Canadian dollar are highly correlated with the American dollar index now, so a lot will depend on what Jerome Powell will say today at the FOMC press conference.
Trading recommendations
Support levels: 1.2148, 1.2119, 1,2096 1.2060, 1.2032, 1.1944
Technically, the trend remains bullish. The price is trading above the moving average, but the MACD indicator signals a weak divergence. Under such market conditions, traders can look for buy trades from support levels after a small downward correction is completed.
Alternative scenario: if the price breaks down through the 1.2060 support level and fixes below, the downtrend is likely to be resumed.
News feed for 2021.06.16:
– Canada Consumer Price Index (m/m) at 15:30 (GMT+3);
– Canada Core CPI (m/m) at 15:30 (GMT+3);
– US FOMC Meeting Minutes Release at 21:00 (GMT+3).
This article reflects a personal opinion and should not be interpreted as an investment advice, and/or offer, and/or a persistent request for carrying out financial transactions, and/or a guarantee, and/or a forecast of future events.
Chris Vermeulen, the founder and chief market strategist of TheTechnicalTraders.com, talks with Patrick Vierra on Metal Money to discuss how the bullish triangle pattern in silver now mirrors 2009 before the breakout to the 2011 silver price peak.
CLICK ON THE IMAGE BELOW TO WATCH THE INTERVIEW
GET YOUR DAILY DOSE OF CHRIS’S SILVER AND GOLD ANALYSIS ALONG WITH THE HOTTEST ETFS TO TRADE WITH BAN TRADER PRO!
The US stock market closed with a decrease at the end of the day. The technology sector, as well as the consumer goods sector, became the leaders of the decline. Note that these sectors were the leaders 2 days ago. It proves that distribution of funds between sectors is carried out in a planned way, when some sectors are growing and others are falling down, and after a few days the picture is the opposite. And more than half of the deals are carried out by trading algorithms. Today, all the attention of investors is focused on the FOMC meeting and Jerome Powell’s press conference. Watch out for the volatility to rise sharply. Analysts expect officials to point out a discussion on the reduction in stimulation measures, but the cuts themselves will not be implemented yet, as the number of jobs is significantly lower than the pre-pandemic level. Therefore, it is more likely that soft monetary policy will remain until August.
European stock indices closed with a rise on Tuesday. Germany’s DAX and Britain’s FTSE increased by 0.36%. The vaccination rate in Europe continues to rise. Europe is expected to reach the marker of 70% of vaccinated adults in July. This state of affairs will undoubtedly have a positive effect on the growth of the eurozone economy. The UK has not yet lifted strong restrictions, the opening of the economy has been postponed until next month. The consumer price index showed that inflation in Foggy Albion increased to 2.1%. Experts believe a figure of 2.5% by the end of this year.
The price of oil is unstoppable. Yesterday, the price of the “black gold” hit its 2-year high again. Today, traders are expecting a report on crude oil inventories, which usually has a significant impact on oil price behavior. Inventory shortages could push the price even higher.
Gold futures remained at the same level. It is very important to monitor the dollar index and Treasury yields now, as gold has an inverse correlation to these instruments. If the monetary policy will be maintained till August, gold is very likely to continue its upward trend. On the other hand, copper prices are declining and are close to good medium-term buying points.
Japan’s Nikkei index decreased by 0.2% and China’s main index, the CSI 300, lost 0.3%. Volatility in Asian indices has declined as investors are wary of any signs of aggressiveness from the US Federal Reserve. There are also slight concerns about the slowdown in China’s economy, this data will be released today. There is another coronavirus outbreak in Australia.
Main market quotes:
S&P 500 (F) 4,246.59 -8.56 (-0.20%)
Dow Jones 34,299.33 -94.42 (-0.27%)
DAX 15,729.52 +55.88 (+0.36%)
FTSE 100 7,172.48 +25.80 (+0.36%)
USD Index 90.52 -0.00 (-0.01%)
Important events:
– UK Consumer Price Index (m/m, y/y) at 09:00 (GMT+3);
– China Industrial Production (m/m, y/y) at 10:00 (GMT+3);
– China Retail Sales (m/m) at 10:00 (GMT+3);
– Canada Consumer Price Index (m/m) at 15:30 (GMT+3);
– Canada Core CPI (m/m) at 15:30 (GMT+3);
– US Building Permits (m/m) at 15:30 (GMT+3);
– US Crude Oil Reserves (w/w) at 17:30 (GMT+3);
– US FOMC Meeting Minutes Release at 21:00 (GMT+3);
This article reflects a personal opinion and should not be interpreted as an investment advice, and/or offer, and/or a persistent request for carrying out financial transactions, and/or a guarantee, and/or a forecast of future events.
The pair has found support at the lower range of its horizontal consolidation (1.4040). This demand zone from the daily chart is critical in keeping the bullish trend intact.
An oversold RSI at this level may have prompted the bulls to buy the dip. 1.4125 from the latest sell-off is the immediate resistance. Its clearance could pave the way to the peak at 1.4250.
On the downside, a breakout could trigger a sell-off towards 1.3900.
The breakout above the previous high at 14070 is a confirmation of bullish continuation. The bullish MA cross on the daily chart suggests an acceleration in the rally.
Short-term retracement could meet buying interest from trend followers. 14170 is the immediate resistance and the psychological level of 14000 is the closest support.
Further down, 13800 on the 20-day moving average would be a test for the bulls’ commitment.
XAGUSD consolidates ahead of breakout
Silver holds on to recent gains as the US dollar softens on lackluster retail numbers.
Sentiment has recovered after the price rallied above the daily resistance at 28.30. The precious metal is grinding along the 30-day moving average in search of bids.
27.00 is a major support while the sideways action goes on. A bearish breakout could extend the correction towards 26.10.
On the upside, a close above 28.00 may lead the price to challenge the upper band of the range at 28.70 for the third time.
Markets have been in “wait-and-see” mode this week, ahead of a “wait-and-see” Fed perhaps. The “transitory inflation” story is now fully priced in (after a few moments of disbelief) by markets which means the Fed may struggle to be any more dovish at their meeting this evening. Is it now time to acknowledge that some of the emergency bond buying programmes for the pandemic depression are not needed in a few months? At least some consideration of the timing of the taper seems warranted, as traders obsess over the “t” words.
The dollar has been firm this week, though closing within ranges with two “doji” candles printing so far. Trends have been mixed across G10 pairs with trading generally quiet as traders await the dots and hang on every word and change in language from Jay Powell and the FOMC.
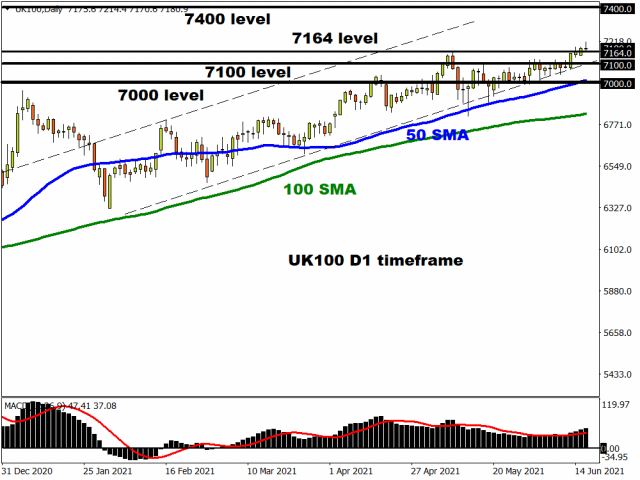
More upside to come in the FTSE100
Stocks are treading water with US futures mixed and European markets opening modestly higher. The FTSE 100, sometimes known as the “global cyclical bellweather” due to the majority of the listed companies generating revenues from overseas, is aiming to push higher as it still lags other major indices in making new all-time highs. A strong close this week will put bulls in the box seat for more upside, with targets above being 7400 which would be close to reclaiming all the losses from the pandemic selloff.
The UK released inflation data earlier this morning with you guessed it, beats across the board! The headline number came in at 2.1% y/y versus analyst estimates of 1.8% while the core also printed stronger than expected at 2.0% against the 1.5% projection. Hot numbers for sure, with the usual base effects and supply constraints in the price pressure mix. BoE policymakers will be alert to this in the general narrative of rising prices.
Oil marches higher
Brent crude is trading above $74 and at levels last seen back in April 2019. API reported overnight that US crude oil inventories fell by 8.5 million barrels over the last week, far more than the 2.5 million barrels decline the market was expecting. If the EIA reports a similar fall later today, it would be the largest decline wince the start of the year. Optimism over the demand outlook is one factor driving prices north, while both OEPC+ and US shale oil producers are expected to support the supply of oil.
Disclaimer: The content in this article comprises personal opinions and should not be construed as containing personal and/or other investment advice and/or an offer of and/or solicitation for any transactions in financial instruments and/or a guarantee and/or prediction of future performance. ForexTime (FXTM), its affiliates, agents, directors, officers or employees do not guarantee the accuracy, validity, timeliness or completeness, of any information or data made available and assume no liability as to any loss arising from any investment based on the same.
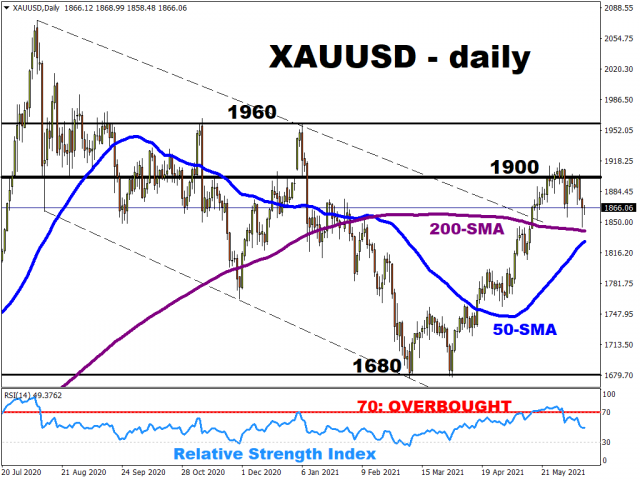
The $1900 mark has been pushed further out from gold’s reach ahead of the keenly-awaited, two-day Fed meeting which begins today.
Since breaching the psychologically-important level in May, the precious metal has declined about 2.5% so far this month, posting a lower high and a lower low on the daily charts.
To be fair, after posting the double-bottom on 30 March, spot gold has advanced by more than 10% even after taking into account June’s declines. However, what’s of particular note is the fact that it has since struggled to punch significantly past $1900.
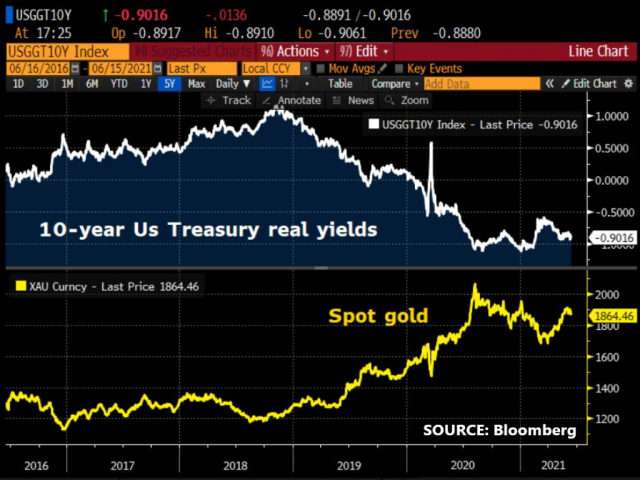
Gold bulls’ June frustrations so far stem from a US dollar that’s refusing to buckle under the weight of a dovish Fed, and the relative resilience of real yields on US Treasuries; both have moved higher coming into this week.
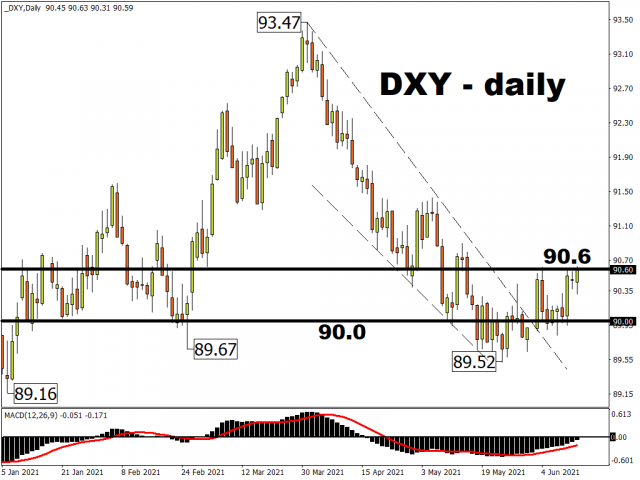
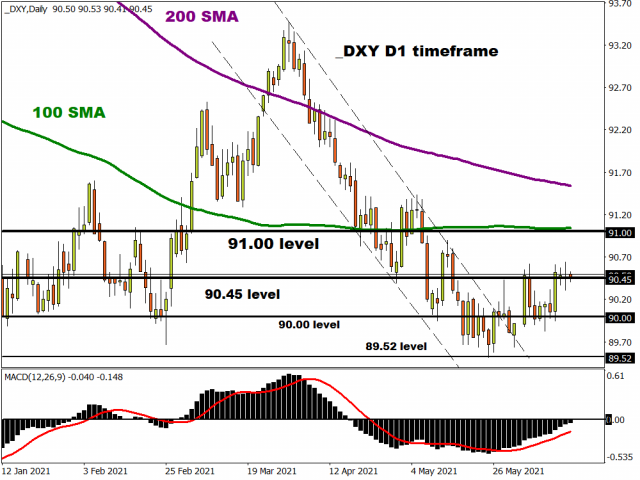
Despite a 3-month low for nominal yields on 10-year Treasuries, which the greenback tracks rather closely, the dollar index (DXY) has been able to keep its head above the psychological 90 level.
Similarly, the real yields on 10-year Treasuries have refused to fall deeper into negative territory, hovering around the minus 0.9 percent mark at the time of writing. Note the inverse relationship between gold prices and real Treasury yields (when real yields rise, gold falls, and vice versa).
It looks like both the DXY and 10-year real yields have to climb a leg lower (think sub-90 DXY and 10-year real yields that are closer to negative one percent) before the precious metal can enjoy another gust of tailwinds.
The crucial immediate question is, will the Fed produce those bullish cues for gold this week?
First things first, the Fed is widely expected to leave its policy settings untouched at the June meeting. That means interest rates remain near-zero, and the Fed presses on with its $120 billion in monthly asset purchases that’s supported financial markets since the pandemic broke out.
Also, the Fed has often repeated its stance that inflationary pressures in play at the moment are expected to be transitory. So instead of looking at inflation overshoots, policymakers want to see a more equitable and “broad-based” recovery in the US labour market before easing up on their support.
It’s highly unlikely that the Fed would want to rock global financial markets. I’m sure policymakers would want to avoid a repeat of the infamous ‘taper tantrum’ from 2013.
The key here is for the Fed to convey its policy intentions clearly, allowing market participants plenty of time to digest the central bank’s messaging.
And what is this message that markets are so eager to hear?
It’s when, or under what economic conditions, would the Fed start to taper its $120 billion in monthly asset purchases.
And those cues could arrive from any of these channels on Wednesday:
The language used in the FOMC statement
The updated economic projections
The words employed by Fed Chair Jerome Powell during his post-meeting press conference
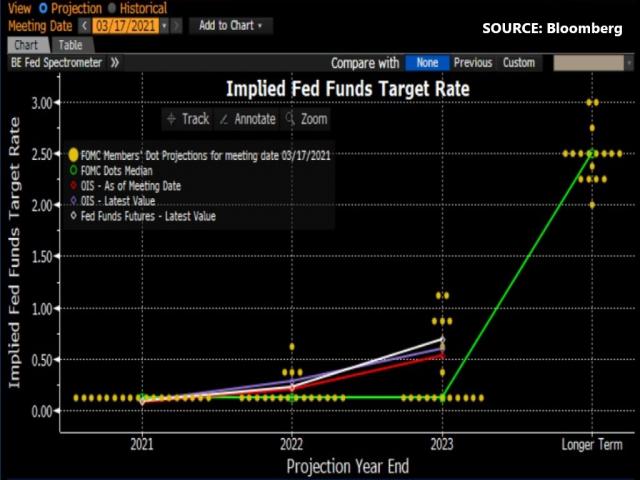
The FOMC dot plot (which denotes each FOMC member’s outlook for US interest rates)
Should any of these channels offer cues that the Fed’s tapering is coming sooner than expected, such hawkish tones could see spot gold testing its 200-day simple moving average as a key support level. However, if the Fed coos signals that are more dovish-than-expected, that could spell a return to $1900 for the precious metal while potentially sealing a ‘golden cross’ for spot gold whereby its 50-day simple moving average can cross above its 200-day counterpart.
Disclaimer: The content in this article comprises personal opinions and should not be construed as containing personal and/or other investment advice and/or an offer of and/or solicitation for any transactions in financial instruments and/or a guarantee and/or prediction of future performance. ForexTime (FXTM), its affiliates, agents, directors, officers or employees do not guarantee the accuracy, validity, timeliness or completeness, of any information or data made available and assume no liability as to any loss arising from any investment based on the same.
Failure of a machine in a factory can shut it down. Lost production can cost millions of dollars per day. Component failures can devastate factories, power plants and battlefield equipment.
To return to operation, skilled technicians use all the tools in their kit – machining, bending, welding and surface treating, making just the right part as quickly and as accurately as possible. But there’s a declining number of technicians with the right skills, and the quality of things made by hand is subject to the skills and mood of the artisan on the day the part is made.
Both problems could soon be solved by artificially intelligent robotic technicians. These systems can take measurements; shape, cut or weld parts using varied tools; pass parts to specialized equipment; and even purchase needed materials – all without human intervention. Known as hybrid autonomous manufacturing, this process involves automated systems that seamlessly use multiple tools and techniques to build high-quality components where and when they are needed.
I am a professor of metallurgical engineering. My colleagues and I design the recipes to make materials and components with just the right internal structure to create properties like strength and fracture resistance. With a network of colleagues at Ohio State and other universities, I have been developing a plan to give birth to these autonomous artisans.
How things are made
Components are either mass-produced or custom-made.
Most things people touch daily have been mass-produced. Quality is assured by using well-honed processes based on testing and monitoring large numbers of parts and assuring the process is done the same way every time.
Custom fabrication – making components on demand – is often essential, sometimes to conform to a patient’s specific anatomy or to replace aircraft landing gear that was forged and is no longer being made. Processes for making metallic parts – material removal, deposition, deformation, transformation, inspection – can all be done with small tools, with incremental actions rather than the kind of bulk processes, usually with big tools and dies, used in mass production.
Automation has long been a part of mass production, which includes sophisticated robots that handle parts and weld on automobile assembly lines. Additive manufacturing, often referred to as 3D printing, is increasingly being used with a variety of materials to make components.
Now in development are robotic blacksmiths – robots that can hammer metallic parts into shape instead of cutting, building up or molding them.
Robots have been building cars for decades, but they typically carry out simple, repetitive tasks that don’t require decision-making. Lenny Kuhne/Unsplash
Automated customization – not an oxymoron
To automate custom fabrication, my colleagues and I are developing an automated suite of tools that can carry out all the steps for making a wide range of components, using multiple processes without human intervention. Sensors will also be central to hybrid autonomous manufacturing to control the processes and maintain and assure quality.
Such autonomous manufacturing systems will make the myriad decisions needed to create a component of the right strength, size and surface finish. Artificial intelligence will be required to handle the enormous number of choices of materials, machine settings and process sequences. Rather than finding a mass production recipe and never deviating, these autonomous manufacturing systems will choose from a very large set of possible recipes to create parts, and will have the intelligence to assure that the chosen path produces components with the appropriate material properties.
Robots could either position small tools on manufactured component or transfer the component from one piece of equipment to another. A fully autonomous system could manufacture a wide range of products with a versatile set of tools. The systems could source materials and possibly even send work out to specialized cutting and deformation tools, just like a human artisan.
The production rate of such systems would not rival those of mass production, but because robots can work continuously they can be more productive than human technicians are. Data from sensors provide a digital record of all the steps and processes with critical temperatures, machine settings and even images. This record can assure quality by, for example, making sure the material was deformed the right amount and cracks were not produced during the process and covered up.
Manufacturing at or near the operating room is one example of a process that can be enabled with hybrid autonomous manufacturing. Often when patients with bone fractures undergo trauma surgery, metallic plates of varied shapes are required to hold bones together for healing. These are often created in the operating room, where the surgeon bends plates to fit the patient, sometimes using a 3D-printed model created from medical images of the patient as a form to bend the metal against.
Bending by hand is slow and imprecise, and stressing the plate in the wrong place can cause it to fracture. A robotic technician could cut and bend and finish a plate before surgery. Patients do better and save money if they spend less time in the hospital.
The road to robotic artisans
Numerous companies are now showing the way forward in autonomous manufacturing, including three venture-funded startups. FormLogic is developing automated high-quality machine shops. Path Robotics is putting the skills of a welder into a robot. And Machina Labs is out to create robotic blacksmiths. Other companies are developing systems to automate design and logistics.
Hybridization – the ability to carry out different tasks in different ways with multiple tools – is the next step. The key pieces of hybrid autonomous manufacturing exist now, and fully autonomous systems could be common in a decade. Companies adopting this approach to custom fabrication will need to draw on a new generation of students with the skills to combine these technologies.














 Article by