
By Han Tan Market Analyst, ForexTime
The $1900 mark has been pushed further out from gold’s reach ahead of the keenly-awaited, two-day Fed meeting which begins today.
Since breaching the psychologically-important level in May, the precious metal has declined about 2.5% so far this month, posting a lower high and a lower low on the daily charts.
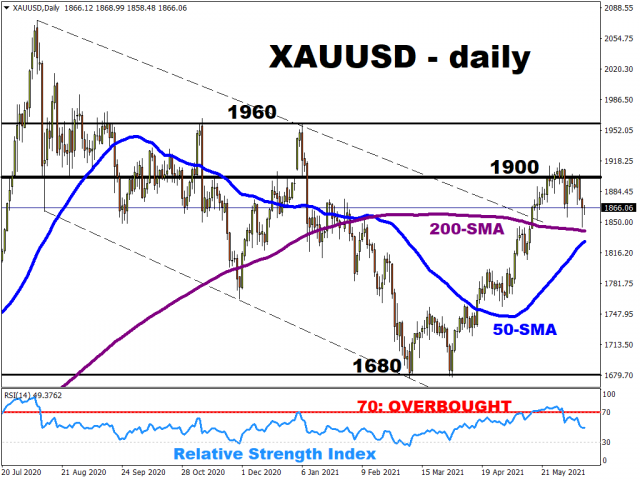
To be fair, after posting the double-bottom on 30 March, spot gold has advanced by more than 10% even after taking into account June’s declines. However, what’s of particular note is the fact that it has since struggled to punch significantly past $1900.
‘Markets Extra’ Podcast: Gold prices and the two “magic” T-words
Free Reports:
 Download Our Metatrader 4 Indicators – Put Our Free MetaTrader 4 Custom Indicators on your charts when you join our Weekly Newsletter
 Get our Weekly Commitment of Traders Reports - See where the biggest traders (Hedge Funds and Commercial Hedgers) are positioned in the futures markets on a weekly basis.
Why are gold prices struggling to climb higher?
Gold bulls’ June frustrations so far stem from a US dollar that’s refusing to buckle under the weight of a dovish Fed, and the relative resilience of real yields on US Treasuries; both have moved higher coming into this week.
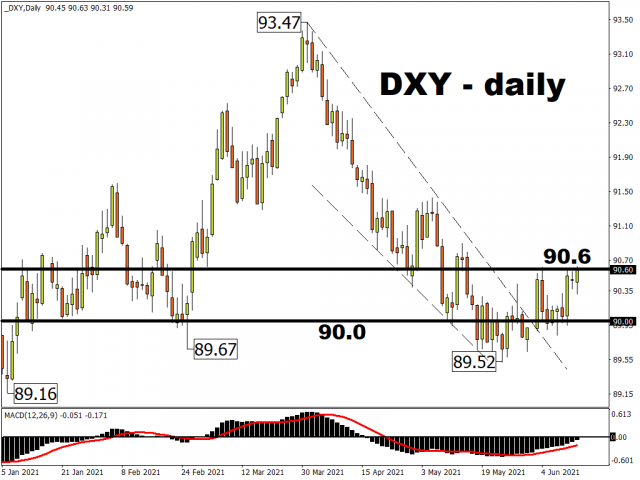
Despite a 3-month low for nominal yields on 10-year Treasuries, which the greenback tracks rather closely, the dollar index (DXY) has been able to keep its head above the psychological 90 level.
Similarly, the real yields on 10-year Treasuries have refused to fall deeper into negative territory, hovering around the minus 0.9 percent mark at the time of writing. Note the inverse relationship between gold prices and real Treasury yields (when real yields rise, gold falls, and vice versa).
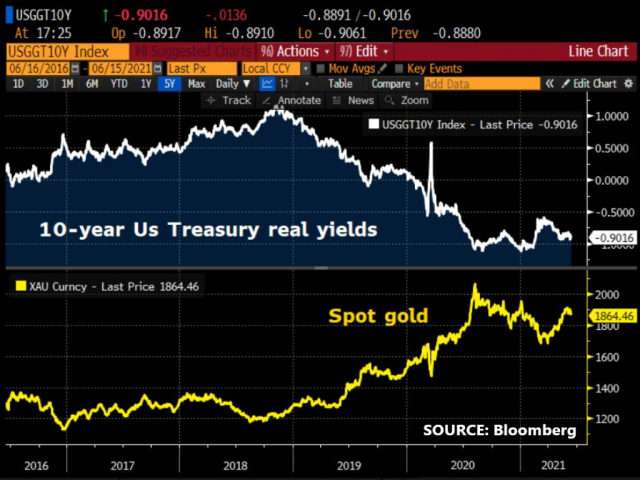
It looks like both the DXY and 10-year real yields have to climb a leg lower (think sub-90 DXY and 10-year real yields that are closer to negative one percent) before the precious metal can enjoy another gust of tailwinds.
The crucial immediate question is, will the Fed produce those bullish cues for gold this week?
First things first, the Fed is widely expected to leave its policy settings untouched at the June meeting. That means interest rates remain near-zero, and the Fed presses on with its $120 billion in monthly asset purchases that’s supported financial markets since the pandemic broke out.
Also, the Fed has often repeated its stance that inflationary pressures in play at the moment are expected to be transitory. So instead of looking at inflation overshoots, policymakers want to see a more equitable and “broad-based” recovery in the US labour market before easing up on their support.
It’s highly unlikely that the Fed would want to rock global financial markets. I’m sure policymakers would want to avoid a repeat of the infamous ‘taper tantrum’ from 2013.
The key here is for the Fed to convey its policy intentions clearly, allowing market participants plenty of time to digest the central bank’s messaging.
And what is this message that markets are so eager to hear?
It’s when, or under what economic conditions, would the Fed start to taper its $120 billion in monthly asset purchases.
And those cues could arrive from any of these channels on Wednesday:
- The language used in the FOMC statement
- The updated economic projections
- The words employed by Fed Chair Jerome Powell during his post-meeting press conference
- The FOMC dot plot (which denotes each FOMC member’s outlook for US interest rates)
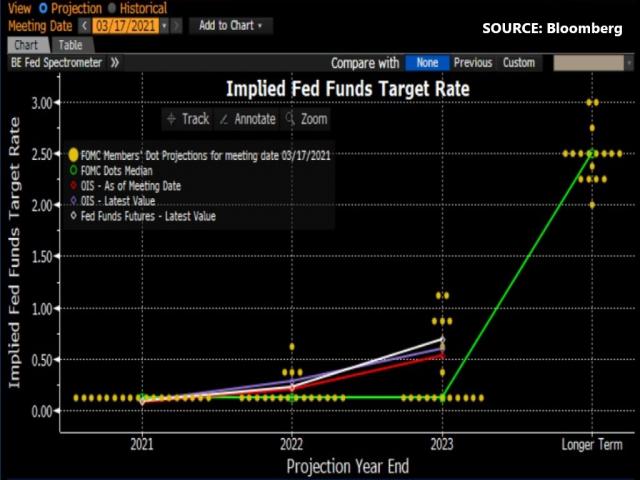
Should any of these channels offer cues that the Fed’s tapering is coming sooner than expected, such hawkish tones could see spot gold testing its 200-day simple moving average as a key support level. However, if the Fed coos signals that are more dovish-than-expected, that could spell a return to $1900 for the precious metal while potentially sealing a ‘golden cross’ for spot gold whereby its 50-day simple moving average can cross above its 200-day counterpart.
READ MORE: 6 reasons behind gold’s recent climb
Disclaimer: The content in this article comprises personal opinions and should not be construed as containing personal and/or other investment advice and/or an offer of and/or solicitation for any transactions in financial instruments and/or a guarantee and/or prediction of future performance. ForexTime (FXTM), its affiliates, agents, directors, officers or employees do not guarantee the accuracy, validity, timeliness or completeness, of any information or data made available and assume no liability as to any loss arising from any investment based on the same.
 Article by ForexTime
ForexTime Ltd (FXTM) is an award winning international online forex broker regulated by CySEC 185/12 www.forextime.com

- GBP/USD at Month’s Lows: The Outlook Remains Weak Jul 29, 2026
- Crude oil falls below $80 per barrel. Australia sees inflation slowdown Jul 29, 2026
- The US Tech sector hit by sell‑off. Oil prices decline on renewed negotiations Jul 28, 2026
- Gold Declines, Focus on Fed and Falling Oil Prices Jul 28, 2026
- This week will be one of the most crowded for central‑bank meetings Jul 27, 2026
- EUR/USD Ahead of a Key Week: Holding Near Lows Jul 27, 2026
- COT Metals Charts: Weekly Speculator Changes led by Copper Jul 26, 2026
- COT Bonds Charts: Speculator Bets led by SOFR 3-Months & 5-Year Bonds Jul 26, 2026
- COT Energy Charts: Weekly Speculator Bets led by WTI Crude & Natural Gas Jul 26, 2026
- COT Soft Commodities Charts: Weekly Speculator Bets led by Corn & Soybeans Jul 26, 2026
