COT Soft Commodities Charts: Coffee, Soybeans, Wheat, Cattle, Hogs & Corn

By CountingPips.com COT Home | Data Tables | Data Downloads | Newsletter

Here are the latest charts and statistics for the Commitment of Traders (COT) data published by the Commodities Futures Trading Commission (CFTC).

The latest COT data is updated through Tuesday August 24 2021 and shows a quick view of how large traders (for-profit speculators and commercial entities) were positioned in the futures markets.


CORN Futures:
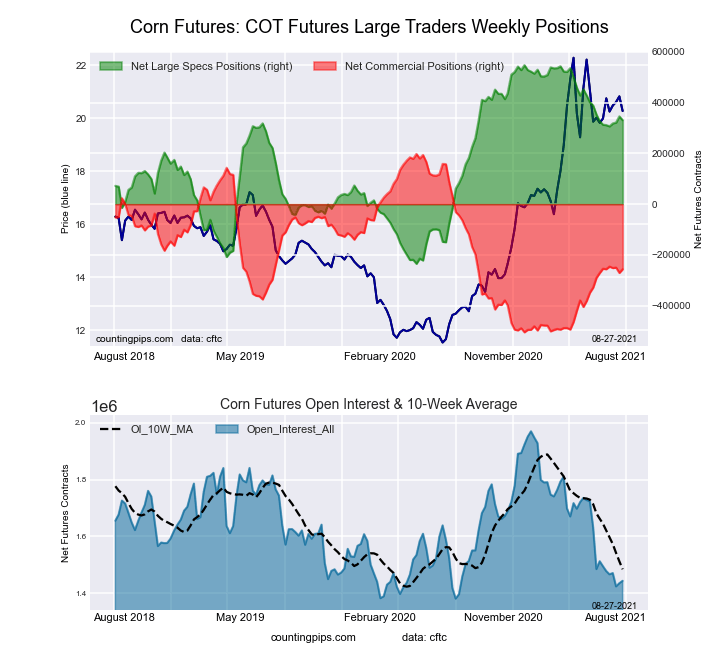
Federal Funds 30-Day Bonds Futures COT ChartThe CORN large speculator standing this week recorded a net position of 330,967 contracts in the data reported through Tuesday. This was a weekly fall of -14,879 contracts from the previous week which had a total of 345,846 net contracts.

This week’s current strength score (the trader positioning range over the past three years, measured from 0 to 100) shows the speculators are currently Bullish with a score of 72.3 percent. The commercials are Bearish with a score of 35.3 percent and the small traders (not shown in chart) are Bearish-Extreme with a score of 0.3 percent.

CORN Futures StatisticsSPECULATORSCOMMERCIALSSMALL TRADERS
– Percent of Open Interest Longs:29.147.47.7
– Percent of Open Interest Shorts:6.165.212.9
– Net Position:330,967-256,700-74,267
– Gross Longs:419,537684,905111,865
– Gross Shorts:88,570941,605186,132
– Long to Short Ratio:4.7 to 10.7 to 10.6 to 1
NET POSITION TREND:
– COT Index Score (3 Year Range Pct):72.335.30.3
– COT Index Reading (3 Year Range):BullishBearishBearish-Extreme
NET POSITION MOVEMENT INDEX:
– 6-Week Change in Strength Index:2.3-0.3-9.1


SUGAR Futures:

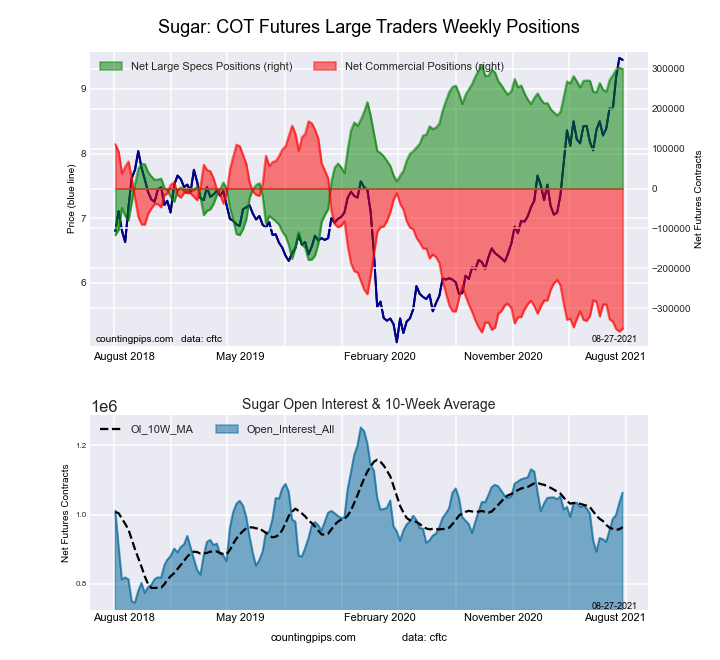
2-Year Treasury Bonds Futures COT ChartThe SUGAR large speculator standing this week recorded a net position of 299,077 contracts in the data reported through Tuesday. This was a weekly decrease of -3,190 contracts from the previous week which had a total of 302,267 net contracts.

This week’s current strength score (the trader positioning range over the past three years, measured from 0 to 100) shows the speculators are currently Bullish-Extreme with a score of 98.1 percent. The commercials are Bearish-Extreme with a score of 1.7 percent and the small traders (not shown in chart) are Bullish with a score of 71.3 percent.

SUGAR Futures StatisticsSPECULATORSCOMMERCIALSSMALL TRADERS
– Percent of Open Interest Longs:31.943.59.1
– Percent of Open Interest Shorts:3.876.44.2
– Net Position:299,077-350,43551,358
– Gross Longs:338,985462,37596,543
– Gross Shorts:39,908812,81045,185
– Long to Short Ratio:8.5 to 10.6 to 12.1 to 1
NET POSITION TREND:
– COT Index Score (3 Year Range Pct):98.11.771.3
– COT Index Reading (3 Year Range):Bullish-ExtremeBearish-ExtremeBullish
NET POSITION MOVEMENT INDEX:
– 6-Week Change in Strength Index:10.7-11.410.2


COFFEE Futures:

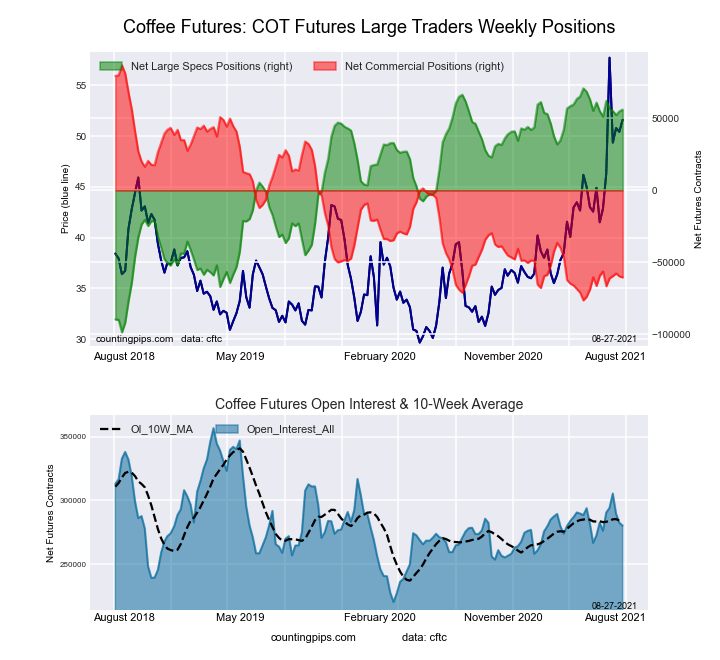
5-Year Treasury Bonds Futures COT ChartThe COFFEE large speculator standing this week recorded a net position of 56,012 contracts in the data reported through Tuesday. This was a weekly increase of 1,215 contracts from the previous week which had a total of 54,797 net contracts.

This week’s current strength score (the trader positioning range over the past three years, measured from 0 to 100) shows the speculators are currently Bullish-Extreme with a score of 91.3 percent. The commercials are Bearish-Extreme with a score of 9.8 percent and the small traders (not shown in chart) are Bearish-Extreme with a score of 18.6 percent.

COFFEE Futures StatisticsSPECULATORSCOMMERCIALSSMALL TRADERS
– Percent of Open Interest Longs:27.145.04.0
– Percent of Open Interest Shorts:7.166.62.4
– Net Position:56,012-60,3894,377
– Gross Longs:75,855126,19911,105
– Gross Shorts:19,843186,5886,728
– Long to Short Ratio:3.8 to 10.7 to 11.7 to 1
NET POSITION TREND:
– COT Index Score (3 Year Range Pct):91.39.818.6
– COT Index Reading (3 Year Range):Bullish-ExtremeBearish-ExtremeBearish-Extreme
NET POSITION MOVEMENT INDEX:
– 6-Week Change in Strength Index:2.8-2.5-4.7


SOYBEANS Futures:

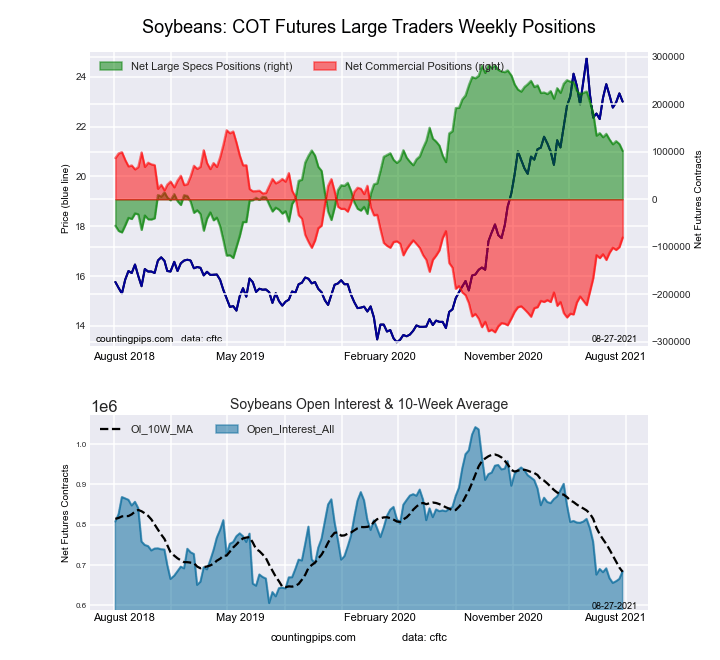
10-Year Treasury Notes Bonds Futures COT ChartThe SOYBEANS large speculator standing this week recorded a net position of 101,647 contracts in the data reported through Tuesday. This was a weekly fall of -14,757 contracts from the previous week which had a total of 116,404 net contracts.

This week’s current strength score (the trader positioning range over the past three years, measured from 0 to 100) shows the speculators are currently Bullish with a score of 55.5 percent. The commercials are Bearish with a score of 46.9 percent and the small traders (not shown in chart) are Bearish with a score of 36.5 percent.

SOYBEANS Futures StatisticsSPECULATORSCOMMERCIALSSMALL TRADERS
– Percent of Open Interest Longs:25.654.36.5
– Percent of Open Interest Shorts:10.866.19.6
– Net Position:101,647-80,417-21,230
– Gross Longs:175,251372,08144,299
– Gross Shorts:73,604452,49865,529
– Long to Short Ratio:2.4 to 10.8 to 10.7 to 1
NET POSITION TREND:
– COT Index Score (3 Year Range Pct):55.546.936.5
– COT Index Reading (3 Year Range):BullishBearishBearish
NET POSITION MOVEMENT INDEX:
– 6-Week Change in Strength Index:-7.28.3-10.2


SOYBEAN OIL Futures:

Ultra 10-Year Treasury Notes Bonds Futures COT ChartThe SOYBEAN OIL large speculator standing this week recorded a net position of 65,048 contracts in the data reported through Tuesday. This was a weekly boost of 482 contracts from the previous week which had a total of 64,566 net contracts.

This week’s current strength score (the trader positioning range over the past three years, measured from 0 to 100) shows the speculators are currently Bullish with a score of 63.9 percent. The commercials are Bearish with a score of 38.9 percent and the small traders (not shown in chart) are Bearish with a score of 39.5 percent.

SOYBEAN OIL Futures StatisticsSPECULATORSCOMMERCIALSSMALL TRADERS
– Percent of Open Interest Longs:24.148.57.3
– Percent of Open Interest Shorts:8.865.45.7
– Net Position:65,048-72,0236,975
– Gross Longs:102,475206,53331,217
– Gross Shorts:37,427278,55624,242
– Long to Short Ratio:2.7 to 10.7 to 11.3 to 1
NET POSITION TREND:
– COT Index Score (3 Year Range Pct):63.938.939.5
– COT Index Reading (3 Year Range):BullishBearishBearish
NET POSITION MOVEMENT INDEX:
– 6-Week Change in Strength Index:2.6-1.5-8.2


SOYBEAN MEAL Futures:

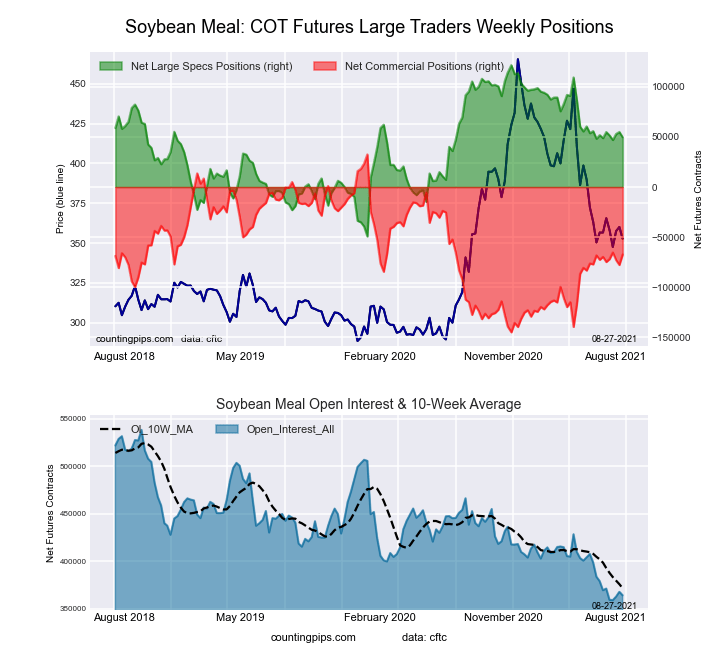
US Year Treasury Notes Long Bonds Futures COT ChartThe SOYBEAN MEAL large speculator standing this week recorded a net position of 49,708 contracts in the data reported through Tuesday. This was a weekly decrease of -5,239 contracts from the previous week which had a total of 54,947 net contracts.

This week’s current strength score (the trader positioning range over the past three years, measured from 0 to 100) shows the speculators are currently Bullish with a score of 57.9 percent. The commercials are Bearish with a score of 43.7 percent and the small traders (not shown in chart) are Bearish with a score of 41.5 percent.

SOYBEAN MEAL Futures StatisticsSPECULATORSCOMMERCIALSSMALL TRADERS
– Percent of Open Interest Longs:22.851.312.4
– Percent of Open Interest Shorts:9.169.87.6
– Net Position:49,708-67,40017,692
– Gross Longs:82,975186,89845,240
– Gross Shorts:33,267254,29827,548
– Long to Short Ratio:2.5 to 10.7 to 11.6 to 1
NET POSITION TREND:
– COT Index Score (3 Year Range Pct):57.943.741.5
– COT Index Reading (3 Year Range):BullishBearishBearish
NET POSITION MOVEMENT INDEX:
– 6-Week Change in Strength Index:0.51.3-13.0


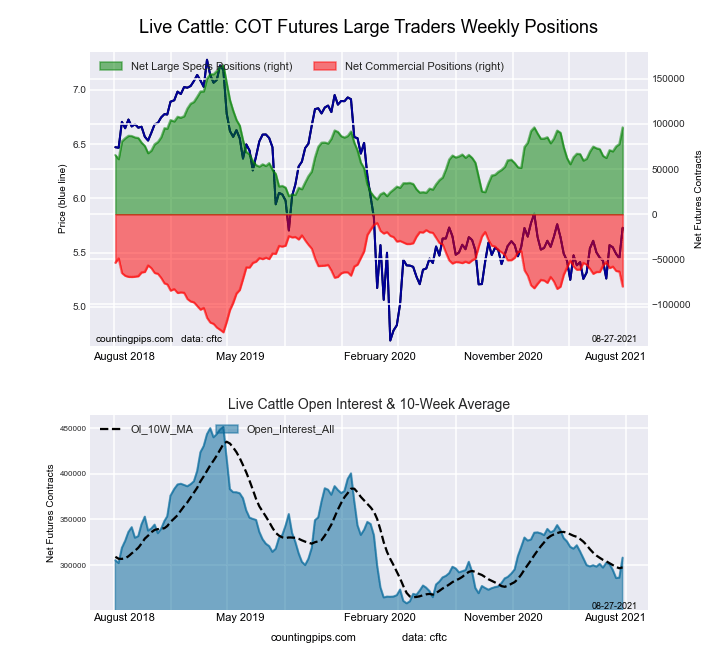
LIVE CATTLE Futures:

Ultra US Year Treasury Notes Long Bonds Futures COT ChartThe LIVE CATTLE large speculator standing this week recorded a net position of 96,218 contracts in the data reported through Tuesday. This was a weekly advance of 18,433 contracts from the previous week which had a total of 77,785 net contracts.

This week’s current strength score (the trader positioning range over the past three years, measured from 0 to 100) shows the speculators are currently Bullish with a score of 53.6 percent. The commercials are Bearish with a score of 41.9 percent and the small traders (not shown in chart) are Bearish with a score of 47.9 percent.

LIVE CATTLE Futures StatisticsSPECULATORSCOMMERCIALSSMALL TRADERS
– Percent of Open Interest Longs:42.337.28.4
– Percent of Open Interest Shorts:11.163.213.6
– Net Position:96,218-80,141-16,077
– Gross Longs:130,451114,70425,824
– Gross Shorts:34,233194,84541,901
– Long to Short Ratio:3.8 to 10.6 to 10.6 to 1
NET POSITION TREND:
– COT Index Score (3 Year Range Pct):53.641.947.9
– COT Index Reading (3 Year Range):BullishBearishBearish
NET POSITION MOVEMENT INDEX:
– 6-Week Change in Strength Index:21.2-19.0-20.7


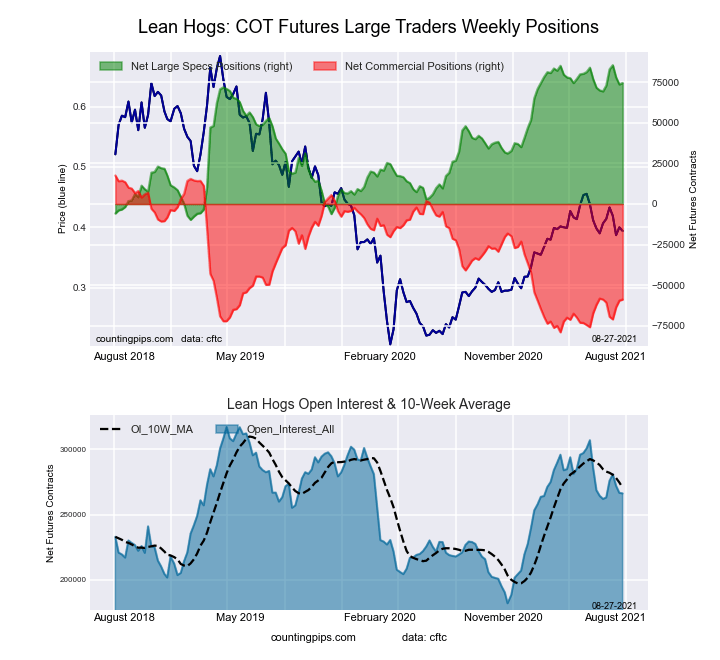
LEAN HOGS Futures:

Eurodollar Bonds Futures COT ChartThe LEAN HOGS large speculator standing this week recorded a net position of 74,630 contracts in the data reported through Tuesday. This was a weekly advance of 905 contracts from the previous week which had a total of 73,725 net contracts.

This week’s current strength score (the trader positioning range over the past three years, measured from 0 to 100) shows the speculators are currently Bullish-Extreme with a score of 88.5 percent. The commercials are Bearish with a score of 20.9 percent and the small traders (not shown in chart) are Bearish-Extreme with a score of 3.4 percent.

LEAN HOGS Futures StatisticsSPECULATORSCOMMERCIALSSMALL TRADERS
– Percent of Open Interest Longs:45.130.56.9
– Percent of Open Interest Shorts:17.152.612.8
– Net Position:74,630-58,935-15,695
– Gross Longs:120,07481,20918,297
– Gross Shorts:45,444140,14433,992
– Long to Short Ratio:2.6 to 10.6 to 10.5 to 1
NET POSITION TREND:
– COT Index Score (3 Year Range Pct):88.520.93.4
– COT Index Reading (3 Year Range):Bullish-ExtremeBearishBearish-Extreme
NET POSITION MOVEMENT INDEX:
– 6-Week Change in Strength Index:5.4-0.1-24.1


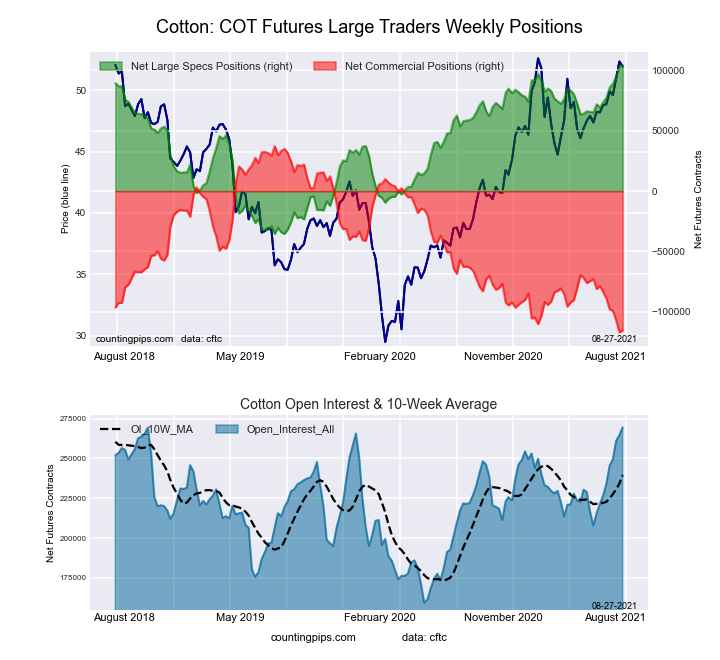
COTTON Futures:

Ultra 10-Year Treasury Notes Bonds Futures COT ChartThe COTTON large speculator standing this week recorded a net position of 104,309 contracts in the data reported through Tuesday. This was a weekly advance of 1,278 contracts from the previous week which had a total of 103,031 net contracts.

This week’s current strength score (the trader positioning range over the past three years, measured from 0 to 100) shows the speculators are currently Bullish-Extreme with a score of 100.0 percent. The commercials are Bearish-Extreme with a score of 0.9 percent and the small traders (not shown in chart) are Bullish-Extreme with a score of 83.0 percent.

COTTON Futures StatisticsSPECULATORSCOMMERCIALSSMALL TRADERS
– Percent of Open Interest Longs:44.736.27.0
– Percent of Open Interest Shorts:6.079.02.9
– Net Position:104,309-115,44111,132
– Gross Longs:120,52897,53218,814
– Gross Shorts:16,219212,9737,682
– Long to Short Ratio:7.4 to 10.5 to 12.4 to 1
NET POSITION TREND:
– COT Index Score (3 Year Range Pct):100.00.983.0
– COT Index Reading (3 Year Range):Bullish-ExtremeBearish-ExtremeBullish-Extreme
NET POSITION MOVEMENT INDEX:
– 6-Week Change in Strength Index:22.0-20.77.8


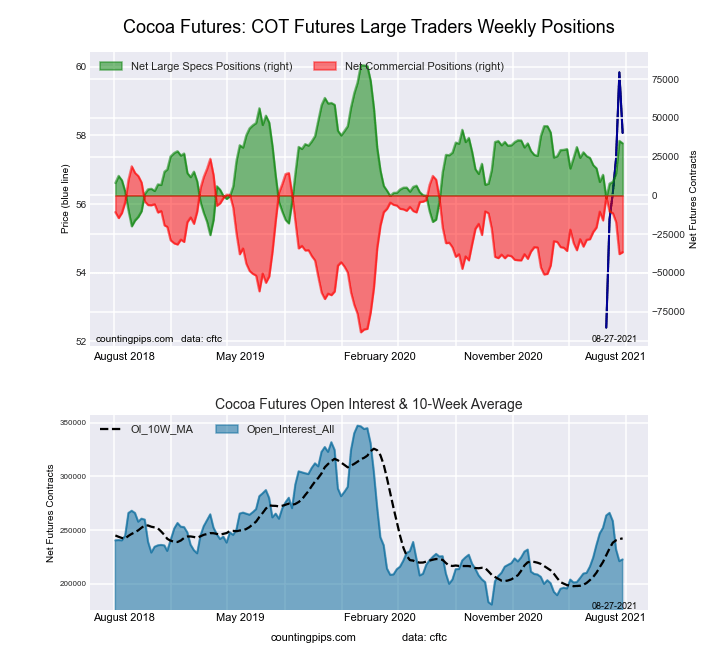
COCOA Futures:

US Year Treasury Notes Long Bonds Futures COT ChartThe COCOA large speculator standing this week recorded a net position of 33,655 contracts in the data reported through Tuesday. This was a weekly decrease of -1,540 contracts from the previous week which had a total of 35,195 net contracts.

This week’s current strength score (the trader positioning range over the past three years, measured from 0 to 100) shows the speculators are currently Bullish with a score of 54.0 percent. The commercials are Bearish with a score of 46.2 percent and the small traders (not shown in chart) are Bearish with a score of 41.7 percent.

COCOA Futures StatisticsSPECULATORSCOMMERCIALSSMALL TRADERS
– Percent of Open Interest Longs:31.251.45.0
– Percent of Open Interest Shorts:16.167.93.7
– Net Position:33,655-36,5752,920
– Gross Longs:69,449114,47511,240
– Gross Shorts:35,794151,0508,320
– Long to Short Ratio:1.9 to 10.8 to 11.4 to 1
NET POSITION TREND:
– COT Index Score (3 Year Range Pct):54.046.241.7
– COT Index Reading (3 Year Range):BullishBearishBearish
NET POSITION MOVEMENT INDEX:
– 6-Week Change in Strength Index:18.5-18.31.8


WHEAT Futures:

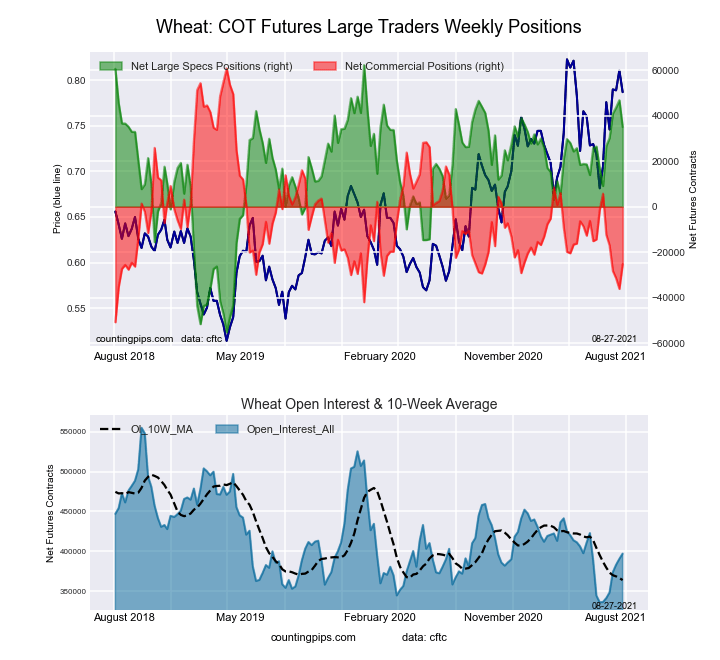
Ultra US Year Treasury Notes Long Bonds Futures COT ChartThe WHEAT large speculator standing this week recorded a net position of 35,048 contracts in the data reported through Tuesday. This was a weekly decrease of -11,746 contracts from the previous week which had a total of 46,794 net contracts.

This week’s current strength score (the trader positioning range over the past three years, measured from 0 to 100) shows the speculators are currently Bullish with a score of 76.9 percent. The commercials are Bearish with a score of 22.9 percent and the small traders (not shown in chart) are Bullish with a score of 54.6 percent.

WHEAT Futures StatisticsSPECULATORSCOMMERCIALSSMALL TRADERS
– Percent of Open Interest Longs:33.535.97.7
– Percent of Open Interest Shorts:24.742.310.2
– Net Position:35,048-25,214-9,834
– Gross Longs:133,081142,66830,683
– Gross Shorts:98,033167,88240,517
– Long to Short Ratio:1.4 to 10.8 to 10.8 to 1
NET POSITION TREND:
– COT Index Score (3 Year Range Pct):76.922.954.6
– COT Index Reading (3 Year Range):BullishBearishBullish
NET POSITION MOVEMENT INDEX:
– 6-Week Change in Strength Index:22.1-27.723.8


Article By CountingPips.comReceive our weekly COT Reports by Email

*COT Report: The COT data, released weekly to the public each Friday, is updated through the most recent Tuesday (data is 3 days old) and shows a quick view of how large speculators or non-commercials (for-profit traders) were positioned in the futures markets.

The CFTC categorizes trader positions according to commercial hedgers (traders who use futures contracts for hedging as part of the business), non-commercials (large traders who speculate to realize trading profits) and nonreportable traders (usually small traders/speculators).

Find CFTC criteria here: (http://www.cftc.gov/MarketReports/CommitmentsofTraders/ExplanatoryNotes/index.htm).

The Week Ahead – Jobs Numbers To Gauge Wind Direction

By Orbex

USD

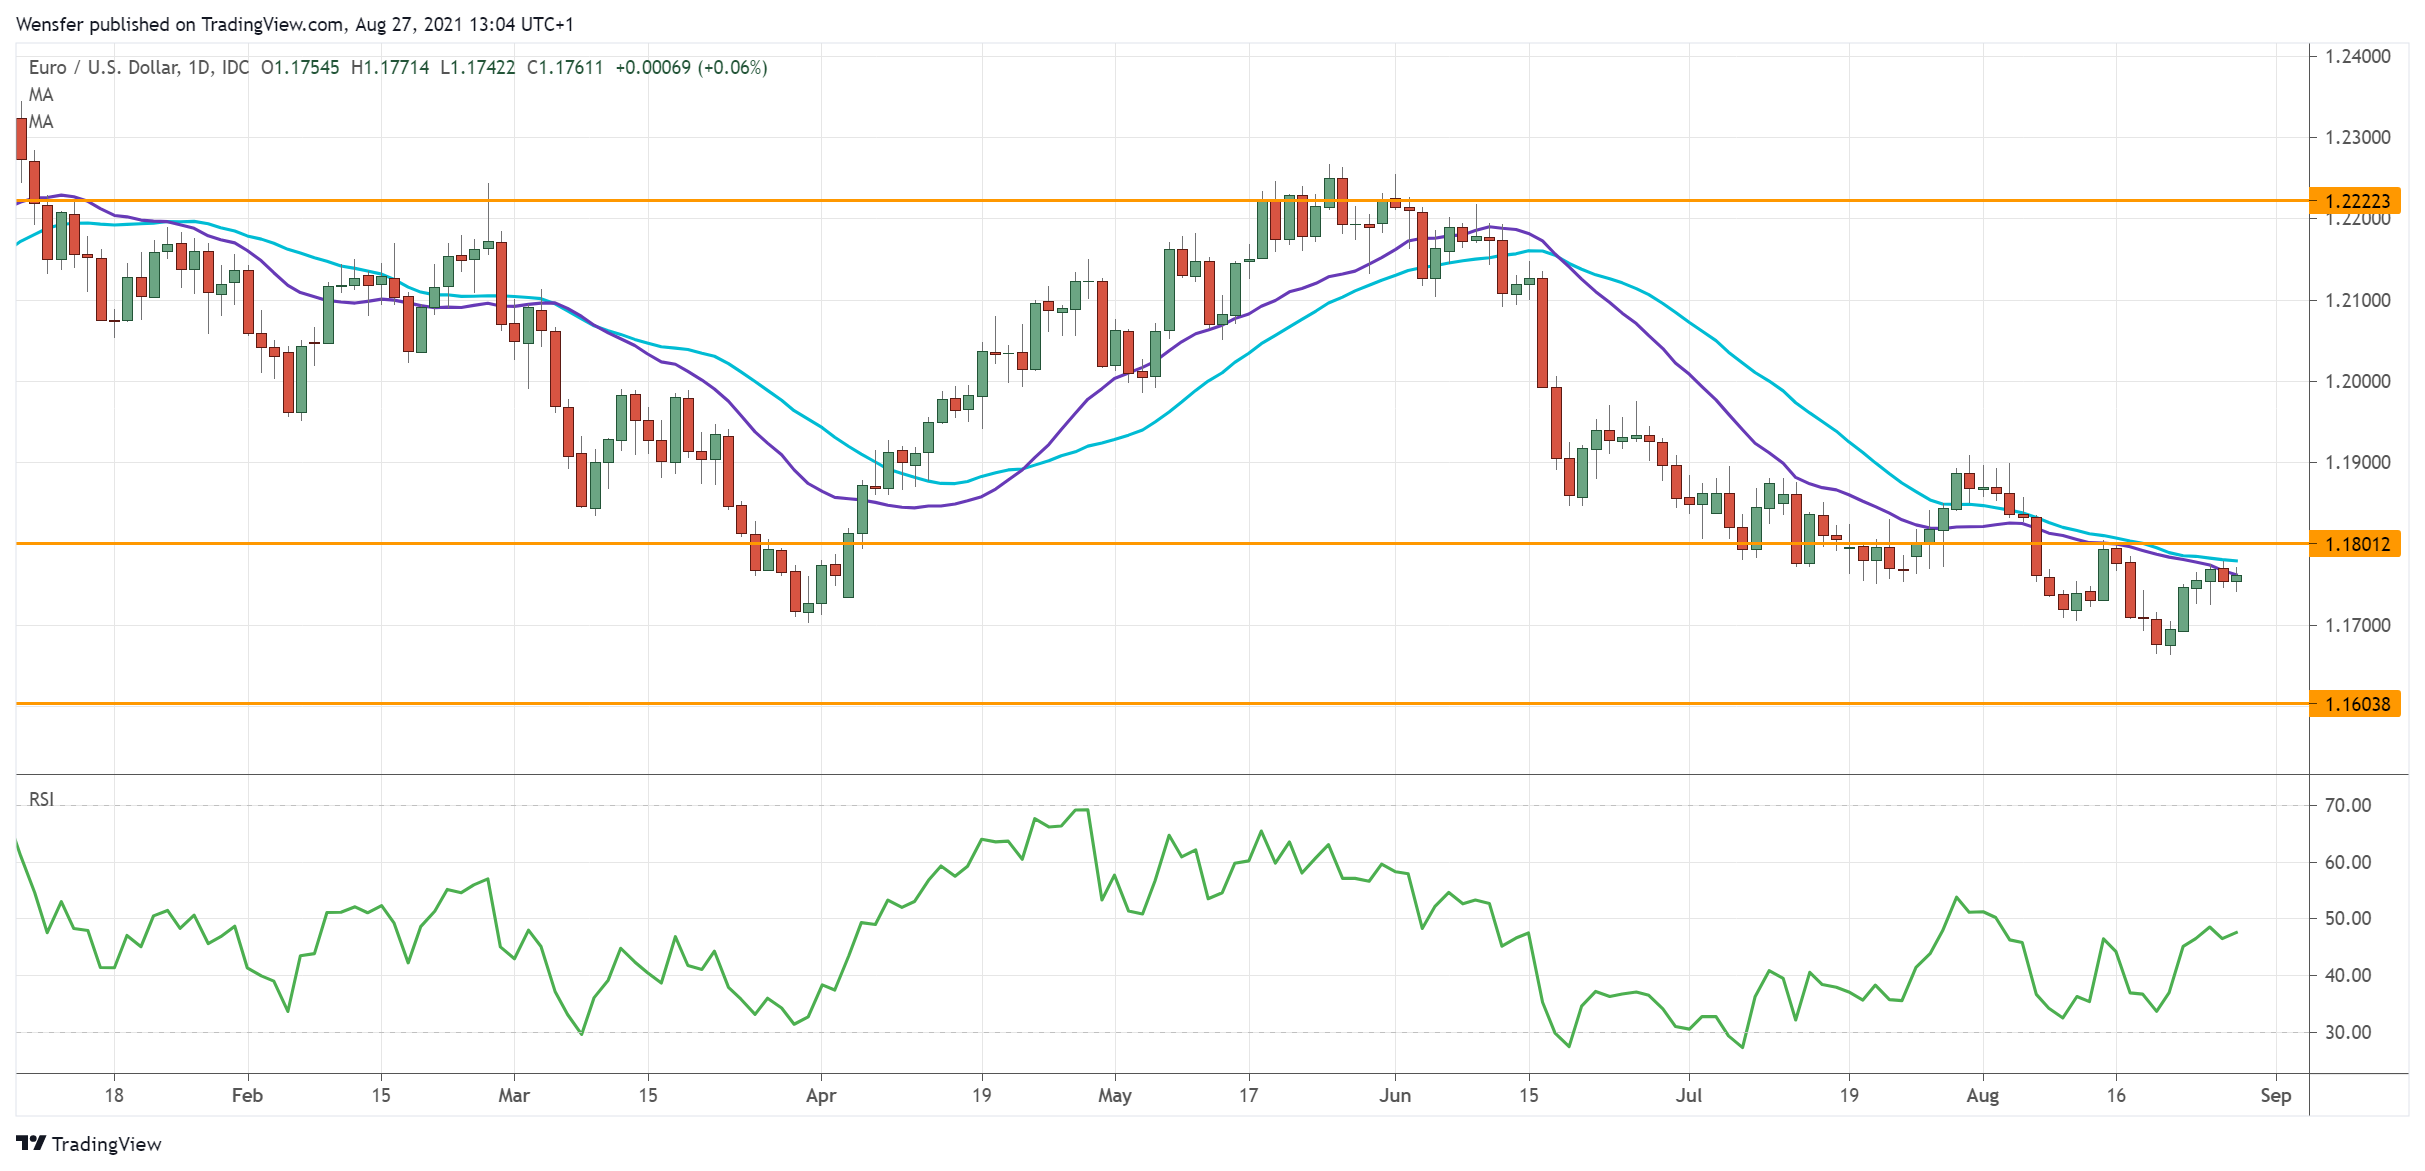
EURUSD struggles as US Fed remains unfazed

EURUSD

The US dollar resumes its rally as the Fed maintains its optimism about the economic recovery. The market’s recent jitters are a sign of indecision as traders navigate amid mixed data and statements.

As the spread of the Delta variant is still hitting the headlines, the last thing the dollar bulls want to hear is that the Fed will postpone the tapering schedule as the RBNZ did.

That said, bad news in nonfarm payrolls would be more impactful than good ones as the Fed may call for greater patience at the greenback’s expense.

The pair is hovering under 1.1800. A break below November’s low at 1.1600 could trigger a new wave of sell-off.

XAUUSD weighed down by rising yields

XAUUSD

Gold remains under pressure as the prospect of monetary tightening lives on. Being a rather usual antipodean to the US dollar’s movement, the precious metal has much to lose if the Fed goes hawkish.

A rising number of Fed officials have already been considering unwinding the massive QE. That would ease fears of inflation and dollar debasement, which in turn would take away the raison d’etre of gold.

Besides, if investors can harvest higher interests from bonds, why would they stick with the non-yielding metal? If the price fails to clear the key hurdle at 1830, it may revisit the critical support at 1680.

NAS 100 rises ahead of key NFP

US100

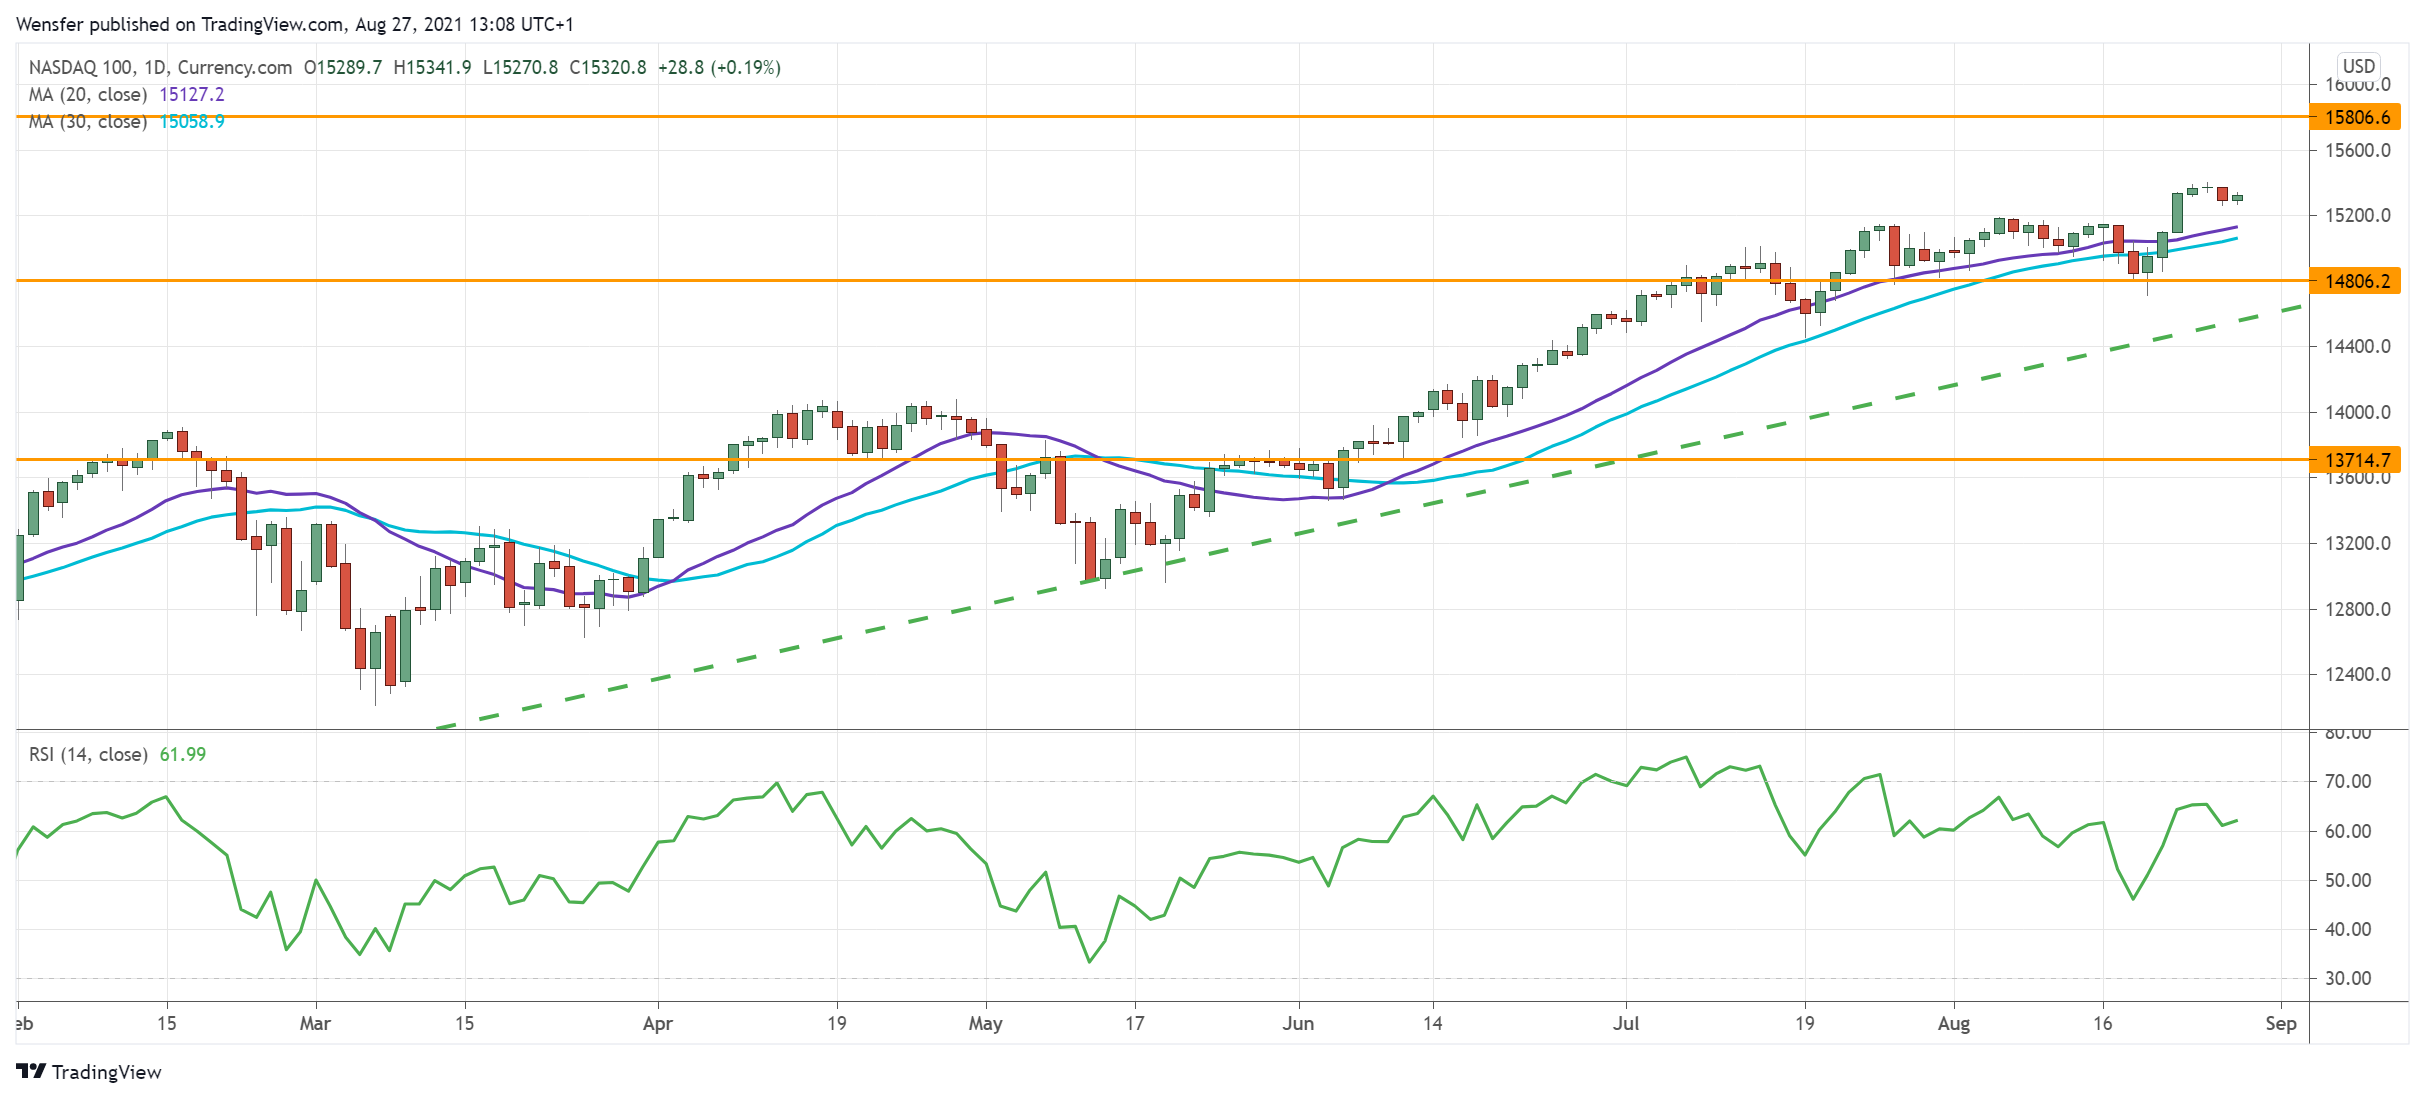
The Nasdaq 100 keeps the high ground in the hope that the liquidity tap will not close soon.

The market’s new all-time high is another reminder that the threat of the pandemic is also an opportunity for cloud and digital-focused companies. As counter-intuitive as it may sound, the macroenvironment would remain bull-friendly as long as labor data instill the right amount of uncertainty.

The day the Fed drops the word ‘transitory’ is probably the day the music stops. The tech index is still grinding up along a rising trendline from March 2020.

15800 would be the next stop, with 14800 as new support.

USOIL recovers as demand stabilizes

USOIL

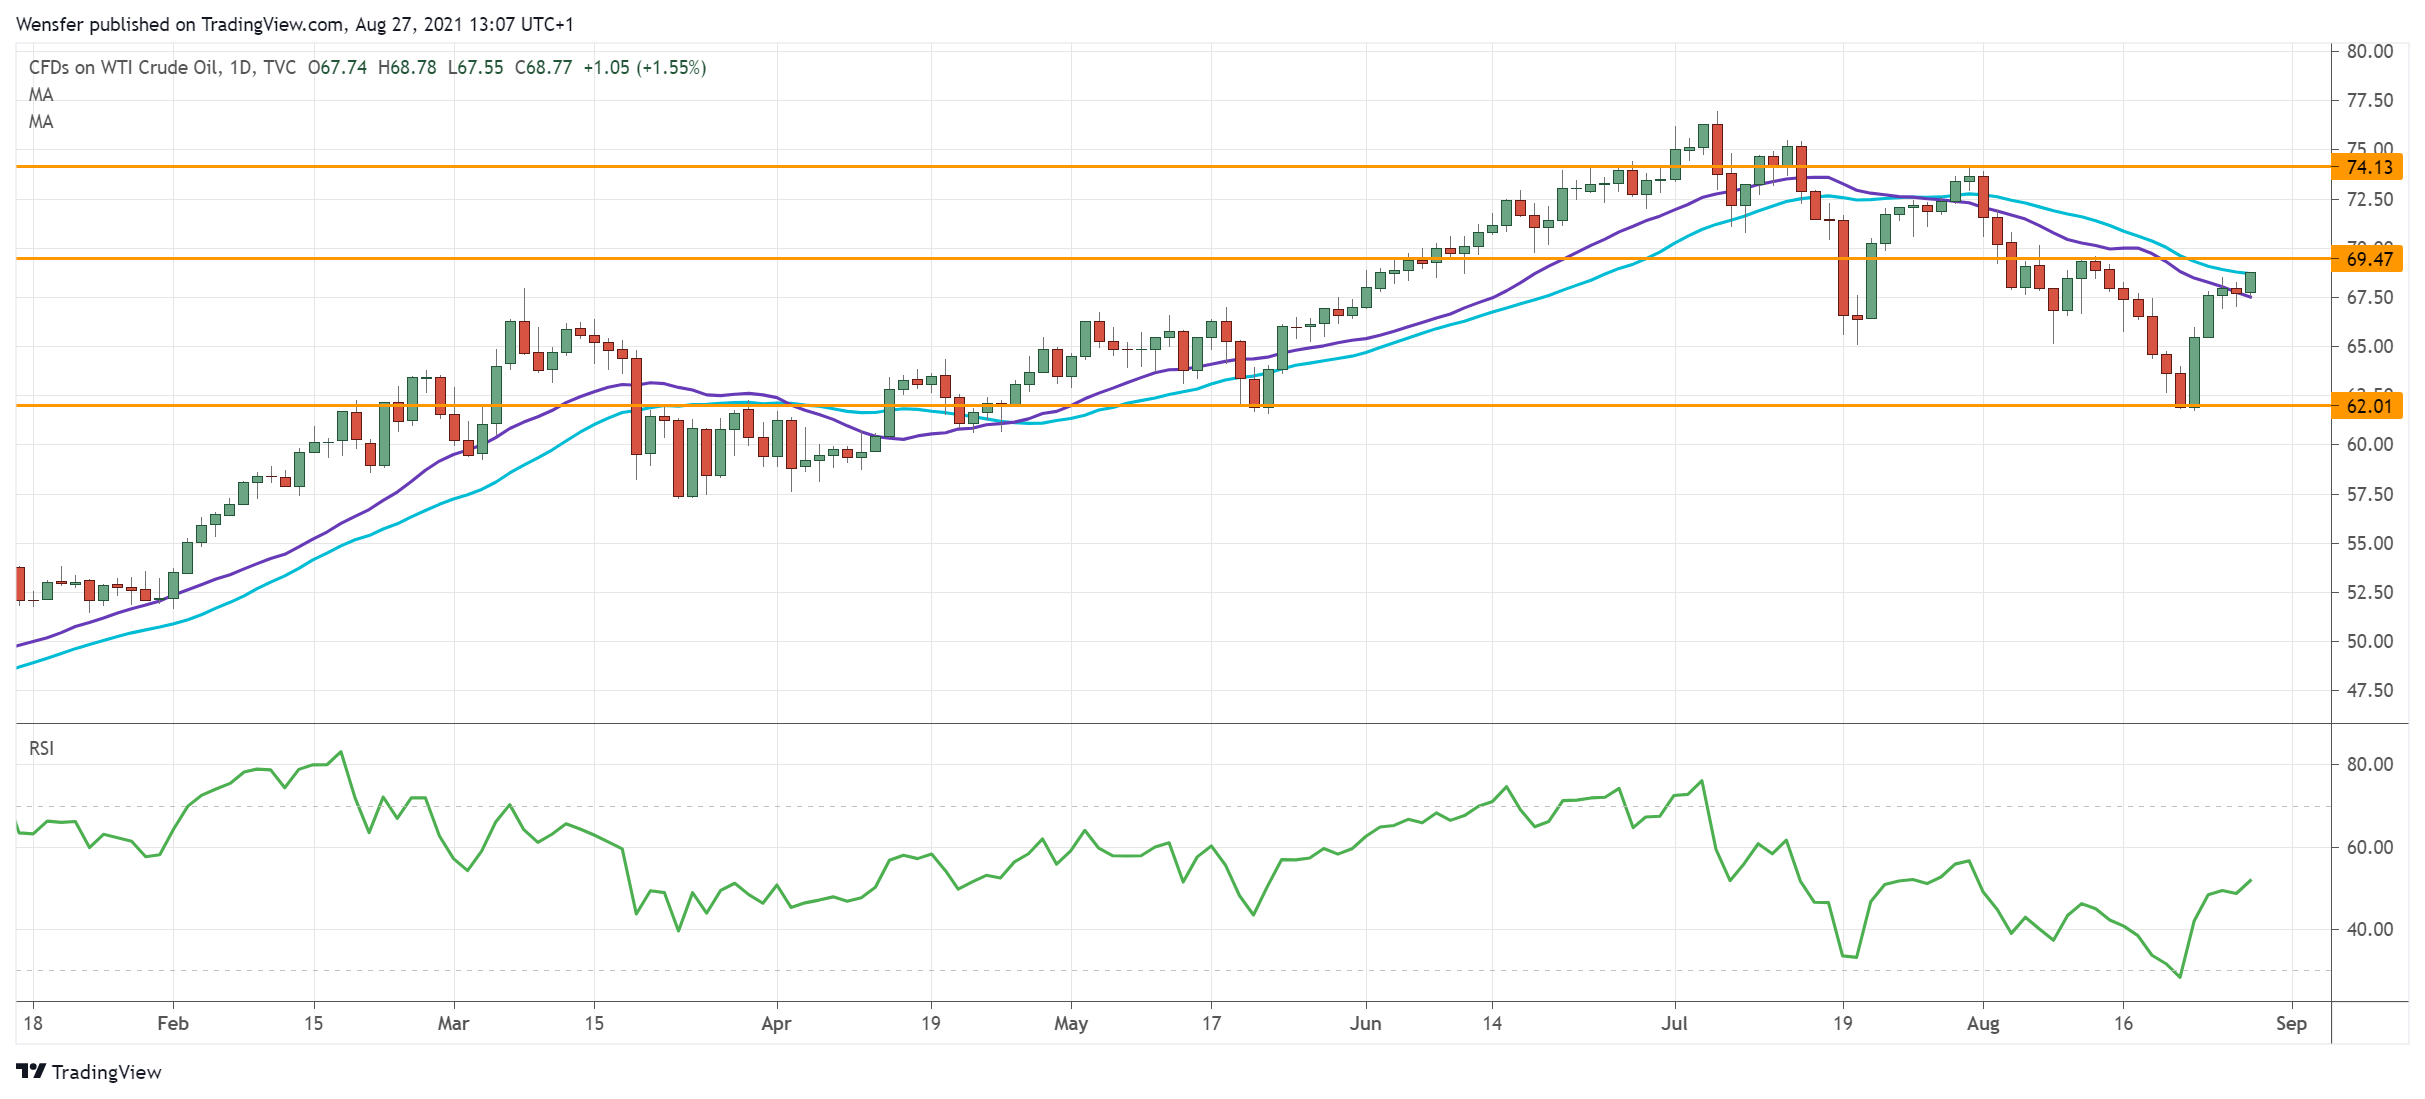
Oil prices rallied as demand has so far proved to be resilient.

A rise in US fuel demand suggests that the recovery is still on track. In fact, the pandemic situation is noticeably better than last summer.

In China (the world’s largest oil importer) low official figures in new infections brighten up the mood. Concerns about a peak in demand could be an exaggeration. On the supply side, a fall in US crude inventories for a third consecutive week will keep the bears in check.

Technical buying-the-dips at May’s low around 62.00 has put a floor to price action. A close above 69.50 could raise offers back to 74.00, a prerequisite for trend continuation.

By Orbex

European Data Day And Potential Market Volatility

By Orbex

Monday could be pretty interesting for European markets, and there is a chance of a strong move in the early European session.

Part of that has to do with the lingering effects of what might come out of the Jackson Hole Symposium, and another is a plethora of different data points coming out throughout the session.

Fed Chairman Jerome Powell will speak before the close of today’s European session. Therefore it’s possible that the “tone” of the Jackson Hole meeting won’t be clear until after the close. And the markets might take some time to digest the implications of any change in policy outlook.

So, we might want to keep an eye on the markets at the start of the session to see if there is any additional reaction to the monetary policy outlook.

The data points

In terms of data that could potentially move the markets on Monday, we start with retail sales from Spain.

We have to remember that Spain was one of the most affected by covid. Nonetheless, it has an increase in demand in summer usually because of higher tourism.

So, better results from Spain might be a reflection of continental improvement in outlook. The periphery is often a bellwether for economic sentiment in the eurozone.

Analysts expect Spanish retail sales to rise by 0.5% in July, compared to 0.2% in June. This would push the annual rate to 3.8% from 1.4%.

Should they meet expectations it would confirm an end to the “normalization” of retail sales. In turn, this would suggest that consumers are returning to a more positive outlook.

Coming off the mountain

Next up is the Swiss KOF leading indicator, measuring the relative optimism of major Swiss business leaders.

Since May, optimism has been tracking lower and economists anticipate it will continue in that trend. As Swiss economic activity normalizes, the positive outlook associated with the recovery would naturally dissipate. That said, the KOF leading indicator is forecast at 120, down from 129.8 in the last reading.

The eurozone consumer confidence comes out after that. And the prediction for that data is to slip further into negative territory.

The rise in delta variants and the refusal of authorities to rule out another round of lockdowns have been impacting consumer outlook. Though it appears consumers are still spending, they aren’t confident about the future.

At some point, retail sales could drop, and pull down inflation. Analysts project the eurozone consumer confidence for August to come in at -5.3, from -4.4 in July.

Rounding things up

Spanish business confidence is next, which economists expect to drop to 1.5 from 1.9 in the previous reading.

If we factor in consumer spending reports from earlier in the day, the suggestion is that Spanish business leaders believe the increase in sales to be transitory. The longer-term impact, should those fears be true, implies less inflation for the euro going through winter.

Speaking of inflation, the final data point is German August flash CPI, which will probably tick slightly higher to 3.9% from 3.8%. Germany has one of the highest inflation rates in the shared economy, buoyed by a stronger recovery.

Overall, we’ll have to wait and see how the European data releases could impact the markets.

By Orbex

How “Hot” Stock Market Ideas Can Burn Investors

The Meme Stock Index sees a 36% decline since January

By Elliott Wave International

On July 30, this headline appeared on a well-known investment website:

It’s Definitely Possible to Make a Fortune Off Meme Stocks

And, it’s definitely true that many investors, especially newbies, have tried.

As you probably know, “meme” stocks may be loosely defined as stocks that become a white-hot focus of interest due to social media hype. The price of these shares can skyrocket within a short period of time. However, as you might imagine, these highly speculative issues can just as quickly turn southward.

Indeed, take a look at this chart from the recently published August Elliott Wave Financial Forecast, a publication which provides Elliott wave analysis of major U.S. financial markets. The accompanying commentary is below the chart:

Legions of new investors continue to chase the latest hot ideas. … Meme stocks are [a] mutant strain reflecting bullish enthusiasm despite price weakness. This chart shows a steady decline in an index of 35 meme stocks. Despite a decline of 36% since January, many headlines in July insist that the “Meme Stock Revolution” lives on.

This is from an August 10 CNBC article:

Short seller Jim Chanos said retail investors are not considering all the downside involved with speculative trading in so-called meme stocks.

Yet, let’s pivot from here and state that all stock market trading is speculative, even with the so-called “blue chips.” In other words, the main stock market indexes can significantly decline just like the meme stock index.

So, while “traditional” investors may largely steer clear of meme stocks, many of them may be unprepared for a possible trend turn in the Dow Industrials and the S&P 500 index.

Why will the majority likely be unprepared? Well, consider this quote from a July 18 Wall Street Journal article:

Throughout 2021, a range of surveys, fund-flow figures and options activity have shown investors big and small to be exceptionally bullish.

The best way to avoid getting caught flatfooted when an inevitable trend change occurs is to see what the Elliott wave model is revealing about the broad market’s price pattern.

If you’re unfamiliar with the Wave Principle, or need to brush up on your knowledge, you can read the online version of Frost & Prechter’s Elliott Wave Principle: Key to Market Behavior100% free!

Here’s a quote from the first page of Chapter 1 of this Wall Street classic:

In the 1930s, Ralph Nelson Elliott discovered that stock market prices trend and reverse in recognizable patterns. The patterns he discerned are repetitive in form but not necessarily in time or amplitude. Elliott isolated five such patterns, or “waves,” that recur in market price data. He named, defined and illustrated these patterns and their variations. He then described how they link together to form larger versions of themselves, how they in turn link to form the same patterns of the next larger size, and so on, producing a structured progression. He called this phenomenon The Wave Principle.

All that’s required for free access to the book is a Club EWI membership. Club EWI is the world’s largest Elliott wave educational community and is free to join. Members enjoy complimentary access to a wealth of Elliott wave resources on financial markets, investing and trading. You are under no obligations as a Club EWI member.

Just follow this link to get started: Elliott Wave Principle: Key to Market Behavior — free, unlimited and instant access.

This article was syndicated by Elliott Wave International and was originally published under the headline How “Hot” Stock Market Ideas Can Burn Investors. EWI is the world’s largest market forecasting firm. Its staff of full-time analysts led by Chartered Market Technician Robert Prechter provides 24-hour-a-day market analysis to institutional and private investors around the world.

AAPL Final Leg Of Primary Correction ④

By Orbex

The AAPL formation hints at a large cycle wave a. This takes the form of an ①-②-③-④-⑤ impulse of the primary degree.

It seems that a bearish correction ④ is currently under construction. It takes the form of an intermediate double three (W)-(X)-(Y).

Perhaps the ascending intervening wave (X) in the form of a double zigzag has come to an end. Thus, in the next coming trading days, the market could fall in the intermediate wave (Y) to 113.26.

At that level, correction ④ will be at 38.2% of primary impulse ③.

After that, the market may turn around and start moving up in the final wave ⑤ significantly above 150.29, which the intervening wave (X) marked.

AAPL

Let’s look at an alternative scenario that assumes that in the process of building a primary fifth wave, it takes the form of ending diagonal (1)-(2)-(3)-(4)-(5) of the intermediate degree.

In the following trading weeks, we can expect a gradual increase in the intermediate sub-waves (4)-(5), as shown on the chart, near 161.15.

By Orbex

Intraday Market Analysis – USD Awaits Catalyst-Breakout

By Orbex

USDJPY about to test resistance

USDJPY

The Japanese yen weakened after a lower-than-expected Tokyo CPI in August. The US dollar is grinding its way back up after the mid-month correction.

A double test at 109.50 suggests strong buying interest. Layers of support indicate buyers’ willingness to pay up, the freshest one is at 109.90.

Momentum has slowed down as the price approaches the major supply area around 110.40. A bullish breakout would tip the balance to the long side again and open up the path to the psychological price tag of 111.00.

AUDUSD rebound cools off

AUDUSD

The Australian dollar fell back after a drop in July’s retail sales numbers.

A close above 0.7270 has forced sellers to cover their bets. The pair is recovering towards the 30-day moving average on the daily chart which coincides with the support-turned-resistance at 0.7320.

However, the rebound is likely to be choppy. After a double top in the overbought area, the RSI’s divergence indicates a loss in the rebound momentum.

A drop below 0.7235 would lead to a deeper correction to 0.7150.

US 30 recoups previous losses

US30

The Dow Jones index pulls back as traders await updates from the Fed’s Jackson Hole meeting.

Price action’s V-shaped rebound is typical of buying-the-dips from the demand zone near 34600. By lifting offers around 35450 the bulls have signaled their commitment to maintaining the uptrend in the medium-term.

The index is seeking support after it erased losses from last week. 35200 is the first support as the RSI dips into the oversold territory.

A break above the peak at 35600 would extend the rally to new all-time highs.

By Orbex

Climate change is an infrastructure problem – map of electric vehicle chargers shows one reason why

By Paul N. Edwards, Stanford University 

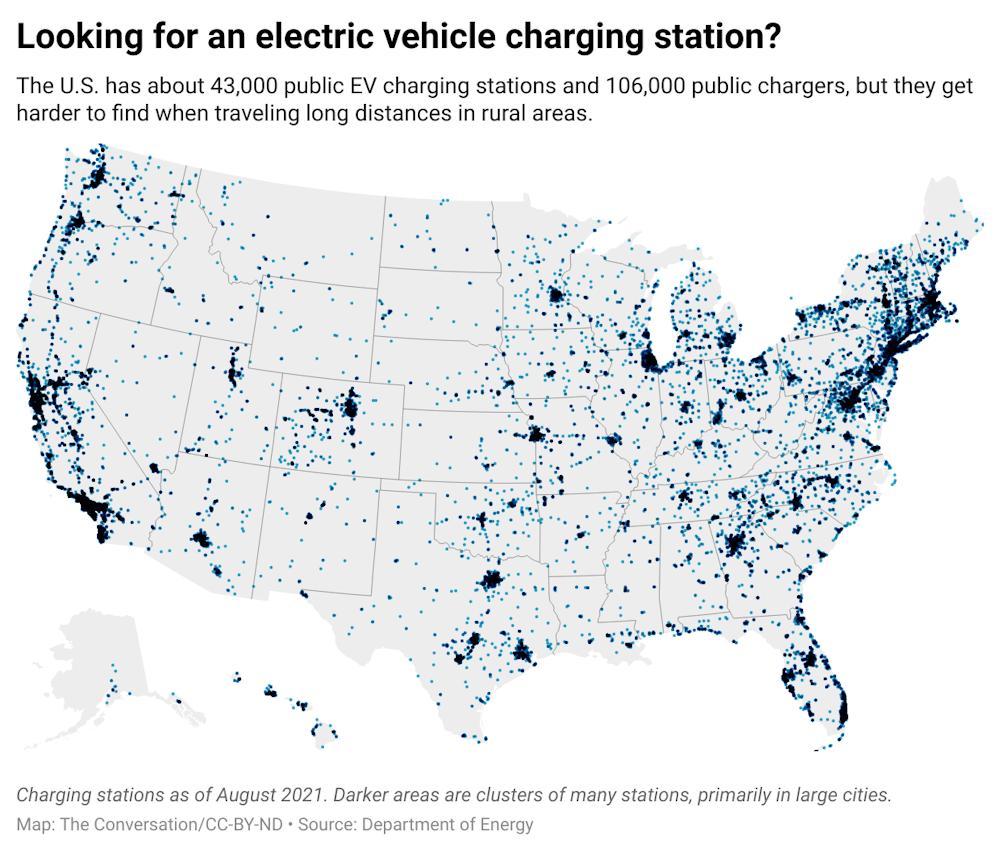
Most of America’s 107,000 gas stations can fill several cars every five or 10 minutes at multiple pumps. Not so for electric vehicle chargers – at least not yet. Today the U.S. has around 43,000 public EV charging stations, with about 106,000 outlets. Each outlet can charge only one vehicle at a time, and even fast-charging outlets take an hour to provide 180-240 miles’ worth of charge; most take much longer.

The existing network is acceptable for many purposes. But chargers are very unevenly distributed; almost a third of all outlets are in California. This makes EVs problematic for long trips, like the 550 miles of sparsely populated desert highway between Reno and Salt Lake City. “Range anxiety” about longer trips is one reason electric vehicles still make up fewer than 1% of U.S. passenger cars and trucks.

This uneven, limited charging infrastructure is one major roadblock to rapid electrification of the U.S. vehicle fleet, considered crucial to reducing the greenhouse gas emissions driving climate change.

It’s also a clear example of how climate change is an infrastructure problem – my specialty as a historian of climate science at Stanford University and editor of the book series “Infrastructures.”

The Conversation, CC BY-ND

Over many decades, the U.S. has built systems of transportation, heating, cooling, manufacturing and agriculture that rely primarily on fossil fuels. The greenhouse gas emissions those fossil fuels release when burned have raised global temperature by about 1.1°C (2°F), with serious consequences for human lives and livelihoods, as the recent report from the U.N. Intergovernmental Panel on Climate Change demonstrates.

The new assessment, like its predecessor Special Report on Global Warming of 1.5°C, shows that minimizing future climate change and its most damaging impacts will require transitioning quickly away from fossil fuels and moving instead to renewable, sustainable energy sources such as wind, solar and tidal power.

That means reimagining how people use energy: how they travel, what and where they build, how they manufacture goods and how they grow food.

Gas stations were transport infrastructure, too

Gas-powered vehicles with internal combustion engines have completely dominated American road transportation for 120 years. That’s a long time for path dependence to set in, as America built out a nationwide system to support vehicles powered by fossil fuels.

Gas stations are only the endpoints of that enormous system, which also comprises oil wells, pipelines, tankers, refineries and tank trucks – an energy production and distribution infrastructure in its own right that also supplies manufacturing, agriculture, heating oil, shipping, air travel and electric power generation.

Without it, your average gas-powered sedan wouldn’t make it from Reno to Salt Lake City either.

Fossil fuel combustion in the transport sector is now America’s largest single source of the greenhouse gas emissions causing climate change. Converting to electric vehicles could reduce those emissions quite a bit. A recent life cycle study found that in the U.S., a 2021 battery EV – charged from today’s power grid – creates only about one-third as much greenhouse gas emissions as a similar 2021 gasoline-powered car. Those emissions will fall even further as more electricity comes from renewable sources.

Despite higher upfront costs, today’s EVs are actually less expensive than gas-powered cars due to their greater energy efficiency and many fewer moving parts. An EV owner can expect to save US$6,000-$10,000 over the car’s lifetime versus a comparable conventional car. Large companies including UPS, FedEx, Amazon and Walmart are already switching to electric delivery vehicles to save money on fuel and maintenance.

All this will be good news for the climate – but only if the electricity to power EVs comes from low-carbon sources such as solar, tidal, geothermal and wind. (Nuclear is also low-carbon, but expensive and politically problematic.) Since our current power grid relies on fossil fuels for about 60% of its generating capacity, that’s a tall order.

To achieve maximal climate benefits, the electric grid won’t just have to supply all the cars that once used fossil fuels. Simultaneously, it will also need to meet rising demand from other fossil fuel switchovers, such as electric water heaters, heat pumps and stoves to replace the millions of similar appliances currently fueled by fossil natural gas.

The infrastructure bill

The 2020 Net-Zero America study from Princeton University estimates that engineering, building and supplying a low-carbon grid that could displace most fossil fuel uses would require an investment of around $600 billion by 2030.

The infrastructure bill now being debated in Congress was originally designed to get partway to that goal. It initially included $157 billion for EVs and $82 billion for power grid upgrades. In addition, $363 billion in clean energy tax credits would have supported low-carbon electric power sources, along with energy storage to provide backup power during periods of high demand or reduced output from renewables. During negotiations, however, the Senate dropped the clean energy credits altogether and slashed EV funding by over 90%.

Of the $15 billion that remains for electric vehicles, $2.5 billion would purchase electric school buses, while a proposed EV charging network of some 500,000 stations would get $7.5 billion – about half the amount needed, according to Energy Secretary Jennifer Granholm.

As for the power grid, the infrastructure bill does include about $27 billion in direct funding and loans to improve grid reliability and climate resilience. It would also create a Grid Development Authority under the U.S. Department of Energy, charged with developing a national grid capable of moving renewable energy throughout the country.

The infrastructure bill may be further modified by the House before it reaches President Joe Biden’s desk, but many of the elements that were dropped have been added to another bill that’s headed for the House: the $3.5 trillion budget plan.

As agreed to by Senate Democrats, that plan incorporates many of the Biden administration’s climate proposals, including tax credits for solar, wind and electric vehicles; a carbon tax on imports; and requirements for utilities to increase the amount of renewables in their energy mix. Senators can approve the budget by simple majority vote during “reconciliation,” though by then it will almost certainly have been trimmed again.

Overall, the bipartisan infrastructure bill looks like a small but genuine down payment on a more climate-friendly transport sector and electric power grid, all of which will take years to build out.

But to claim global leadership in avoiding the worst potential effects of climate change, the U.S. will need at least the much larger commitment promised in the Democrats’ budget plan.

Like an electric car, that commitment will seem expensive upfront. But as the recent IPCC report reminds us, over the long term, the potential savings from avoided climate risks like droughts, floods, wildfires, deadly heat waves and sea level rise would be far, far larger.The Conversation

About the Author:

Paul N. Edwards, William J. Perry Fellow in International Security, Center for International Security and Cooperation, Stanford University

This article is republished from The Conversation under a Creative Commons license. Read the original article.


Fibonacci Retracements Analysis 27.08.2021 (AUDUSD, USDCAD)

Article By RoboForex.com

AUDUSD, “Australian Dollar vs US Dollar”

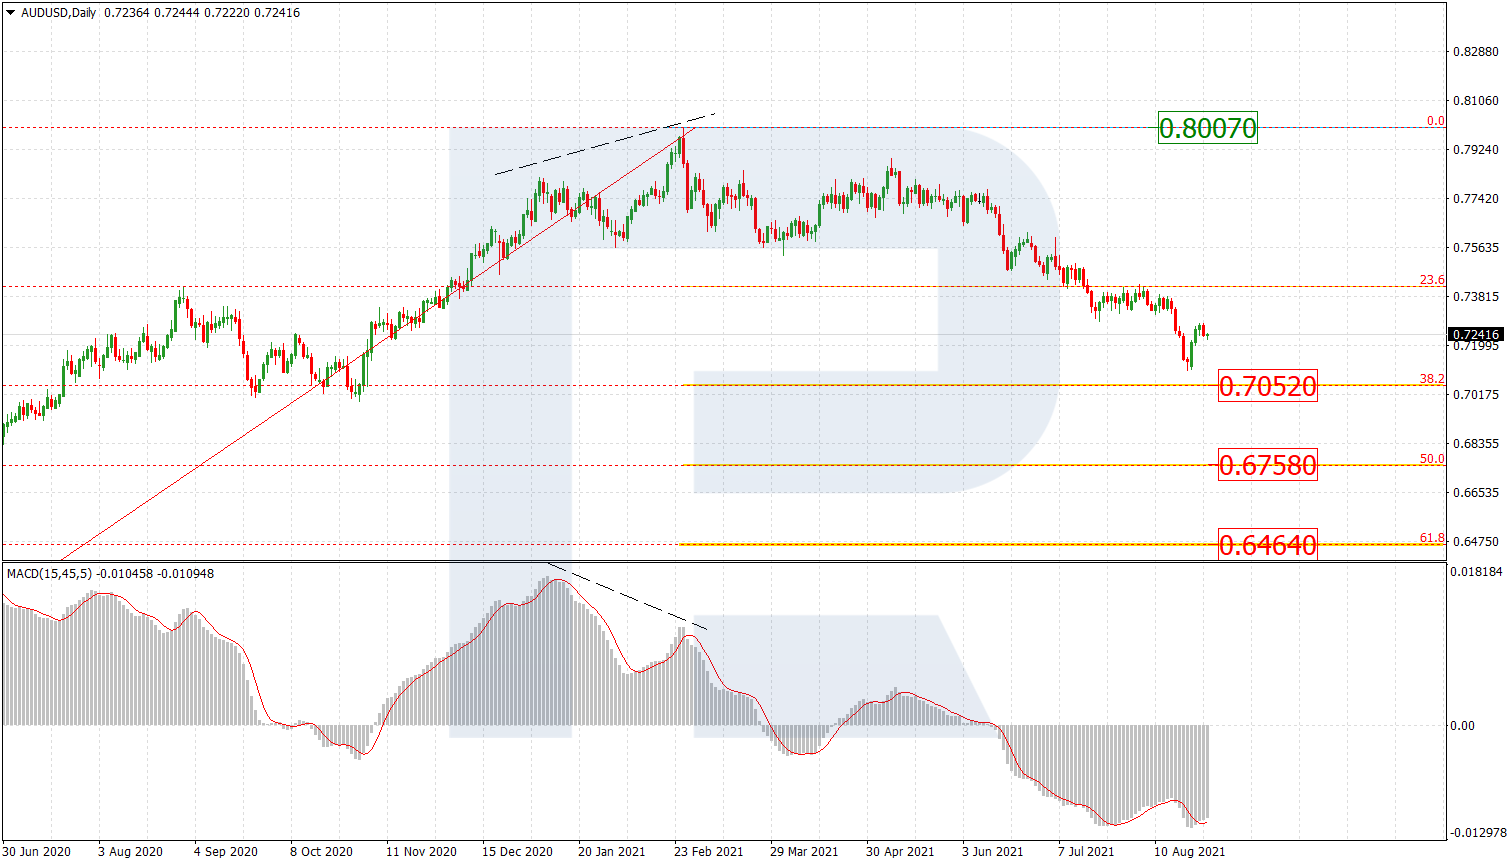
In the daily chart, the downtrend is looking quite stable despite the current correction to the upside, which started after an attempt to test 38.2% at 0.7052. After the pullback is over, the asset may continue trading towards 50.0% and 61.8% fibo at 0.6758 and 0.6464 respectively. The key resistance is the high at 0.8007.

AUDUSD_DAILY
Risk Warning: the result of previous trading operations do not guarantee the same results in the future

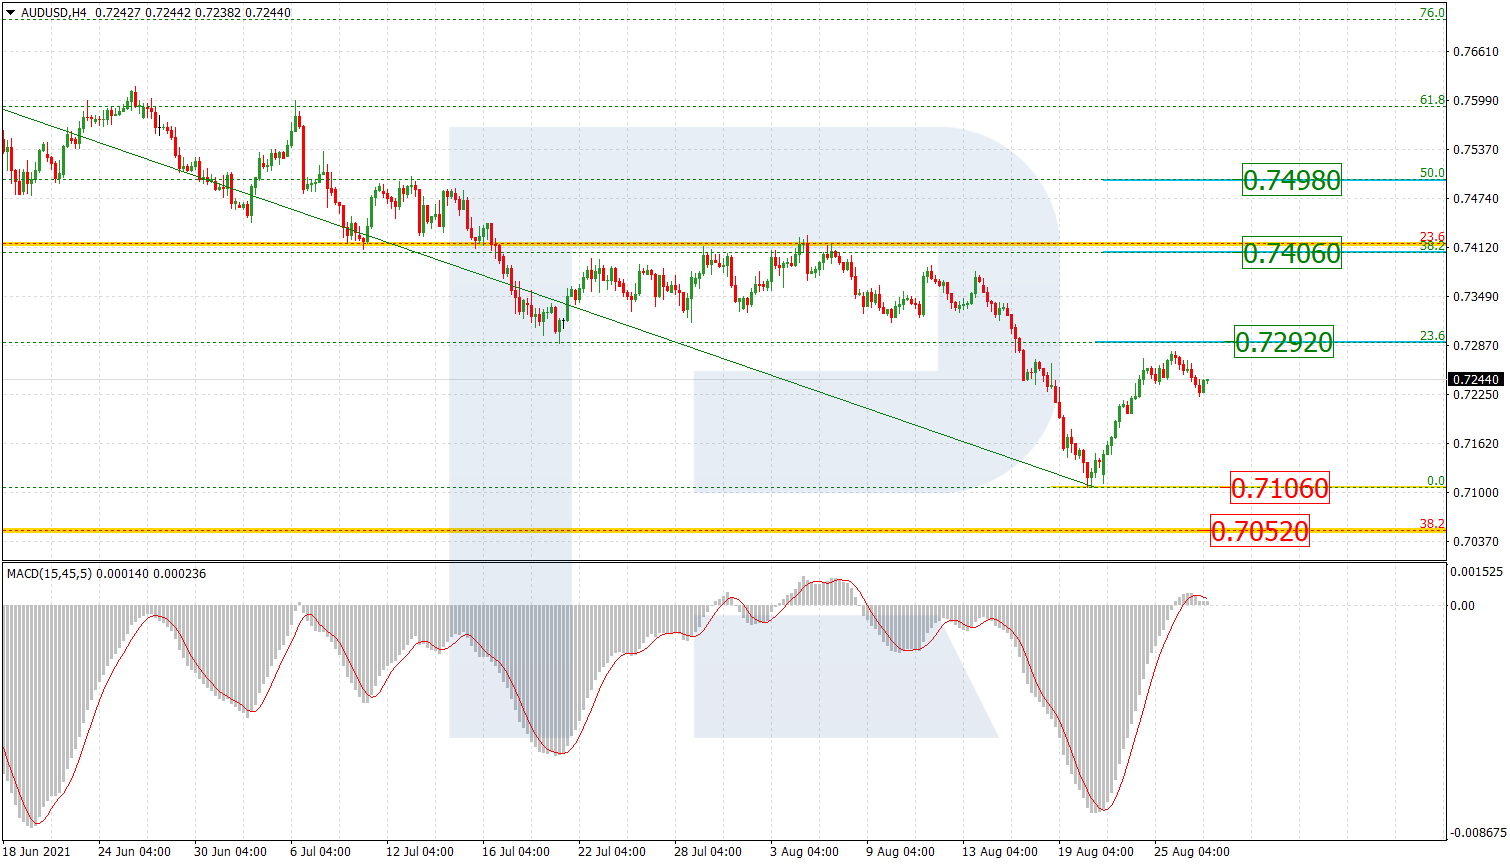
The H4 chart of AUDUSD shows the potential upside correctional targets are convergence on MACD – 23,6%, 38.2%, and 50.0% at 0.7292, 0.7406, and 0.7498 respectively. A breakout of the local support at 0.7106 will lead to a further mid-term downtrend.

AUDUSD_H4
Risk Warning: the result of previous trading operations do not guarantee the same results in the future

USDCAD, “US Dollar vs Canadian Dollar”

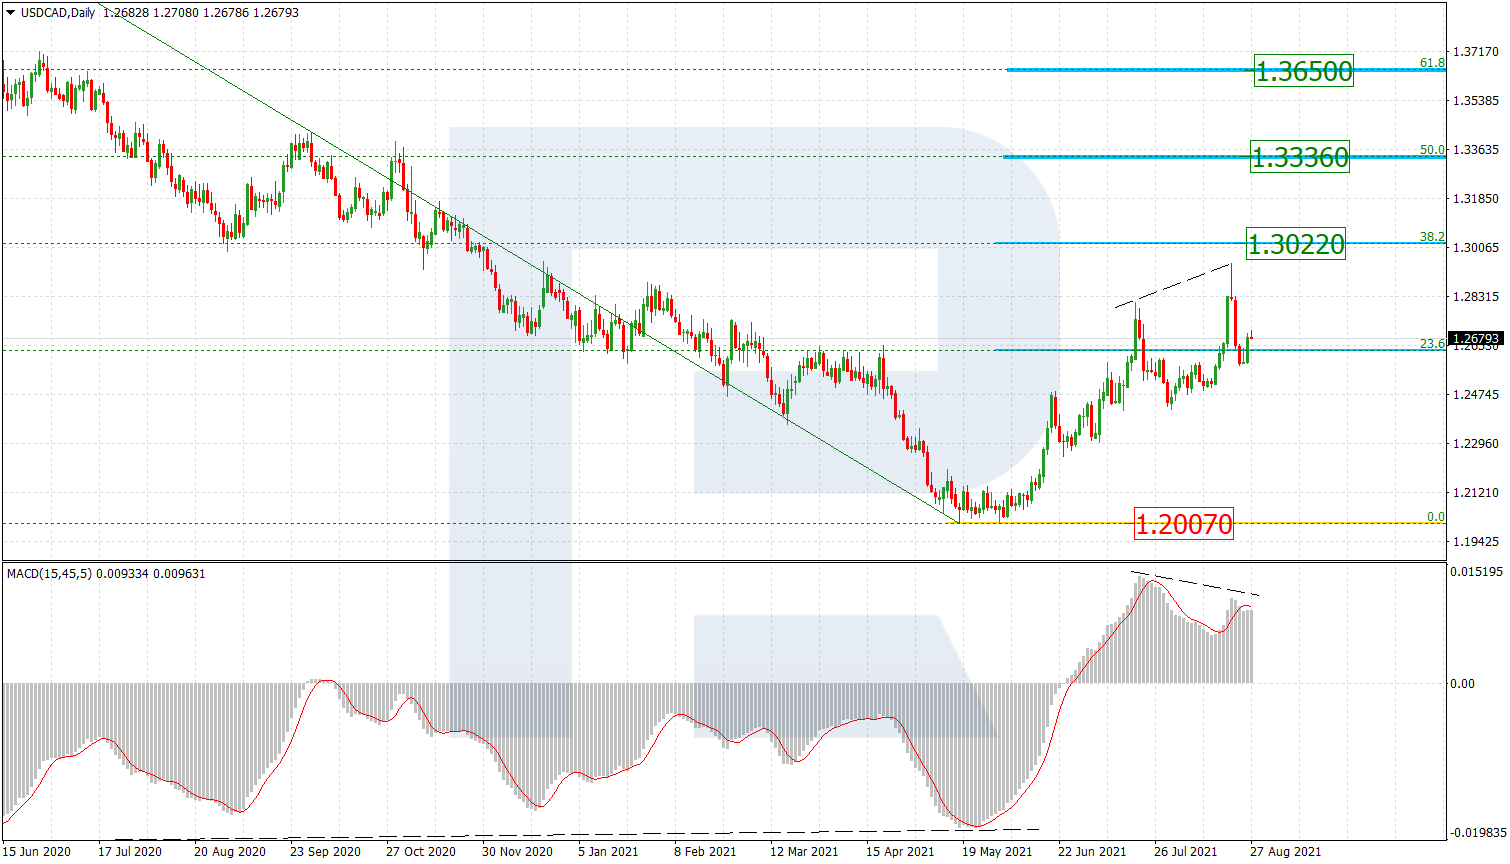
As we can see in the daily chart, after an attempt to reach 38.2% fibo at 1.3022 and local divergence on MACD, the pair is correcting downwards. After finishing the pullback, the asset may form a new wave to the upside with the targets at 50.0% and 61.8% fibo at 1.3336 and 1.3650 respectively. The key support remains at the low at 1.2007.

USDCAD_D1
Risk Warning: the result of previous trading operations do not guarantee the same results in the future

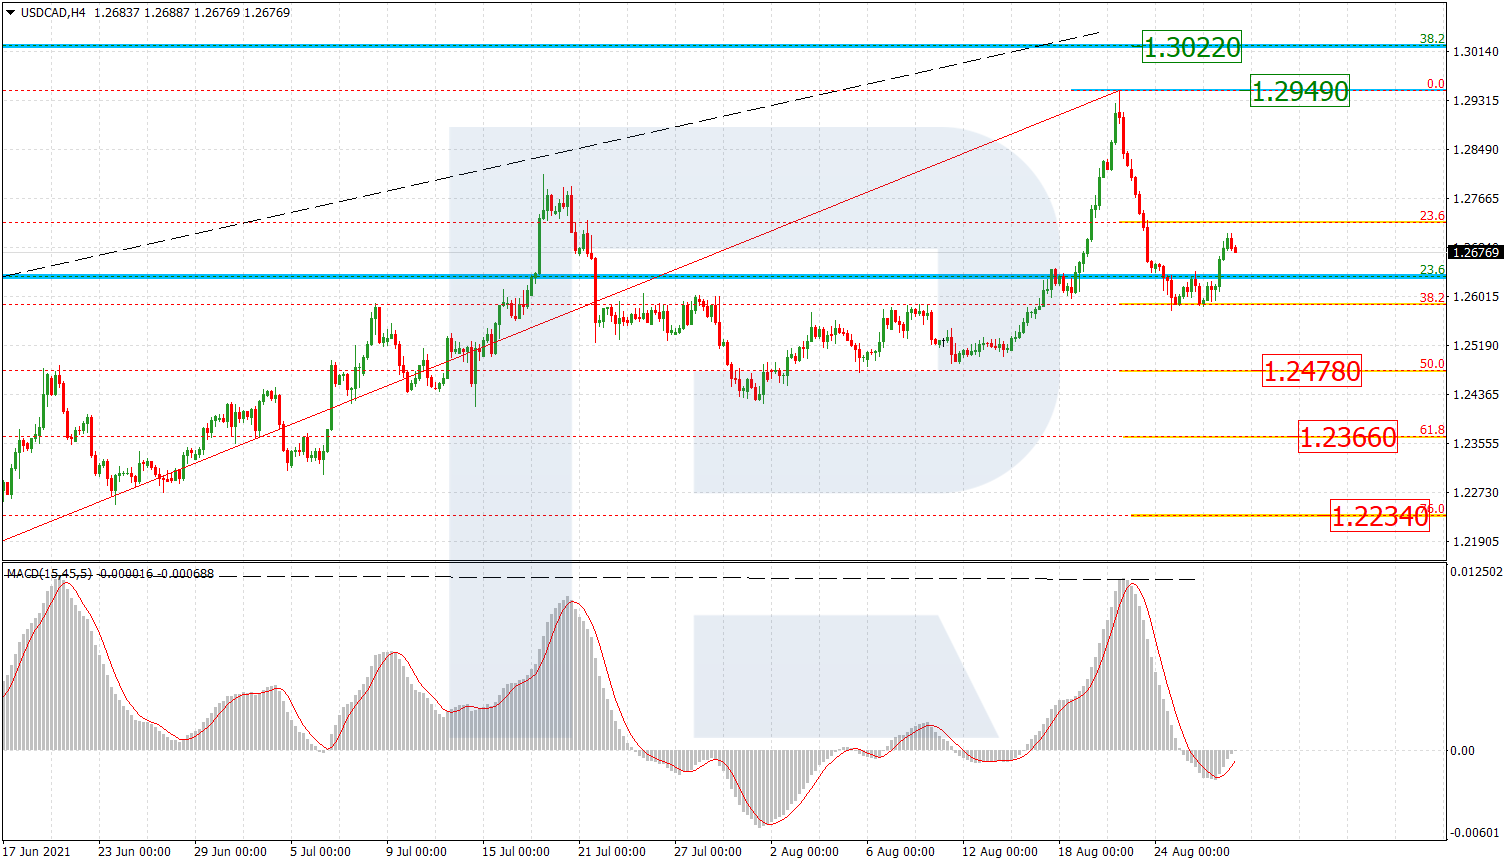
The H4 chart shows the potential targets of the current descending correction. After divergence on MACD, the pair was falling and reached 38.2% but then rebounded from it. The next descending impulse may head towards 50.0%, 61.8%, and 76.0% fibo at 1.2478, 1.2366, and 1.2234 respectively. The local resistance is the fractal high at 1.2949.

USDCAD_H4

Article By RoboForex.com

Attention!
Forecasts presented in this section only reflect the author’s private opinion and should not be considered as guidance for trading. RoboForex LP bears no responsibility for trading results based on trading recommendations described in these analytical reviews.

Ichimoku Cloud Analysis 27.08.2021 (EURUSD, GBPAUD, AUDCAD)

Article By RoboForex.com

EURUSD, “Euro vs US Dollar”

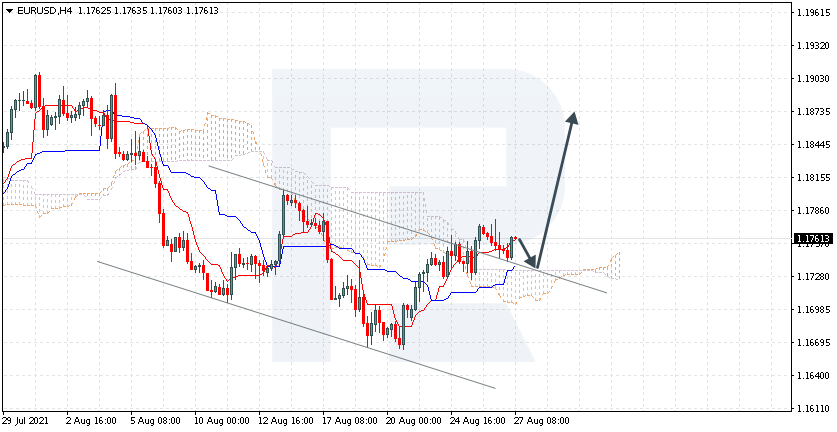
EURUSD is trading at 1.1761; the instrument is moving above Ichimoku Cloud, thus indicating an ascending tendency. The markets could indicate that the price may test the cloud’s upside border at 1.1730 and then resume moving upwards to reach 1.1875. Another signal in favor of a further uptrend will be a rebound from the descending channel’s upside border. However, the bullish scenario may be cancelled if the price breaks the cloud’s downside border and fixes below 1.1675. In this case, the pair may continue falling towards 1.1585.

EURUSD
Risk Warning: the result of previous trading operations do not guarantee the same results in the future

GBPAUD, “Great Britain Pound vs Australian Dollar”

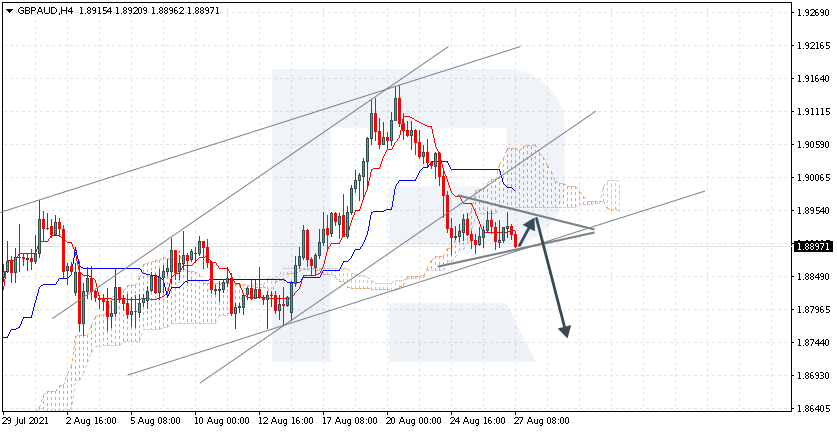
GBPAUD is trading at 1.8897; the instrument is moving below Ichimoku Cloud, thus indicating a descending tendency. The markets could indicate that the price may test Tenkan-Sen and Kijun-Sen at 1.8925 and then resume moving downwards to reach 1.8745. Another signal in favor of a further downtrend will be a rebound from the upside border of a Triangle pattern. However, the bearish scenario may no longer be valid if the price breaks the cloud’s upside border and fixes above 1.9105. In this case, the pair may continue growing towards 1.9205. To confirm further decline, the asset must break the pattern’s downside border and fix below 1.8875.

GBPAUD
Risk Warning: the result of previous trading operations do not guarantee the same results in the future

AUDCAD, “Australian Dollar vs Canadian Dollar”

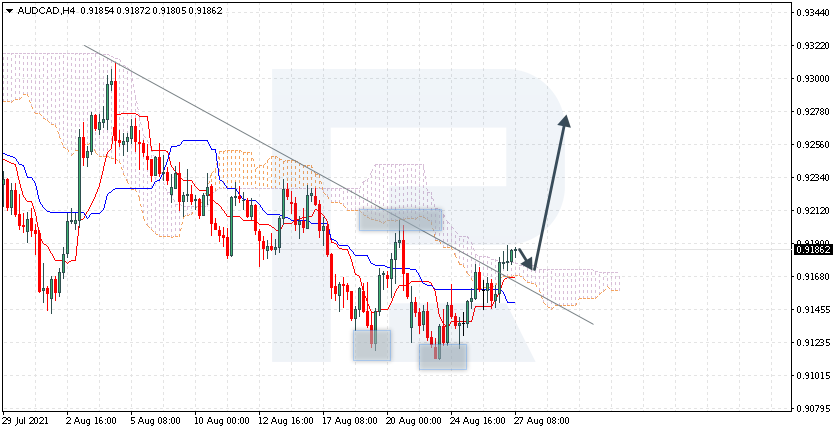
AUDCAD is trading at 0.9186; the instrument is moving above Ichimoku Cloud, thus indicating an ascending tendency. The markets could indicate that the price may test the cloud’s upside border at 0.9165 and then resume moving upwards to reach 0.9275. Another signal in favor of a further uptrend will be a rebound from the descending trendline. However, the bullish scenario may no longer be valid if the price breaks the cloud’s downside border and fixes below 0.9125. In this case, the pair may continue falling towards 0.9095. To confirm further growth, the asset must break the resistance level and fix above 0.9230, thus completing the formation of a Double Bottom reversal pattern.

AUDCAD

Article By RoboForex.com

Attention!
Forecasts presented in this section only reflect the author’s private opinion and should not be considered as guidance for trading. RoboForex LP bears no responsibility for trading results based on trading recommendations described in these analytical reviews.

Today, all investors’ attention is focused on the Jerome Powel’s speech on the results of the symposium in Jackson Hole

by JustForex

The number of initial jobless claims in the US slightly increased to 353,000 from 349,000 last week. But these figures are still at pre-crisis levels, indicating a stable labor market situation. US GDP year-on-year increased to 6.6% (previous 6.5%), although this is below economists’ expectations of 6.7%. The head of the Fed, Jerome Powell, will give a speech today following the symposium in Jackson Hole. This verbal intervention may increase the volatility in the financial markets. If nothing will be mentioned about the reduction of the QE program or if Mr. Powell will indicate that it is too early to speak about it and better labor market numbers are needed, the dollar index will rally down, and stock indices will jump. And vice versa, if Mr. Powell says that the QE program reduction is scheduled to start this year, in this case, the dollar index will jump sharply, while the stock indices will go down. Analysts believe that the central bank will seek to begin reducing monthly bond purchases this year to avoid having to catch up with the market later and risk more aggressive steps to curb inflation.

Investors were cautious in the stock markets yesterday, with some investors starting to trim their portfolios, which caused a short-term decline in indices. As a result, the S&P 500 decreased by 0.58%, the Dow Jones lost 0.54%, and the Nasdaq fell by 0.6%.

Thursday’s US military losses were the first in Afghanistan since February 2020 and represented the deadliest day for US troops in a decade. Some critics blamed Joe Biden for the hasty evacuation that threatened the lives of Americans in Afghanistan providing security at the Kabul airport.

Ahead of Mr. Powell’s speech, European stock indexes also decreased yesterday. The Stoxx Europe 600 composite index of the region’s largest companies lost 0.32%. The British FTSE 100 index decreased by 0.35%, German DAX lost 0.16%, French CAC 40 fell by 0.42%. Spanish IBEX 35 and Italian FTSE MIB fell by 0.94% and 0.76%, respectively. Deutsche Bank shares decreased by 2.3% on news of an inspection of the bank’s unit by the US Securities and Exchange Commission (SEC) on information that the bank exaggerated its use of ESG criteria in investing. The EU is considering reintroducing restrictions for US tourists visiting European countries. On the back of this news, stocks of European tourist companies fell yesterday.

Oil rising in price and finishing the week with a steady increase. The Chinese authorities were able to contain the wave of delta strain, and analysts at Goldman Sachs and UBS still expect oil prices to rise until the end of 2021, as the supply on the market will be insufficient.

Gold added 0.15% yesterday, hitting $1,793.60 per troy ounce. Gold and silver price dynamics are highly dependent on the dynamics of the dollar index and US Treasury bond yields. If the Fed keeps its soft monetary policy, gold prices will continue to rise. On the contrary, if the Fed announces cuts to its QE program this year, gold could see large sales.

Retail sales in Australia fell in July due to the spread of the delta strain. The New Zealand dollar slightly decreased after the country’s prime minister announced a quarantine in Auckland, the country’s largest city, which is likely to remain in place for another two weeks.

Main market quotes:

S&P 500 (F) 4,470.00 -26.19 (-0.58%)

Dow Jones 35,213.12 -192.38 (-0.54%)

DAX 15,793.62 -67.04 (-0.42%)

FTSE 100 7,124.98 -25.14 (-0.35%)

USD Index 93.05 +0.22 (+0.24%)

Important events for today:
  • – Jackson Hole Symposium (Day 2);
  • – Australia Retail Sales (m/m) at 04:30 (GMT+3);
  • – US PCE price index (m/m) at 15:30 (GMT+3);
  • – US Fed Chair Jerome Powell’s speech at 17:00 (GMT+3);
  • – US Michigan Consumer Sentiment (m/m) at 17:00 (GMT+3).

by JustForex


This article reflects a personal opinion and should not be interpreted as an investment advice, and/or offer, and/or a persistent request for carrying out financial transactions, and/or a guarantee, and/or a forecast of future events.