
By CountingPips.com COT Home | Data Tables | Data Downloads | Newsletter
Here are the latest charts and statistics for the Commitment of Traders (COT) data published by the Commodities Futures Trading Commission (CFTC).
The latest COT data is updated through Tuesday August 24 2021 and shows a quick view of how large traders (for-profit speculators and commercial entities) were positioned in the futures markets.
CORN Futures:
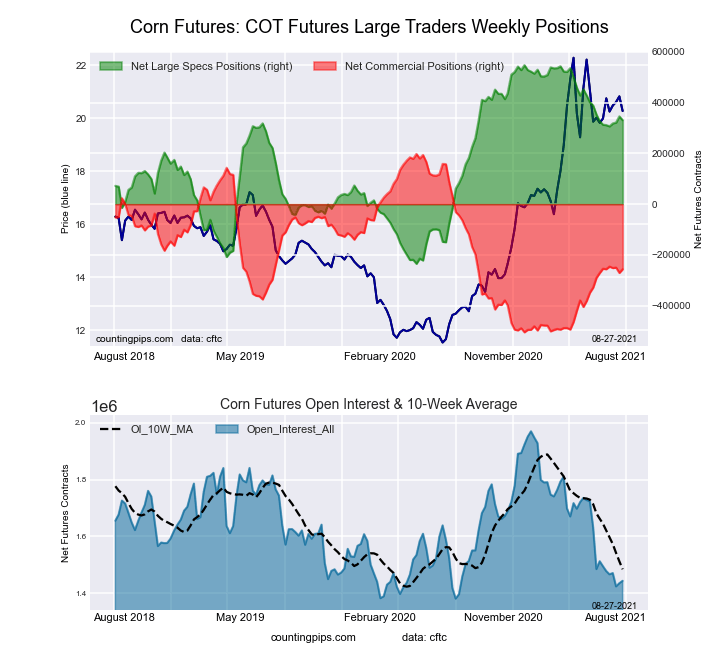 The CORN large speculator standing this week recorded a net position of 330,967 contracts in the data reported through Tuesday. This was a weekly fall of -14,879 contracts from the previous week which had a total of 345,846 net contracts.
This week’s current strength score (the trader positioning range over the past three years, measured from 0 to 100) shows the speculators are currently Bullish with a score of 72.3 percent. The commercials are Bearish with a score of 35.3 percent and the small traders (not shown in chart) are Bearish-Extreme with a score of 0.3 percent.
| CORN Futures Statistics | SPECULATORS | COMMERCIALS | SMALL TRADERS |
| – Percent of Open Interest Longs: | 29.1 | 47.4 | 7.7 |
| – Percent of Open Interest Shorts: | 6.1 | 65.2 | 12.9 |
| – Net Position: | 330,967 | -256,700 | -74,267 |
| – Gross Longs: | 419,537 | 684,905 | 111,865 |
| – Gross Shorts: | 88,570 | 941,605 | 186,132 |
| – Long to Short Ratio: | 4.7 to 1 | 0.7 to 1 | 0.6 to 1 |
| NET POSITION TREND: | |||
| – COT Index Score (3 Year Range Pct): | 72.3 | 35.3 | 0.3 |
| – COT Index Reading (3 Year Range): | Bullish | Bearish | Bearish-Extreme |
| NET POSITION MOVEMENT INDEX: | |||
| – 6-Week Change in Strength Index: | 2.3 | -0.3 | -9.1 |
Free Reports:
 Download Our Metatrader 4 Indicators – Put Our Free MetaTrader 4 Custom Indicators on your charts when you join our Weekly Newsletter
 Get our Weekly Commitment of Traders Reports - See where the biggest traders (Hedge Funds and Commercial Hedgers) are positioned in the futures markets on a weekly basis.
SUGAR Futures:
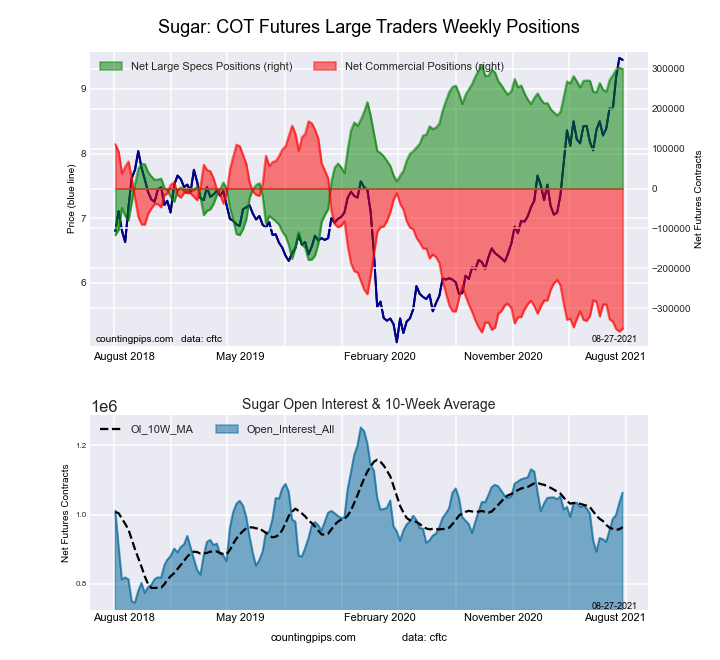 The SUGAR large speculator standing this week recorded a net position of 299,077 contracts in the data reported through Tuesday. This was a weekly decrease of -3,190 contracts from the previous week which had a total of 302,267 net contracts.
This week’s current strength score (the trader positioning range over the past three years, measured from 0 to 100) shows the speculators are currently Bullish-Extreme with a score of 98.1 percent. The commercials are Bearish-Extreme with a score of 1.7 percent and the small traders (not shown in chart) are Bullish with a score of 71.3 percent.
| SUGAR Futures Statistics | SPECULATORS | COMMERCIALS | SMALL TRADERS |
| – Percent of Open Interest Longs: | 31.9 | 43.5 | 9.1 |
| – Percent of Open Interest Shorts: | 3.8 | 76.4 | 4.2 |
| – Net Position: | 299,077 | -350,435 | 51,358 |
| – Gross Longs: | 338,985 | 462,375 | 96,543 |
| – Gross Shorts: | 39,908 | 812,810 | 45,185 |
| – Long to Short Ratio: | 8.5 to 1 | 0.6 to 1 | 2.1 to 1 |
| NET POSITION TREND: | |||
| – COT Index Score (3 Year Range Pct): | 98.1 | 1.7 | 71.3 |
| – COT Index Reading (3 Year Range): | Bullish-Extreme | Bearish-Extreme | Bullish |
| NET POSITION MOVEMENT INDEX: | |||
| – 6-Week Change in Strength Index: | 10.7 | -11.4 | 10.2 |
COFFEE Futures:
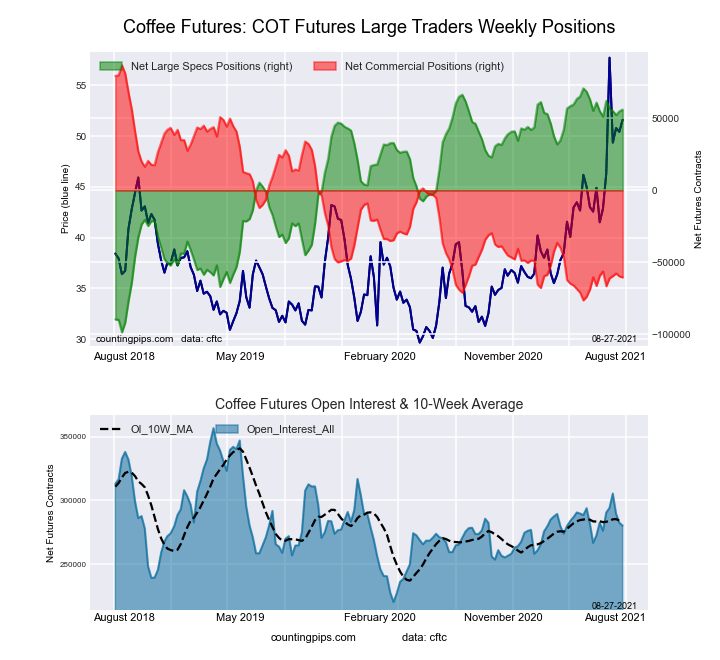 The COFFEE large speculator standing this week recorded a net position of 56,012 contracts in the data reported through Tuesday. This was a weekly increase of 1,215 contracts from the previous week which had a total of 54,797 net contracts.
This week’s current strength score (the trader positioning range over the past three years, measured from 0 to 100) shows the speculators are currently Bullish-Extreme with a score of 91.3 percent. The commercials are Bearish-Extreme with a score of 9.8 percent and the small traders (not shown in chart) are Bearish-Extreme with a score of 18.6 percent.
| COFFEE Futures Statistics | SPECULATORS | COMMERCIALS | SMALL TRADERS |
| – Percent of Open Interest Longs: | 27.1 | 45.0 | 4.0 |
| – Percent of Open Interest Shorts: | 7.1 | 66.6 | 2.4 |
| – Net Position: | 56,012 | -60,389 | 4,377 |
| – Gross Longs: | 75,855 | 126,199 | 11,105 |
| – Gross Shorts: | 19,843 | 186,588 | 6,728 |
| – Long to Short Ratio: | 3.8 to 1 | 0.7 to 1 | 1.7 to 1 |
| NET POSITION TREND: | |||
| – COT Index Score (3 Year Range Pct): | 91.3 | 9.8 | 18.6 |
| – COT Index Reading (3 Year Range): | Bullish-Extreme | Bearish-Extreme | Bearish-Extreme |
| NET POSITION MOVEMENT INDEX: | |||
| – 6-Week Change in Strength Index: | 2.8 | -2.5 | -4.7 |
SOYBEANS Futures:
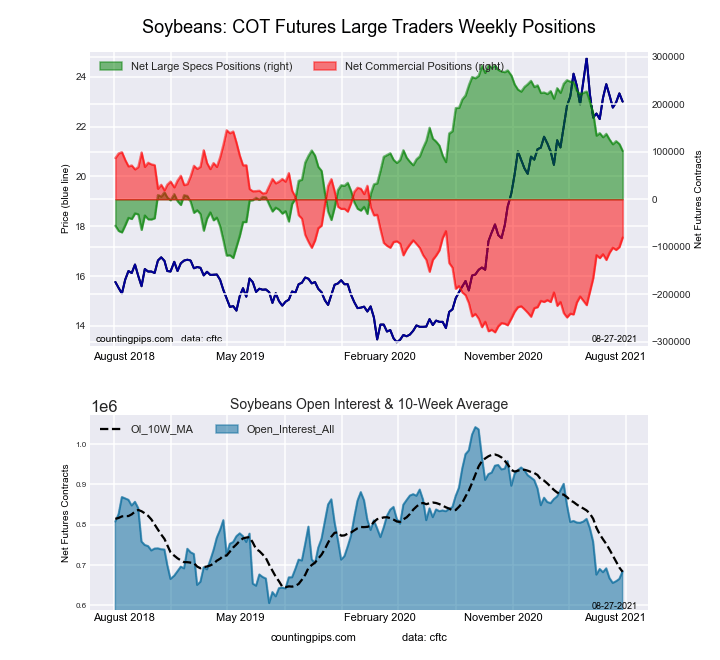 The SOYBEANS large speculator standing this week recorded a net position of 101,647 contracts in the data reported through Tuesday. This was a weekly fall of -14,757 contracts from the previous week which had a total of 116,404 net contracts.
This week’s current strength score (the trader positioning range over the past three years, measured from 0 to 100) shows the speculators are currently Bullish with a score of 55.5 percent. The commercials are Bearish with a score of 46.9 percent and the small traders (not shown in chart) are Bearish with a score of 36.5 percent.
| SOYBEANS Futures Statistics | SPECULATORS | COMMERCIALS | SMALL TRADERS |
| – Percent of Open Interest Longs: | 25.6 | 54.3 | 6.5 |
| – Percent of Open Interest Shorts: | 10.8 | 66.1 | 9.6 |
| – Net Position: | 101,647 | -80,417 | -21,230 |
| – Gross Longs: | 175,251 | 372,081 | 44,299 |
| – Gross Shorts: | 73,604 | 452,498 | 65,529 |
| – Long to Short Ratio: | 2.4 to 1 | 0.8 to 1 | 0.7 to 1 |
| NET POSITION TREND: | |||
| – COT Index Score (3 Year Range Pct): | 55.5 | 46.9 | 36.5 |
| – COT Index Reading (3 Year Range): | Bullish | Bearish | Bearish |
| NET POSITION MOVEMENT INDEX: | |||
| – 6-Week Change in Strength Index: | -7.2 | 8.3 | -10.2 |
SOYBEAN OIL Futures:
 The SOYBEAN OIL large speculator standing this week recorded a net position of 65,048 contracts in the data reported through Tuesday. This was a weekly boost of 482 contracts from the previous week which had a total of 64,566 net contracts.
This week’s current strength score (the trader positioning range over the past three years, measured from 0 to 100) shows the speculators are currently Bullish with a score of 63.9 percent. The commercials are Bearish with a score of 38.9 percent and the small traders (not shown in chart) are Bearish with a score of 39.5 percent.
| SOYBEAN OIL Futures Statistics | SPECULATORS | COMMERCIALS | SMALL TRADERS |
| – Percent of Open Interest Longs: | 24.1 | 48.5 | 7.3 |
| – Percent of Open Interest Shorts: | 8.8 | 65.4 | 5.7 |
| – Net Position: | 65,048 | -72,023 | 6,975 |
| – Gross Longs: | 102,475 | 206,533 | 31,217 |
| – Gross Shorts: | 37,427 | 278,556 | 24,242 |
| – Long to Short Ratio: | 2.7 to 1 | 0.7 to 1 | 1.3 to 1 |
| NET POSITION TREND: | |||
| – COT Index Score (3 Year Range Pct): | 63.9 | 38.9 | 39.5 |
| – COT Index Reading (3 Year Range): | Bullish | Bearish | Bearish |
| NET POSITION MOVEMENT INDEX: | |||
| – 6-Week Change in Strength Index: | 2.6 | -1.5 | -8.2 |
SOYBEAN MEAL Futures:
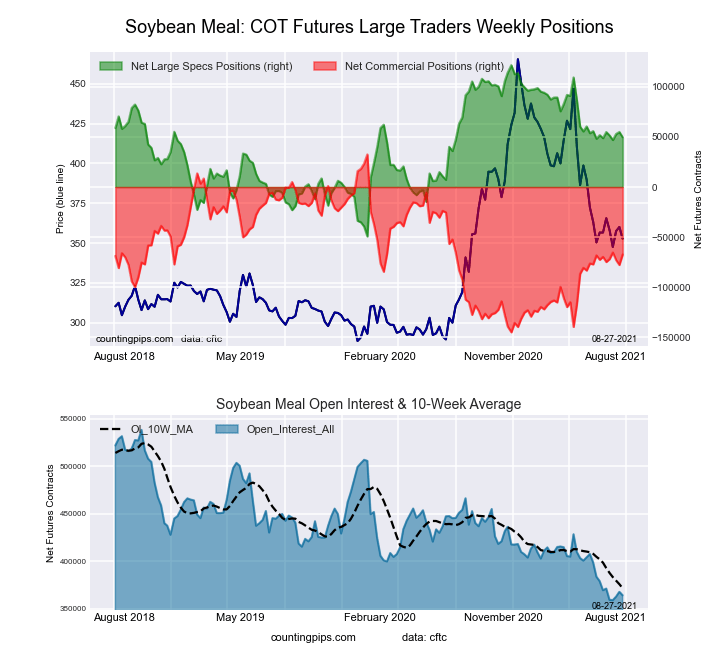 The SOYBEAN MEAL large speculator standing this week recorded a net position of 49,708 contracts in the data reported through Tuesday. This was a weekly decrease of -5,239 contracts from the previous week which had a total of 54,947 net contracts.
This week’s current strength score (the trader positioning range over the past three years, measured from 0 to 100) shows the speculators are currently Bullish with a score of 57.9 percent. The commercials are Bearish with a score of 43.7 percent and the small traders (not shown in chart) are Bearish with a score of 41.5 percent.
| SOYBEAN MEAL Futures Statistics | SPECULATORS | COMMERCIALS | SMALL TRADERS |
| – Percent of Open Interest Longs: | 22.8 | 51.3 | 12.4 |
| – Percent of Open Interest Shorts: | 9.1 | 69.8 | 7.6 |
| – Net Position: | 49,708 | -67,400 | 17,692 |
| – Gross Longs: | 82,975 | 186,898 | 45,240 |
| – Gross Shorts: | 33,267 | 254,298 | 27,548 |
| – Long to Short Ratio: | 2.5 to 1 | 0.7 to 1 | 1.6 to 1 |
| NET POSITION TREND: | |||
| – COT Index Score (3 Year Range Pct): | 57.9 | 43.7 | 41.5 |
| – COT Index Reading (3 Year Range): | Bullish | Bearish | Bearish |
| NET POSITION MOVEMENT INDEX: | |||
| – 6-Week Change in Strength Index: | 0.5 | 1.3 | -13.0 |
LIVE CATTLE Futures:
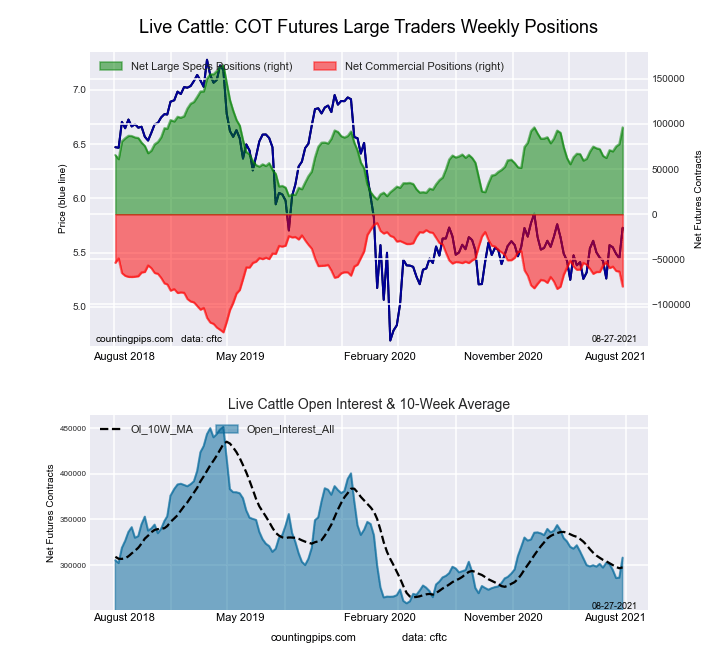 The LIVE CATTLE large speculator standing this week recorded a net position of 96,218 contracts in the data reported through Tuesday. This was a weekly advance of 18,433 contracts from the previous week which had a total of 77,785 net contracts.
This week’s current strength score (the trader positioning range over the past three years, measured from 0 to 100) shows the speculators are currently Bullish with a score of 53.6 percent. The commercials are Bearish with a score of 41.9 percent and the small traders (not shown in chart) are Bearish with a score of 47.9 percent.
| LIVE CATTLE Futures Statistics | SPECULATORS | COMMERCIALS | SMALL TRADERS |
| – Percent of Open Interest Longs: | 42.3 | 37.2 | 8.4 |
| – Percent of Open Interest Shorts: | 11.1 | 63.2 | 13.6 |
| – Net Position: | 96,218 | -80,141 | -16,077 |
| – Gross Longs: | 130,451 | 114,704 | 25,824 |
| – Gross Shorts: | 34,233 | 194,845 | 41,901 |
| – Long to Short Ratio: | 3.8 to 1 | 0.6 to 1 | 0.6 to 1 |
| NET POSITION TREND: | |||
| – COT Index Score (3 Year Range Pct): | 53.6 | 41.9 | 47.9 |
| – COT Index Reading (3 Year Range): | Bullish | Bearish | Bearish |
| NET POSITION MOVEMENT INDEX: | |||
| – 6-Week Change in Strength Index: | 21.2 | -19.0 | -20.7 |
LEAN HOGS Futures:
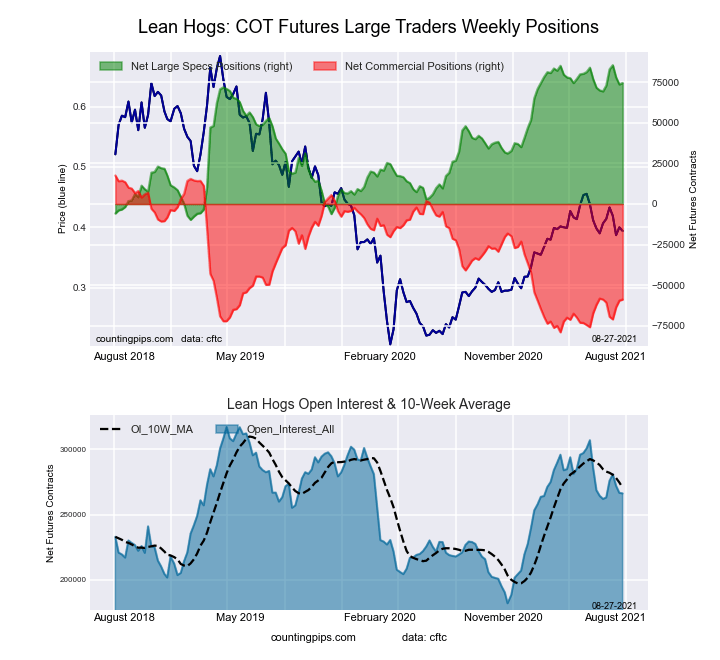 The LEAN HOGS large speculator standing this week recorded a net position of 74,630 contracts in the data reported through Tuesday. This was a weekly advance of 905 contracts from the previous week which had a total of 73,725 net contracts.
This week’s current strength score (the trader positioning range over the past three years, measured from 0 to 100) shows the speculators are currently Bullish-Extreme with a score of 88.5 percent. The commercials are Bearish with a score of 20.9 percent and the small traders (not shown in chart) are Bearish-Extreme with a score of 3.4 percent.
| LEAN HOGS Futures Statistics | SPECULATORS | COMMERCIALS | SMALL TRADERS |
| – Percent of Open Interest Longs: | 45.1 | 30.5 | 6.9 |
| – Percent of Open Interest Shorts: | 17.1 | 52.6 | 12.8 |
| – Net Position: | 74,630 | -58,935 | -15,695 |
| – Gross Longs: | 120,074 | 81,209 | 18,297 |
| – Gross Shorts: | 45,444 | 140,144 | 33,992 |
| – Long to Short Ratio: | 2.6 to 1 | 0.6 to 1 | 0.5 to 1 |
| NET POSITION TREND: | |||
| – COT Index Score (3 Year Range Pct): | 88.5 | 20.9 | 3.4 |
| – COT Index Reading (3 Year Range): | Bullish-Extreme | Bearish | Bearish-Extreme |
| NET POSITION MOVEMENT INDEX: | |||
| – 6-Week Change in Strength Index: | 5.4 | -0.1 | -24.1 |
COTTON Futures:
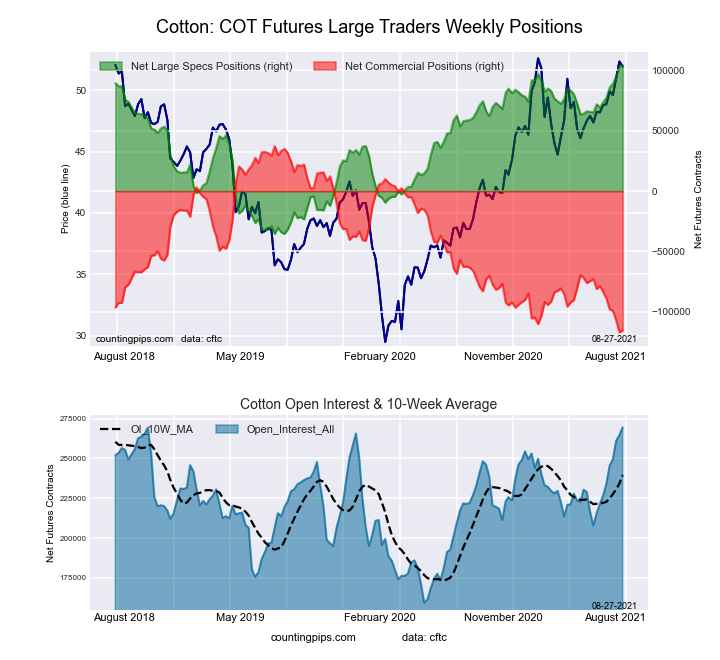 The COTTON large speculator standing this week recorded a net position of 104,309 contracts in the data reported through Tuesday. This was a weekly advance of 1,278 contracts from the previous week which had a total of 103,031 net contracts.
This week’s current strength score (the trader positioning range over the past three years, measured from 0 to 100) shows the speculators are currently Bullish-Extreme with a score of 100.0 percent. The commercials are Bearish-Extreme with a score of 0.9 percent and the small traders (not shown in chart) are Bullish-Extreme with a score of 83.0 percent.
| COTTON Futures Statistics | SPECULATORS | COMMERCIALS | SMALL TRADERS |
| – Percent of Open Interest Longs: | 44.7 | 36.2 | 7.0 |
| – Percent of Open Interest Shorts: | 6.0 | 79.0 | 2.9 |
| – Net Position: | 104,309 | -115,441 | 11,132 |
| – Gross Longs: | 120,528 | 97,532 | 18,814 |
| – Gross Shorts: | 16,219 | 212,973 | 7,682 |
| – Long to Short Ratio: | 7.4 to 1 | 0.5 to 1 | 2.4 to 1 |
| NET POSITION TREND: | |||
| – COT Index Score (3 Year Range Pct): | 100.0 | 0.9 | 83.0 |
| – COT Index Reading (3 Year Range): | Bullish-Extreme | Bearish-Extreme | Bullish-Extreme |
| NET POSITION MOVEMENT INDEX: | |||
| – 6-Week Change in Strength Index: | 22.0 | -20.7 | 7.8 |
COCOA Futures:
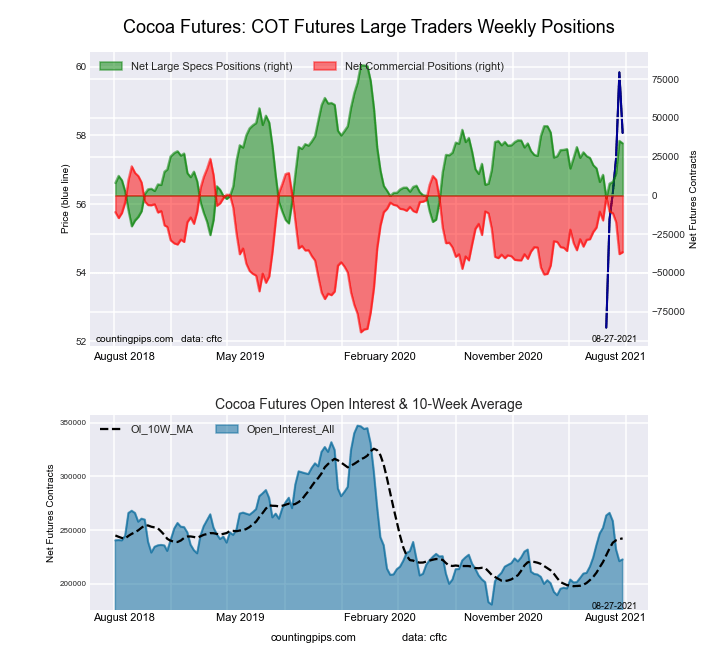 The COCOA large speculator standing this week recorded a net position of 33,655 contracts in the data reported through Tuesday. This was a weekly decrease of -1,540 contracts from the previous week which had a total of 35,195 net contracts.
This week’s current strength score (the trader positioning range over the past three years, measured from 0 to 100) shows the speculators are currently Bullish with a score of 54.0 percent. The commercials are Bearish with a score of 46.2 percent and the small traders (not shown in chart) are Bearish with a score of 41.7 percent.
| COCOA Futures Statistics | SPECULATORS | COMMERCIALS | SMALL TRADERS |
| – Percent of Open Interest Longs: | 31.2 | 51.4 | 5.0 |
| – Percent of Open Interest Shorts: | 16.1 | 67.9 | 3.7 |
| – Net Position: | 33,655 | -36,575 | 2,920 |
| – Gross Longs: | 69,449 | 114,475 | 11,240 |
| – Gross Shorts: | 35,794 | 151,050 | 8,320 |
| – Long to Short Ratio: | 1.9 to 1 | 0.8 to 1 | 1.4 to 1 |
| NET POSITION TREND: | |||
| – COT Index Score (3 Year Range Pct): | 54.0 | 46.2 | 41.7 |
| – COT Index Reading (3 Year Range): | Bullish | Bearish | Bearish |
| NET POSITION MOVEMENT INDEX: | |||
| – 6-Week Change in Strength Index: | 18.5 | -18.3 | 1.8 |
WHEAT Futures:
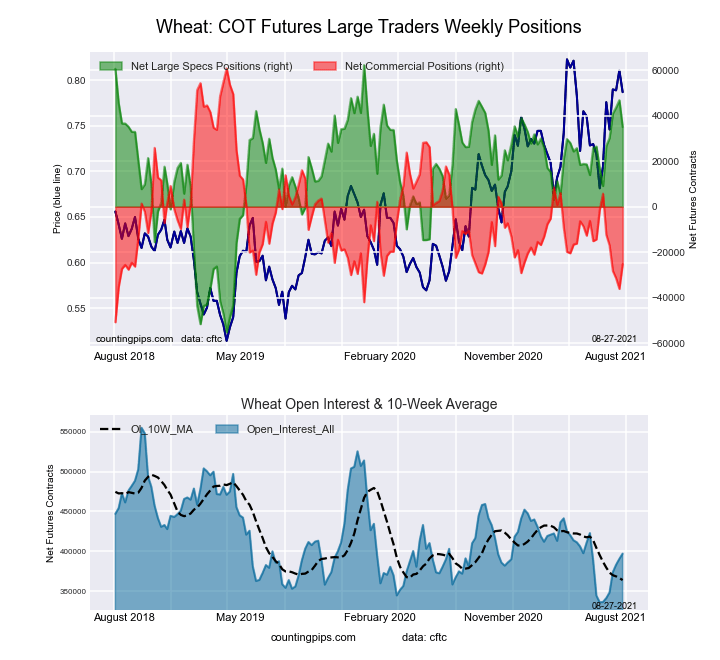 The WHEAT large speculator standing this week recorded a net position of 35,048 contracts in the data reported through Tuesday. This was a weekly decrease of -11,746 contracts from the previous week which had a total of 46,794 net contracts.
This week’s current strength score (the trader positioning range over the past three years, measured from 0 to 100) shows the speculators are currently Bullish with a score of 76.9 percent. The commercials are Bearish with a score of 22.9 percent and the small traders (not shown in chart) are Bullish with a score of 54.6 percent.
| WHEAT Futures Statistics | SPECULATORS | COMMERCIALS | SMALL TRADERS |
| – Percent of Open Interest Longs: | 33.5 | 35.9 | 7.7 |
| – Percent of Open Interest Shorts: | 24.7 | 42.3 | 10.2 |
| – Net Position: | 35,048 | -25,214 | -9,834 |
| – Gross Longs: | 133,081 | 142,668 | 30,683 |
| – Gross Shorts: | 98,033 | 167,882 | 40,517 |
| – Long to Short Ratio: | 1.4 to 1 | 0.8 to 1 | 0.8 to 1 |
| NET POSITION TREND: | |||
| – COT Index Score (3 Year Range Pct): | 76.9 | 22.9 | 54.6 |
| – COT Index Reading (3 Year Range): | Bullish | Bearish | Bullish |
| NET POSITION MOVEMENT INDEX: | |||
| – 6-Week Change in Strength Index: | 22.1 | -27.7 | 23.8 |
Article By CountingPips.com – Receive our weekly COT Reports by Email
*COT Report: The COT data, released weekly to the public each Friday, is updated through the most recent Tuesday (data is 3 days old) and shows a quick view of how large speculators or non-commercials (for-profit traders) were positioned in the futures markets.
The CFTC categorizes trader positions according to commercial hedgers (traders who use futures contracts for hedging as part of the business), non-commercials (large traders who speculate to realize trading profits) and nonreportable traders (usually small traders/speculators).
Find CFTC criteria here: (http://www.cftc.gov/MarketReports/CommitmentsofTraders/ExplanatoryNotes/index.htm).

- COT Metals Charts: Weekly Speculator Bets led by Copper & Steel Jul 18, 2026
- COT Bonds Charts: Weekly Speculator Bets led by 2-Year, SOFR 3M & 5-Year Bonds Jul 18, 2026
- COT Energy Charts: Weekly Speculator Bets led by Brent Oil & Heating Oil Jul 18, 2026
- COT Soft Commodities Charts: Weekly Speculator Bets led by Wheat, Corn & Soybean Meal Jul 18, 2026
- The Bank of Canada kept its interest rate unchanged. Platinum prices reached a three‑week high Jul 16, 2026
- Stock indices rose after the release of US inflation data. China’s GDP slowed sharply Jul 15, 2026
- GBP/USD Awaits Political News: What Will Happen Next Jul 15, 2026
- USD/JPY Holds at Highs: Pressure Lingers on Yen Jul 14, 2026
- Oil prices jumped 4% amid a new wave of escalation between the US and Iran Jul 13, 2026
- EUR/USD: US Inflation Will Determine Everything Jul 13, 2026