Real Estate ETFs React To Rising Mortgage Rates – Part I

By TheTechnicalTraders 

– US Mortgage Rates have risen from levels near 2% to 2.25% earlier in 2021 to levels now above 3%. This increase in the cost of borrowing money for home purchases has a downward effect on home prices and sales. The affordability of homes is directly related to the sales price and the cost of the mortgage to secure the purchase of the home. As interest rates rise, home affordability becomes less attractive and feasible for many potential buyers, and home prices start to fall in an attempt to allow a quicker sale.

The Making Of Another US/Global Housing Crisis

The easiest way to think about this is to consider the ability of buyers to secure and satisfy mortgage payments for homes. The more expensive the sales price of the home and the interest rate of the loan is, the more likely the affordability of the home is going to be perceived as undesirable.

Sign up for my free trading newsletter so you don’t miss the next opportunity to learn more!

As concerns related to the US economy, and the indication by the US Federal Reserve that rates will likely start to increase before the end of 2021 or very early in 2022, mortgage rates have already increased by nearly 45% over the past 60 days. A $500k home would have cost about $2500 a month at a 2.25% mortgage rate (including property taxes, homeowners insurance, mortgage insurance, and principal & interest). That same $500k home costs more than $2700 a month at a 3.25% interest rate (including all fees and costs).

Over the lifetime of the loan, the total costs of buying the $500k home have now increased by more than $70k for the buyer. If rates rise to 4.25%, the new monthly cost of that same $500k home rises to nearly $3000 per month. Raising the total cost of buying that $500k home by more than $180k over the lifetime of the loan for the new buyer.

Home prices will usually fall while interest rates rise because new buyers are unable to secure the loans at rates that far exceed their ability to repay the loans. In short, the past 5+ years of extremely low-interest rates have driven home prices towards upward extremes and the rising interest rates are putting downward pricing pressures on home prices faster than many traders and homeowners understand.

Affordability & Income Growth Are Keys To The Equation

The median income for US households was just under $69k in 2019. That breaks down to $5,725 per month in total income. When average home prices are rising and interest rates are rising at the same time, the affordability of buying a home starts to collapse the DEMAND side of the equation.

As I’ve explained in the previous paragraphs, even a simple 0.5% to 1% interest rate increase can push home affordability off the chart for average buyers. This creates a dual dynamic for buyers and sellers. If sellers want to sell their homes, they have to price them where buyers are willing to engage and can afford the payments. Secondarily, buyers will look at homes and determine if they are getting their money’s worth in terms of costs and features. If potential buyers can’t afford a $500k home, they’ll start looking for cheaper homes in other areas.

(Source: https://policyadvice.net/insurance/insights/average-american-income/)

This process of pricing homes in a manner that is suitable for the market operates along the SUPPLY/DEMAND equity curve. As prices rise and costs rise, affordability becomes a serious issue for buyers. Rising rates typically result in a moderate decrease in home prices over time. Sellers that want to sell their home must price it at a level that attracts buyers. If the Real Estate market starts to see decreasing home values over an extended period of time, this may push buyers into thinking the housing market is starting to collapse after years of price appreciation. That may push potential buyers into waiting for the best deal as sellers continue to adjust home prices to attract more buyers. It becomes a vicious cycle of “where’s the bottom” if it goes on long enough.

In Part II of this article, we’ll take a look at some Real Estate ETFs that are starting to show signs of a downward price trend and attempt to see if the US Fed’s future actions could shift the housing market into a decline.

Please take a minute to learn about my BAN Trader Pro newsletter service and how it can help you identify and trade better sector setups.  My team and I have built this strategy to help us identify the strongest and best trade setups in any market sector.  Every day, we deliver these setups to our subscribers along with the BAN Trader Pro system trades.  You owe it to yourself to see how simple it is to trade 30% to 40% of the time to generate incredible results.

As something entirely new, check out my initiative URLYstart to learn more about the youth entrepreneurship program I am developing. This is an online program of gamified entrepreneurship designed to introduce and inspire youth to start their own businesses. Click-by-click, each student will be guided from their initial idea, through the startup process all the way to their first sale and beyond. Along the way, our students will learn life lessons such as communication, perseverance, goal setting, teamwork, and more. My team and I are passionate about this project and want to reach as many people as possible!

Have a great day!

Chris Vermeulen
Chief Market Strategist

TheTechnicalTraders.com

Japanese Candlesticks Analysis 06.10.2021 (XAUUSD, NZDUSD, GBPUSD)

Article By RoboForex.com

XAUUSD, “Gold vs US Dollar”

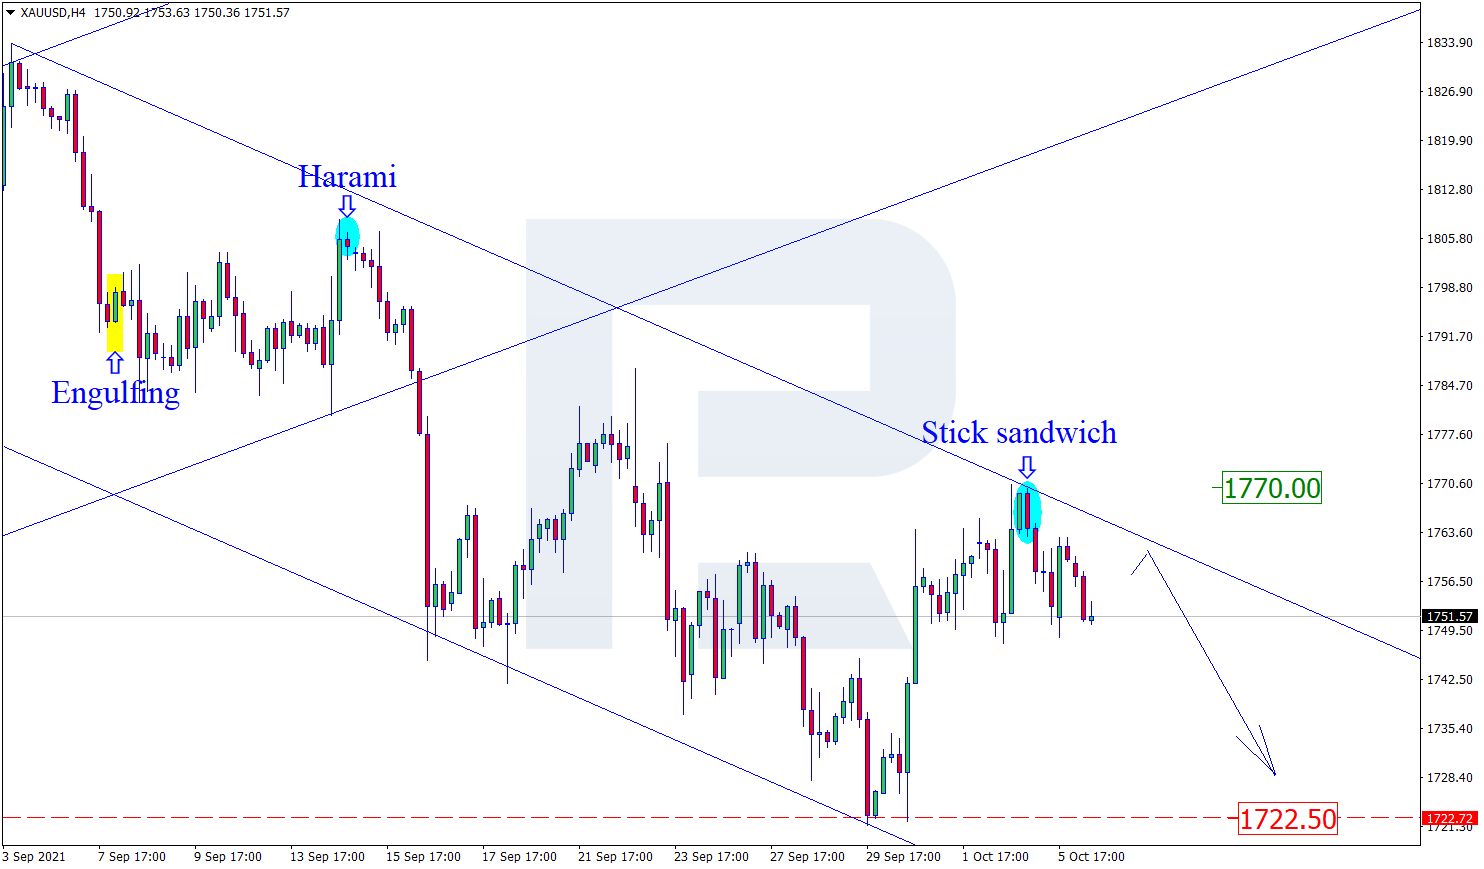
As we can see in the H4 chart, the asset is finishing the correctional wave. After forming several reversal patterns, such as Stick Sandwich, not far from the resistance level, XAUUSD may reverse and resume falling. In this case, the downside target may be the support area at 1722.50. At the same time, an opposite scenario implies that the price may grow towards 1770.00 first and then resume trading downwards.

XAUUSD
Risk Warning: the result of previous trading operations do not guarantee the same results in the future

NZDUSD, “New Zealand vs US Dollar”

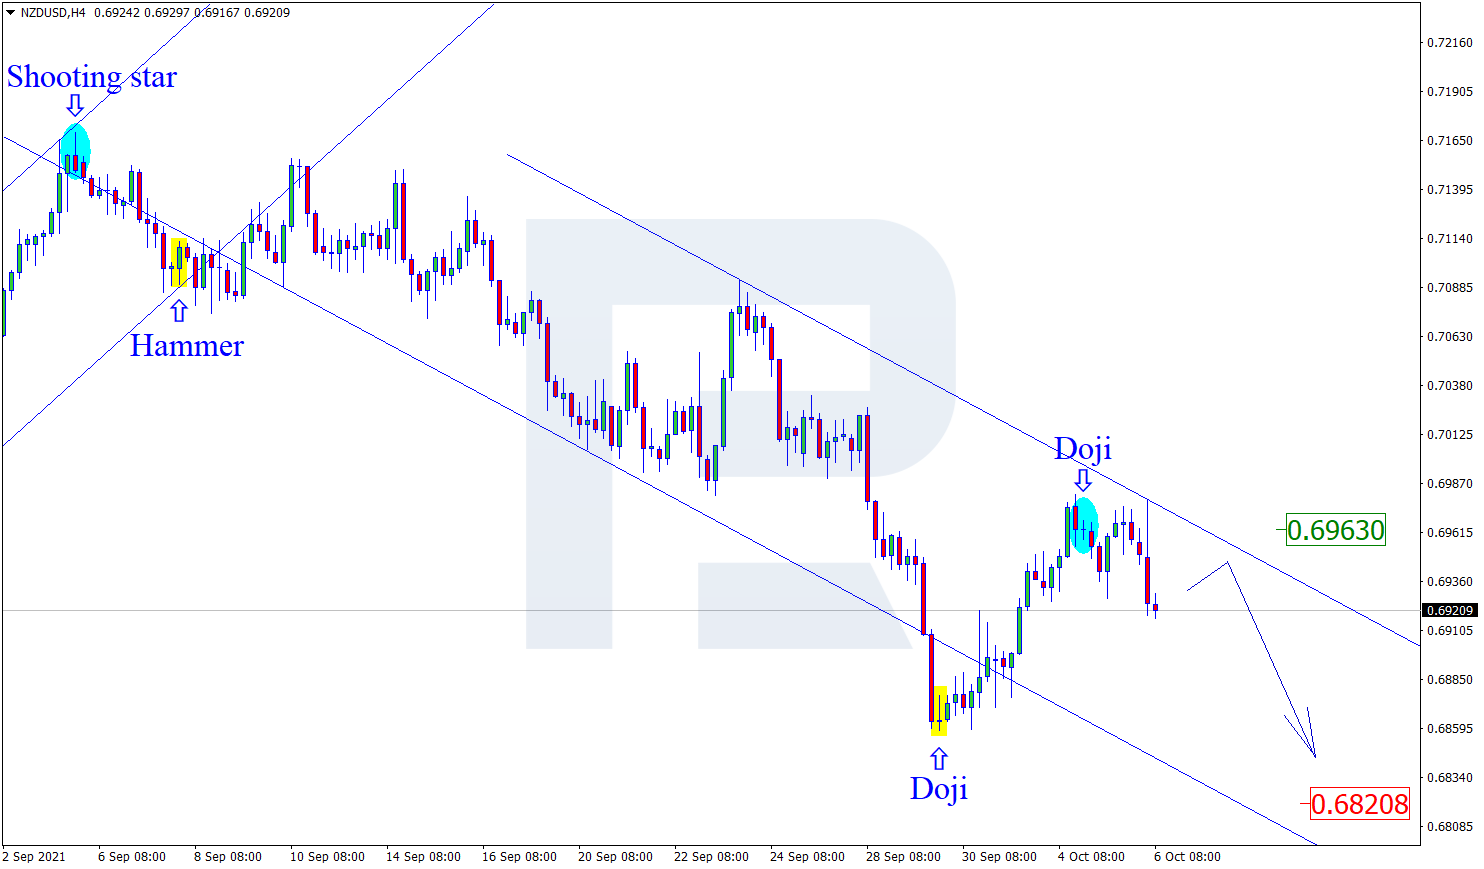
As we can see in the H4 chart, after testing the resistance area, NZDUSD has formed several reversal patterns, such as Doji. At the moment, the asset is reversing in the form of a new decline. In this case, the downside target may be the support level at 0.6820. After that, the asset may break it and continue moving downwards. However, an alternative scenario implies that the price may grow to reach 0.6963 before resuming its descending tendency.

NZDUSD
Risk Warning: the result of previous trading operations do not guarantee the same results in the future

GBPUSD, “Great Britain Pound vs US Dollar”

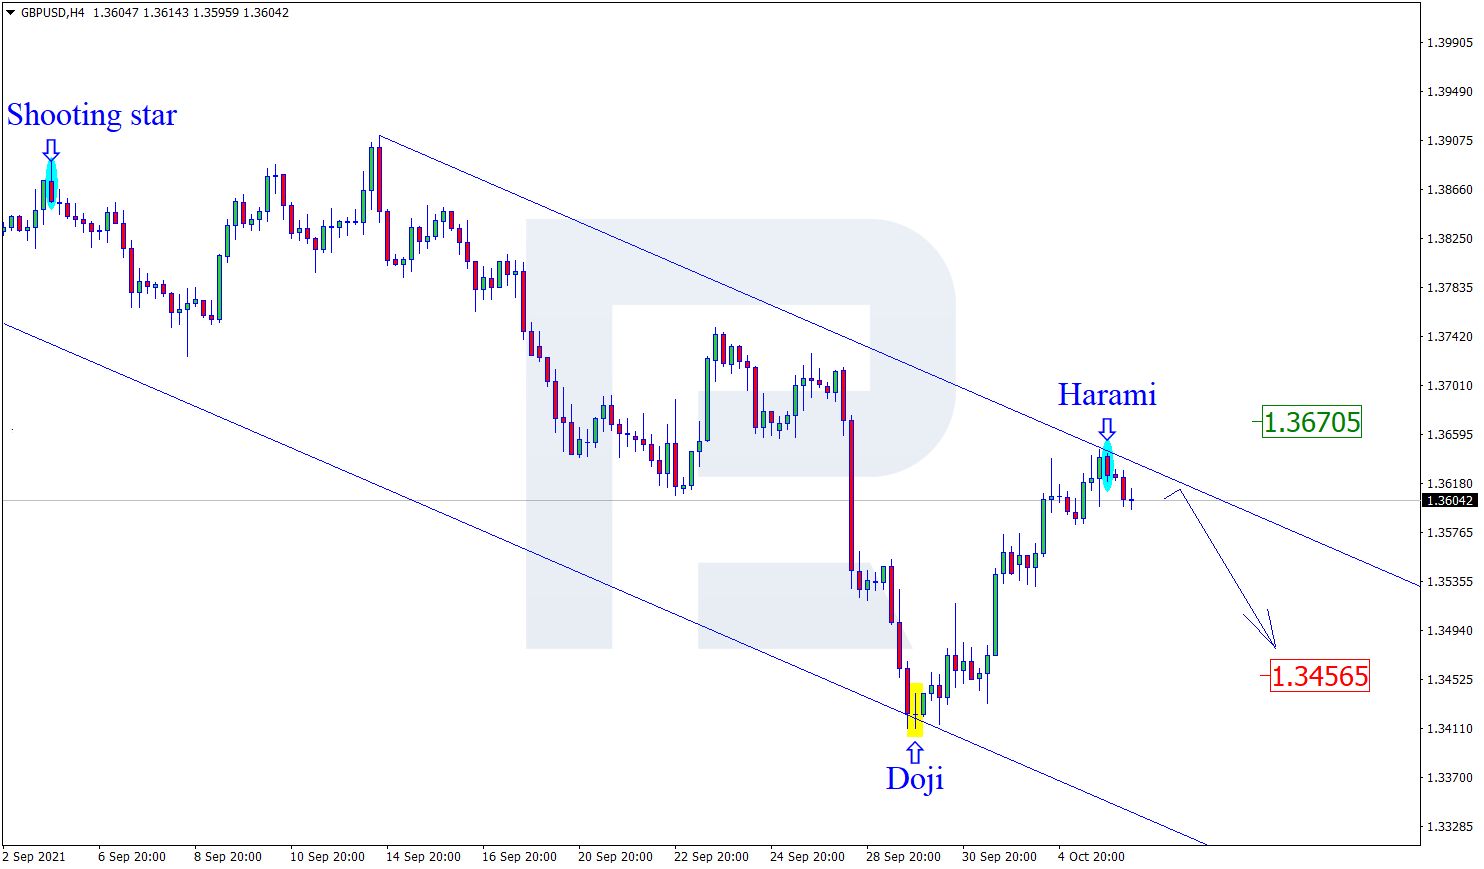
As we can see in the H4 chart, the asset is forming another descending wave from the channel’s upside border. By now, GBPUSD has formed several reversal patterns, such as Harami, not far from the resistance area. At the moment, the pair is reversing in the form of a new decline. In this case, the downside target may be at 1.3456. After testing this level, the market may break it and continue falling. Still, there might be an alternative scenario, according to which the asset may correct towards 1.3670 before reversing.

GBPUSD

Article By RoboForex.com

Attention!
Forecasts presented in this section only reflect the author’s private opinion and should not be considered as guidance for trading. RoboForex LP bears no responsibility for trading results based on trading recommendations described in these analytical reviews.

Should The Markets Worry About Article 16?

By Orbex

Later today, the EU is holding one of its myriad of leaders’ summits. The major issue on the docket is foreign policy, with China relations at the forefront.

Most notably, since January 1st foreign policy also includes the relationship of the EU with the UK.

Earlier this week, there was some market consternation over comments from the UK Brexit minister Frost over the Northern Ireland issue. In particular, he repeatedly used the word “threat”. Now analysts expect the EU to give some kind of “response”, presumably after the meeting later today.

Is there anything more to this than just rhetoric? And with the markets in Europe under pressure, how much will this situation depress the outlook and affect the two major currencies?

The thorn in the side

The Northern Ireland Protocol has been a major sticking point for Brexit for a long list of political and historic reasons.

The ‘why’ of the issue won’t have as much of an impact on the markets as the ‘what’ of the issue.

Basically, both sides believe that the other will have a significant political cost if they don’t offer certain concessions. The markets apparently believe this as well. In fact, the rise of potential uncertainty leads investors to stay away until the issue’s resolution.

Specifically, should the UK press its initiatives, the EU could retaliate with punitive trade restrictions in other areas. This would naturally affect the value of the respective currencies. And it could also impact UK stocks that rely on exporting or importing those goods.

What about Article 16?

David Frost mentioned that Article 16 might be invoked in early November. This will happen if the UK doesn’t get what it wanted out of negotiations with the EU. However, the EU doesn’t want that and would challenge the invocation on legal grounds.

Why is it an issue? Because invoking the article allows for the suspension of certain aspects of the Brexit deal.

The worry for the markets is that if that happens, it could lead to a spiral of uncertainty similar to what happened following Brexit.

Right now, investors know what the rules are, even if they have a diverse range of opinions on whether they are good or bad rules. Nonetheless, invoking a suspension of the rules, even if temporarily, opens the possibility of new rules. This, in turn, could influence investment outcomes.

What can we expect?

Many analysts think this is another show of brinkmanship between the UK and the EU, and that they’ll find a resolution in the 11th hour, just like with the main Brexit agreement.

Whether there is a resolution of the issue in favor of the EU or the UK, economists do not expect a major impact on the markets.

After all, the actual size of Northern Ireland’s economy is quite small. And unlike before the last general election, Northern Ireland representatives in Parliament aren’t the key to avoiding a no-confidence vote in the government.

We might see a minor aversion to the UK risk in the upcoming couple of weeks as a consequence of the Northern Ireland issue.

There are many other factors, however, that could outweigh the effect. Unless it gets to the point that the UK does in fact invoke article 16.


Orbex-LogoArticle by Orbex

Orbex is a fully licensed broker that was established in 2011. Founded with a mission to serve its traders responsibly and provides traders with access to the world’s largest and most liquid financial markets. www.orbex.com

Fibonacci Retracements Analysis 06.10.2021 (GBPUSD, EURJPY)

Article By RoboForex.com

GBPUSD, “Great Britain Pound vs US Dollar”

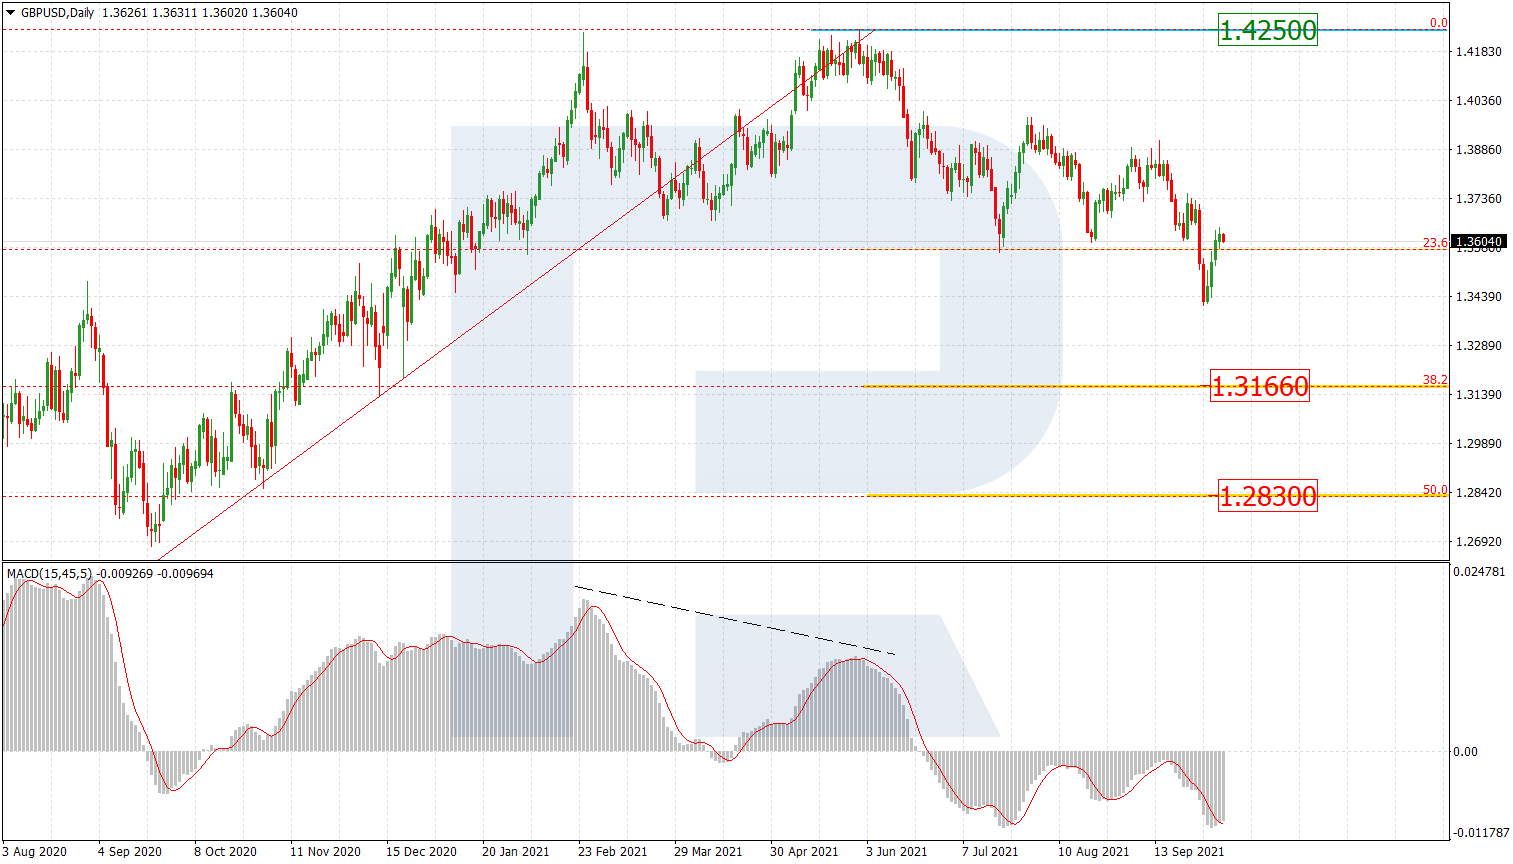
As we can see in the daily chart, the asset is correcting upwards after completing a strong descending movement. Possibly, the asset may finish the pullback and resume falling towards 38.2% and 50.0% fibo at 1.3166 and 1.2830 respectively. The key resistance is the high at 1.4250.

GBPUSD_D1
Risk Warning: the result of previous trading operations do not guarantee the same results in the future

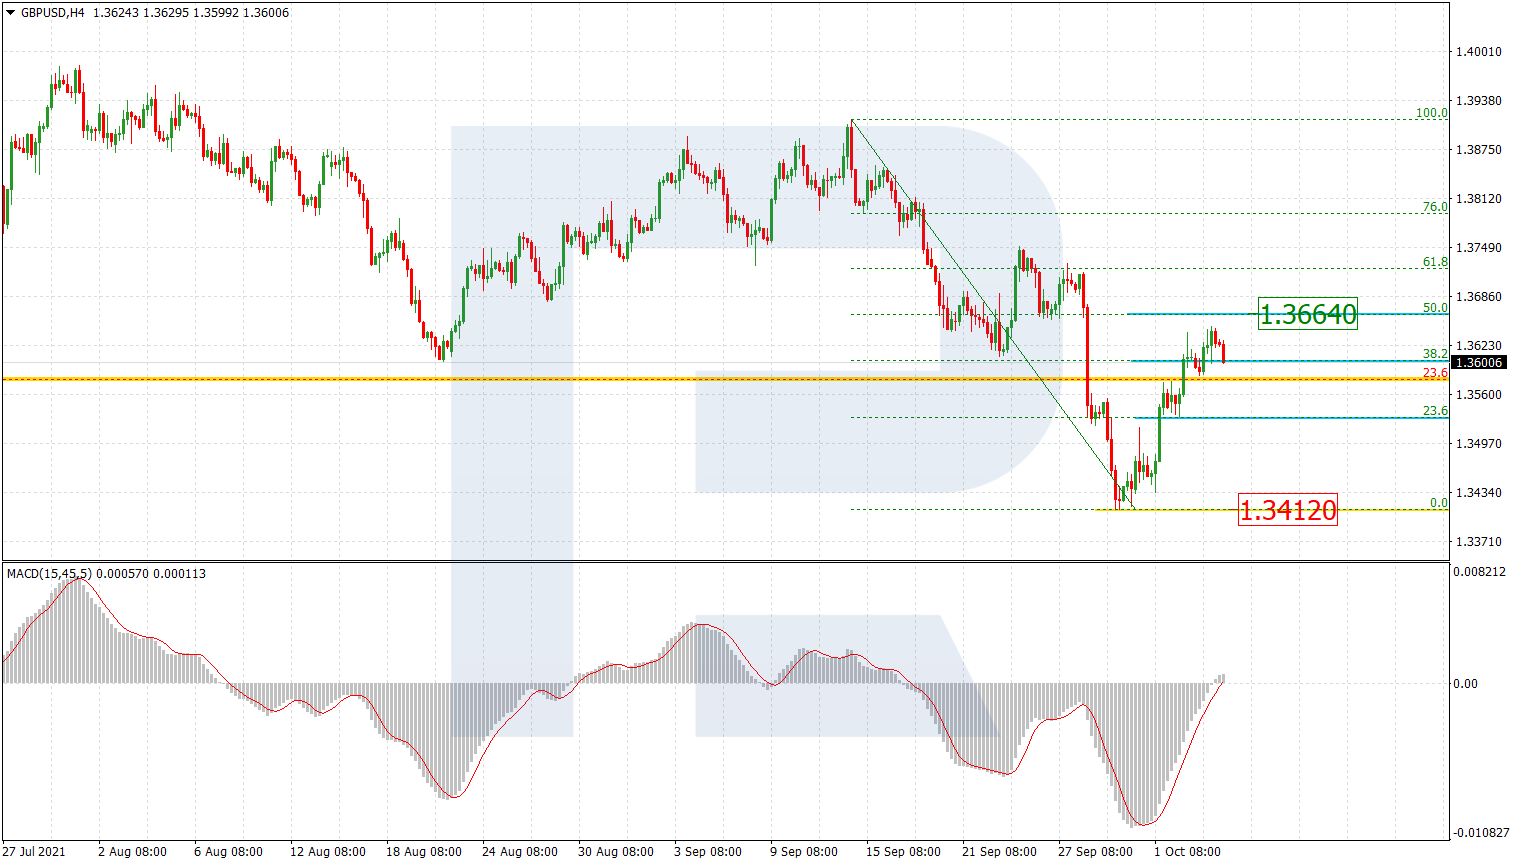
In the H4 chart, after breaking 38.2% fibo, the correctional uptrend has failed to reach 50.0% fibo at 1.3664. The pair may yet try to reach this level but the main scenario implies a further downtrend to break the low at 1.3412.

GBPUSD_H4
Risk Warning: the result of previous trading operations do not guarantee the same results in the future

EURJPY, “Euro vs. Japanese Yen”

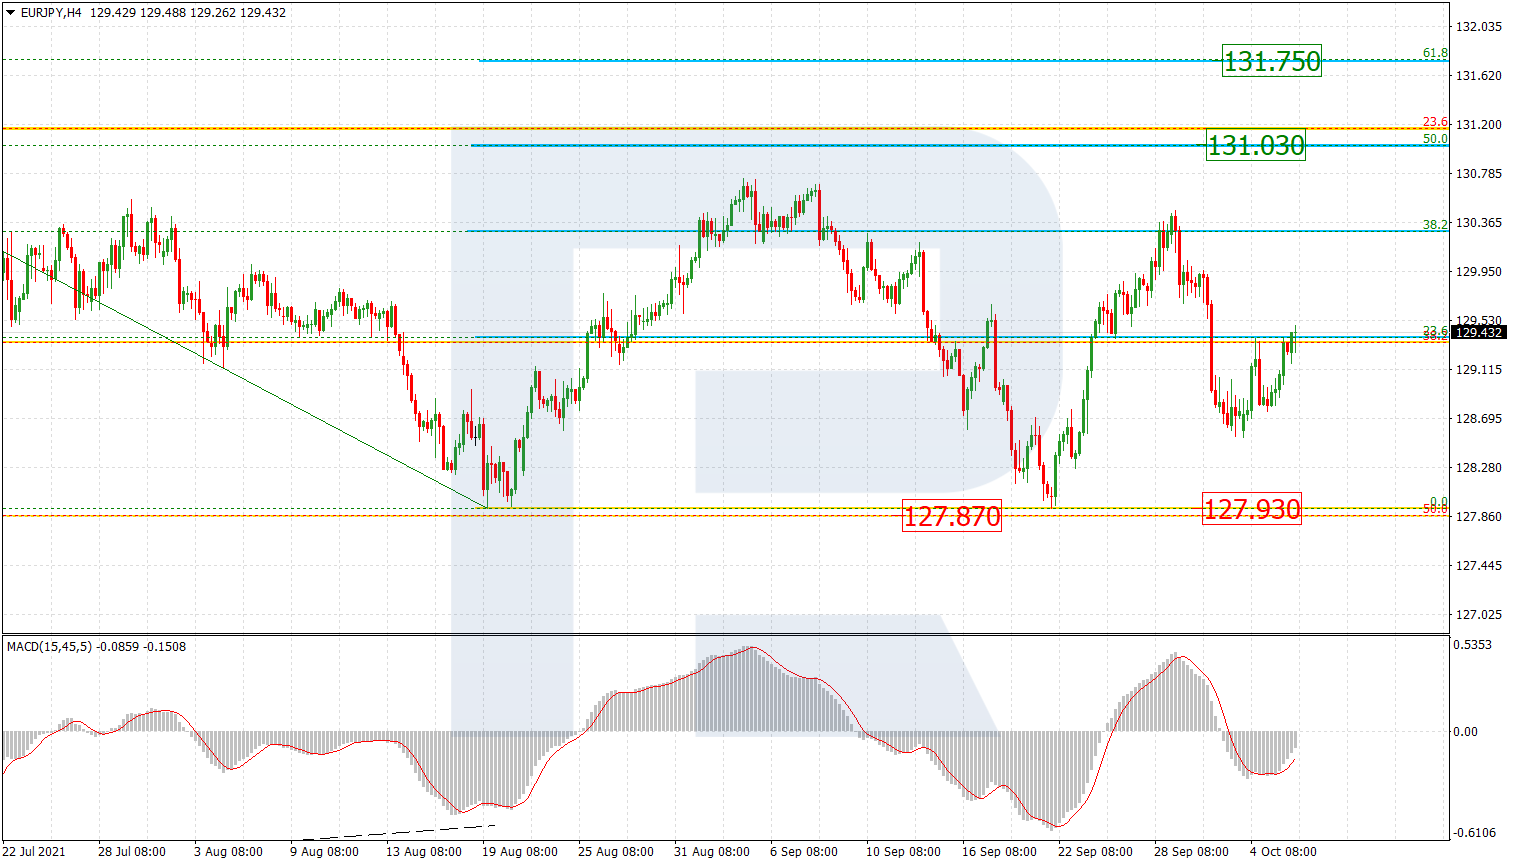
In the H4 chart, the correction continues. Possibly, the correction may transform into a consolidation range but one shouldn’t exclude a possibility of a further uptrend to reach 50.0% and 61.8% fibo at 131.03 and 131.75 respectively. A breakout of the key support at 127.93 will lead to a test of the long-term 50.0% fibo at 127.87.

EURJPY_H4
Risk Warning: the result of previous trading operations do not guarantee the same results in the future

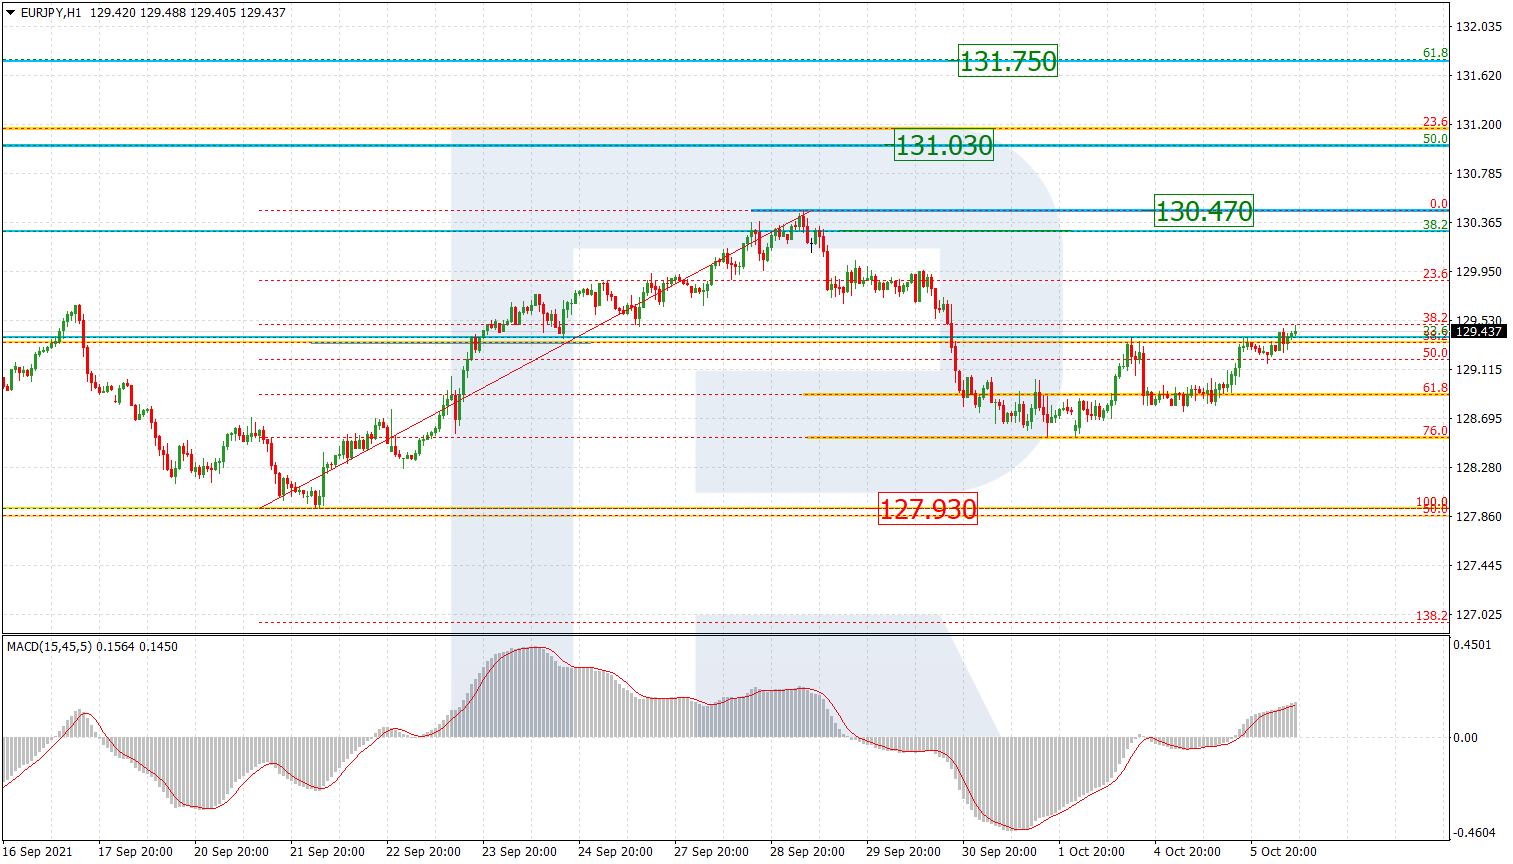
The H1 chart shows that the decline after divergence on MACD has reached 76.0% fibo. At the moment, the price is forming a new impulse to the upside to reach the high at 130.47, a breakout of which will result in a further uptrend.

EURJPY_H1

Article By RoboForex.com

Attention!
Forecasts presented in this section only reflect the author’s private opinion and should not be considered as guidance for trading. RoboForex LP bears no responsibility for trading results based on trading recommendations described in these analytical reviews.

Here’s What Really Sets Interest Rates (Not Central Banks)

See “powerful evidence that the Fed is not in control of interest rates”

By Elliott Wave International

Most everyone is familiar with the phrase: “Keep your eye on the ball,” which of course means — focus on what really matters.

Those who seek clues about the direction of interest rates believe the “ball” is their nation’s central bank.

For example, in the U.S., Federal Reserve announcements are the subject of countless financial headlines, like this one from Sept. 22 (Reuters):

Fed signals bond-buying taper coming ‘soon,’ rate hike next year

The assumption in most of these headlines is that the central bank determines the direction of rates.

However, if interest-rate observers kept their eye on what really matters, they’d be watching the bond market instead of the central bank. In other words, markets lead and central banks follow.

Sticking with the U.S., this chart and commentary from Robert Prechter’s 2017 book, The Socionomic Theory of Finance, provide elaboration:

[The chart] plots T-bill rates and the effective federal funds rate (a weighted average of the federal funds rate across all banking transactions) from 1978 to 1984. T-bill rates peaked four times in 1980-1982. Each of those peaks occurred a month or more before subsequent and reactive peaks in the federal funds rate. The Fed’s rate also lags at bottoms, as depicted on the chart at the lows of 1980, 1981 and 1982-3.

The book adds:

That interest rates were in a relentless upward trend during the entire decade of the 1970s and that they have been stuck at zero since 2008 — in both cases despite the Federal Reserve’s contrary desires — is powerful evidence reinforcing the point that the Fed is not in control of interest rates.

The same principle holds in other nations, like Australia or the United Kingdom.

Here’s another chart and additional commentary from The Socionomic Theory of Finance:

[The chart] plots interest rates on the U.K.’s freely-traded, 3-month government bond against the Bank of England’s (BOE’s) official daily bank-lending rate. These lines show that the BOE’s rate-setting actions have lagged the freely traded debt market at all twelve major turning points in rates since 1993. The lags vary from two to nine months, and the average lag is 4.8 months.

The major takeaway is that central banks’ interest-rate decisions are not proactive but reactive.

Another widely held misconception is that news drives financial markets, like stocks.

Here’s insight on that pervasive assumption from Frost & Prechter’s Wall Street classic, Elliott Wave Principle: Key to Market Behavior:

Sometimes the market appears to reflect outside conditions and events, but at other times it is entirely detached from what most people assume are causal conditions. The reason is that the market has a law of its own. It is not propelled by the external causality to which one becomes accustomed in the everyday experiences of life. The path of prices is not a product of news. Nor is the market the cyclically rhythmic machine that some declare it to be. Its movement reflects a repetition of forms that is independent both of presumed causal events and of periodicity.

The market’s progression unfolds in waves. Waves are patterns of directional movement.

If you’d like to read the online version of this “definitive textbook on the Wave Principle,” you may do so for free once you become a Club EWI member.

Club EWI is free to join and allows members free access to a wealth of Elliott wave resources on financial markets, investing and trading — without any obligations.

Here’s the link to follow for free and unlimited access to the book: Elliott Wave Principle: Key to Market Behavior.


This article was syndicated by Elliott Wave International and was originally published under the headline Here’s What Really Sets Interest Rates (Not Central Banks). EWI is the world’s largest market forecasting firm. Its staff of full-time analysts led by Chartered Market Technician Robert Prechter provides 24-hour-a-day market analysis to institutional and private investors around the world.


The Analytical Overview of the Main Currency Pairs on 2021.10.06

by JustForex

The EUR/USD currency pair

Technical indicators of the currency pair:
  • Prev Open: 1.1618
  • Prev Close: 1.1597
  • % chg. over the last day: -0.18%

Europe’s gas reserves are at their lowest seasonal level in more than a decade. Global gas and coal shortages are pushing energy prices higher, which in turn is negatively impacting businesses and economies in the region. Against the background of such a deficit, prices are likely to continue growing in winter. Energy independence is now the EU’s main goal.

Trading recommendations
  • Support levels: 1.1588, 1.1564, 1.1453
  • Resistance levels: 1.1671, 1.1717, 1.1772, 1.1802, 1.1835

From the technical point of view, the EUR/USD trend is bearish. However, the MACD indicator has become inactive. It indicates that the sellers have stopped putting pressure. Under such market conditions, traders should consider sell deals from the resistance levels near the moving average, as the price has deviated from the middle line. Buy trades should be considered only from the support levels with additional confirmation in the form of a buyers’ initiative.

Alternative scenario: if the price breaks out through the 1.1717 resistance level and fixes above, the mid-term uptrend will likely resume.

EUR/USD
News feed for 2021.10.06:
  • – Eurozone Retail Sales (m/m) at 12:00 (GMT+3);
  • – US ADP Nonfarm Employment Change (m/m) at 15:15 (GMT+3).

The GBP/USD currency pair

Technical indicators of the currency pair:
  • Prev Open: 1.3605
  • Prev Close: 1.3625
  • % chg. over the last day: +0.15%

Gas prices in the UK have risen significantly since early July. But the situation with fuel shortages at gas stations is improving. British Prime Minister Boris Johnson said that the government created reliable supply lines for Christmas.

Trading recommendations
  • Support levels: 1.3532, 1.3457, 1.3360, 1.3282
  • Resistance levels: 1.3639, 1.3685, 1.3759, 1.3812, 1.3886

On the hourly time frame, the GBP/USD trend is bearish. But the British currency keeps getting stronger due to oil prices growth. The MACD indicator has become positive, but there are already signs of divergence. Buy trades should be considered only throughout the day and only with short targets from the support levels after the buyer’s initiative. Sell trades can be found at the resistance levels near the moving average line.

Alternative scenario: if the price breaks out through the 1.3759 resistance level and consolidates above, the bullish scenario will likely resume.

GBP/USD
News feed for 2021.10.06:
  • – UK Construction PMI (m/m) at 11:30 (GMT+3).

The USD/JPY currency pair

Technical indicators of the currency pair:
  • Prev Open: 110.85
  • Prev Close: 111.46
  • % chg. over the last day: +0.55%

Japanese shares fell against the background of the market disappointment in the new government and threats for global economic growth. Rising commodity prices are increasing fears about global inflation in the region, which is also negatively affecting the Japanese Yen.

Trading recommendations
  • Support levels: 110.99, 110.65, 110.40, 109.95, 109.63, 109.27
  • Resistance levels: 111.67, 112.19

The main trend of the USD/JPY currency pair is bullish. The MACD indicator has become positive, and there are signs of buyer’s initiative. Under such market conditions, it’s better to look for buy positions from the support levels near the moving average. Sell positions should be considered only throughout the day from the resistance levels, given there is sellers’ initiative.

Alternative scenario: if the price falls below 110.45, the uptrend is likely to be broken.

USD/JPY
There is no news feed for today.

The USD/CAD currency pair

Technical indicators of the currency pair:
  • Prev Open: 1.2588
  • Prev Close: 1.2579
  • % chg. over the last day: -0.07%

The Canadian dollar is a commodity currency, so USD/CAD is highly dependent on the dynamics of the dollar index and oil prices. Both the dollar index and oil prices strengthened yesterday. As a result, USD/CAD are trading flat.

Trading recommendations
  • Support levels: 1.2565, 1.2518, 1.2425
  • Resistance levels: 1.2611, 1.2729, 1.2774, 1.2891

From the technical point of view, the trend of the USD/CAD currency pair is bearish. But the MACD indicator is showing the divergence in the direction of buying. Under such market conditions, it is better to look for sell deals from the resistance levels near the moving average. Buy deals should be considered from the false breakdown zone but with short targets.

Alternative scenario: if the price breaks out through the 1.2774 resistance level and fixes above, the uptrend will likely resume.

USD/CAD
News feed for 2021.10.06:
  • – US Crude Oil Reserves (w/w) at 17:30 (GMT+3).

by JustForex


This article reflects a personal opinion and should not be interpreted as an investment advice, and/or offer, and/or a persistent request for carrying out financial transactions, and/or a guarantee, and/or a forecast of future events.

GBPUSD New Cycle Wave Has Just Begun

By Orbex

In the long run, GBPUSD seems to be forming a large cycle double zigzag w-x-y.

It is likely that the cycle intervening wave x has come to an end. It consists of primary sub-waves Ⓦ-Ⓧ-Ⓨ and has the form of a double zigzag.

If this is the case, then we can expect a bullish market move in the upcoming trading weeks within the cycle wave y. Its end is possible well above the maximum of 1.398, which was marked by the primary intervening wave Ⓧ.

GBPUSD

Let’s look at an alternative scenario. Here we see that there is a probability of continuing the construction of a cycle wave x. Its final primary wave Ⓨ may be more complex in structure than in the first case.

After a slight rise in the price in the intermediate intervening wave (X), the pair is likely to decline in the intermediate wave (Z) near 1.331. At that level, primary actionary sub-waves Ⓨ and Ⓦ will be equal.

Then the cycle wave y can send the market above the high of 1.391.


Orbex-LogoArticle by Orbex

Orbex is a fully licensed broker that was established in 2011. Founded with a mission to serve its traders responsibly and provides traders with access to the world’s largest and most liquid financial markets. www.orbex.com

Inflation is above the target level in many countries

by JustForex

The US stock market closed in the green zone yesterday. At the close of the stock market, the Dow Jones index added 0.92%, the S&P 500 index increased by 1.05%, and the NASDAQ index jumped by 1.25%. But investors still have plenty to worry about, from supply chain disruptions to skyrocketing prices and anticipation of tighter monetary policy from the Federal Reserve. Investors are no longer willing to buy back every stock market drop, and high oil prices create additional inflationary concerns.

Jim Cramer, a well-known US TV host and former hedge fund manager, says that he thinks investors may start looking for hard-hit stocks to buy. Goldman Sachs expects a strong 4th quarter with the S&P 500 up 9%.

US President Joe Biden warns of the risk of a US government debt default due to Republican opposition. The US again opposed the Nord Stream 2 pipeline after Russia announced that it had begun to fill it with gas.

European stock indices rose yesterday. German DAX gained 1.05%, British FTSE 100 added 0.94%, French CAC 40 increased by 1.52%, Spanish IBEX 35 and Italian FTSE MIB increased by 1.54% and 1.95%, respectively. Despite the fact that the cost of gas futures in Europe has updated the record, exceeding $1300 per thousand cubic meters, ECB head Christine Lagarde said that the Central Bank should not overreact to problems in energy supply chains and rising energy prices, as monetary policy can not directly affect it. The ECB still believes that the region’s economy will return to pre-pandemic levels by the end of the year.

Saxo Bank’s chief equity market strategist said the following, “Policies are being implemented globally as if we have a demand shock, but we are currently facing a supply-side shock due to the pandemic, lack of investments in the physical world, and an accelerated decarbonization through electrification and renewable energy.”
Current technology does not allow for increased solar and wind generation because of the instability of such sources. It will lead to supply lagging behind demand and rising inflation, weak real economic growth, and negative rates.

Oil is holding near its highest level since 2014 following OPEC+’s decision to maintain a gradual increase in supply, even as the natural gas crisis boosts demand for crude oil. Companies like Glencore, Gunvor, Trafigura, and Vitol faced margin calls in the gas futures market and had to raise additional funding from banks. Brokers are demanding hundreds of millions of dollars from commodity traders to secure positions that were taken as part of hedging strategies.

Gold prices have stabilized in recent days. But as long as US government bond yields continue to rise because of rising inflation fears, gold and silver prices will be under selling pressure.

The missed payment on the bonds of Chinese real estate developer Evergrande has investors worried again. Another major Chinese developer Fantasia Holdings Group failed to pay its bond debt on time. The company missed the deadline to pay its $205.65 million bond debt due Monday.

Beijing is creating a system designed to ensure that the automated processes of Internet platforms are fair, transparent, and consistent with the ideology of the Communist Party. China’s tech index seeks a new low as the global sell-off continues. The Hang Seng Tech Index decreased by 2.5% yesterday. The blue-chip CSI 300 Index lost another 3%, extending losses from the September high to 10%.

Australia’s banking regulator is tightening home loan requirements as the rapid credit growth that has caused a jump in home prices poses a risk to financial stability.

New Zealand’s central bank raised interest rates for the first time in seven years in an attempt to curb rising inflation. The Reserve Bank of New Zealand (RBNZ) raised the interest rate from 0.25% to 0.5%. The RBNZ also plans to remove most of its stimulus measures as the economy recovers.

Main market quotes:

S&P 500 (F) 4,345.72 +45.26 (+1.05%)

Dow Jones 34,314.67 +311.75 (+0.92%)

DAX 15,194.49 +157.94 (+1.05%)

FTSE 100 7,077.10 +66.09 (+0.94%)

USD Index 94.00 +0.22 (+0.24%)

Important events for today:
  • – New Zealand RBNZ Interest Rate Decision at 04:00 (GMT+3);
  • – New Zealand RBA Rate Statement at 04:00 (GMT+3);
  • – UK Construction PMI (m/m) at 11:30 (GMT+3);
  • – Eurozone Retail Sales (m/m) at 12:00 (GMT+3);
  • – US ADP Nonfarm Employment Change (m/m) at 15:15 (GMT+3);
  • – US Crude Oil Reserves (w/w) at 17:30 (GMT+3).

by JustForex


This article reflects a personal opinion and should not be interpreted as an investment advice, and/or offer, and/or a persistent request for carrying out financial transactions, and/or a guarantee, and/or a forecast of future events.

Could Apple bounce 40% higher to $200? One analyst thinks so…

By Admiral Markets

Apple price chart

It’s a known fact that Wall Streeters love Apple stock. With the stock down 12% from its all-time high, a lot of analysts have chimed in on the potential opportunity of buying the dip.

In an interview with CNBC, well known money manager Gene Munster believes Apple could be trading around $200 per share over the next 12 to 24 months.

From current levels that represents a near 40% surge higher. The rationale? Most of the recent weakness has nothing to do with Apple and more to do with portfolio positioning in preparation for higher interest rates.

There’s also the release of the iPhone 13 but what do the charts say?

Apple price chart

Source: Admirals MetaTrader 5#AAPLWeekly – Data range: from 31 Dec 2017 to 5 Oct 2021, performed on 5 Oct 2021 at 8:30 pm GMT. Please note: Past performance is not a reliable indicator of future results.  

It’s clear to see the long-term uptrend in the weekly chart of Apple’s share price shown above. All the key exponential moving averages (20, 50 and 100-periods), are all moving higher and in the correct order for bullish momentum.

However, the recent dip in price is relatively small compared to recent corrections at the end of last year, beginning of 2020 and in 2018.

While the price is stalling around the 20-week exponential moving average (EMA), there is a confluence of support levels around the 50-week EMA. This also coincides with a bullish trend line as shown by the ascending black line.

Did you know that you can find real-time, actionable trading ideas on this instrument and thousands of others from the Trading Central Technical Insight Lookup indicator in the Premium Analytics section of the Admirals Client portal area?

Open an account and use the indicator to help you master the markets today.

Premium Analytics

INFORMATION ABOUT ANALYTICAL MATERIALS: 

The given data provides additional information regarding all analysis, estimates, prognosis, forecasts, market reviews, weekly outlooks or other similar assessments or information (hereinafter “Analysis”) published on the websites of Admirals’ investment firms operating under the Admirals trademark (hereinafter “Admirals”) Before making any investment decisions please pay close attention to the following:

  • This is a marketing communication. The content is published for informative purposes only and is in no way to be construed as investment advice or recommendation. It has not been prepared in accordance with legal requirements designed to promote the independence of investment research, and that it is not subject to any prohibition on dealing ahead of the dissemination of investment research.
  • Any investment decision is made by each client alone whereas Admirals shall not be responsible for any loss or damage arising from any such decision, whether or not based on the content.
  • With a view to protecting the interests of our clients and the objectivity of the Analysis, Admirals has established relevant internal procedures for the prevention and management of conflicts of interest.
  • The Analysis is prepared by an independent analyst, Jitan Solanki (analyst), (hereinafter “Author”) based on their personal estimations.
  • Whilst every reasonable effort is taken to ensure that all sources of the content are reliable and that all information is presented, as much as possible, in an understandable, timely, precise and complete manner, Admirals does not guarantee the accuracy or completeness of any information contained within the Analysis.
  • Any kind of past or modelled performance of financial instruments indicated within the content should not be construed as an express or implied promise, guarantee or implication by Admirals for any future performance. The value of the financial instrument may both increase and decrease and the preservation of the asset value is not guaranteed.
  • Leveraged products (including contracts for difference) are speculative in nature and may result in losses or profit. Before you start trading, please ensure that you fully understand the risks involved.
Jitanchandra Solanki
Jitanchandra Solanki Financial Markets Author, Admirals LondonJitanchandra is a financial markets author with more than 15 years experience trading currencies, indices and US equities. He is an accredited Market Technician with a BA Hons degree.

By Admiral Markets

Intraday Market Analysis – Gold Sell-Off Fades

By Orbex

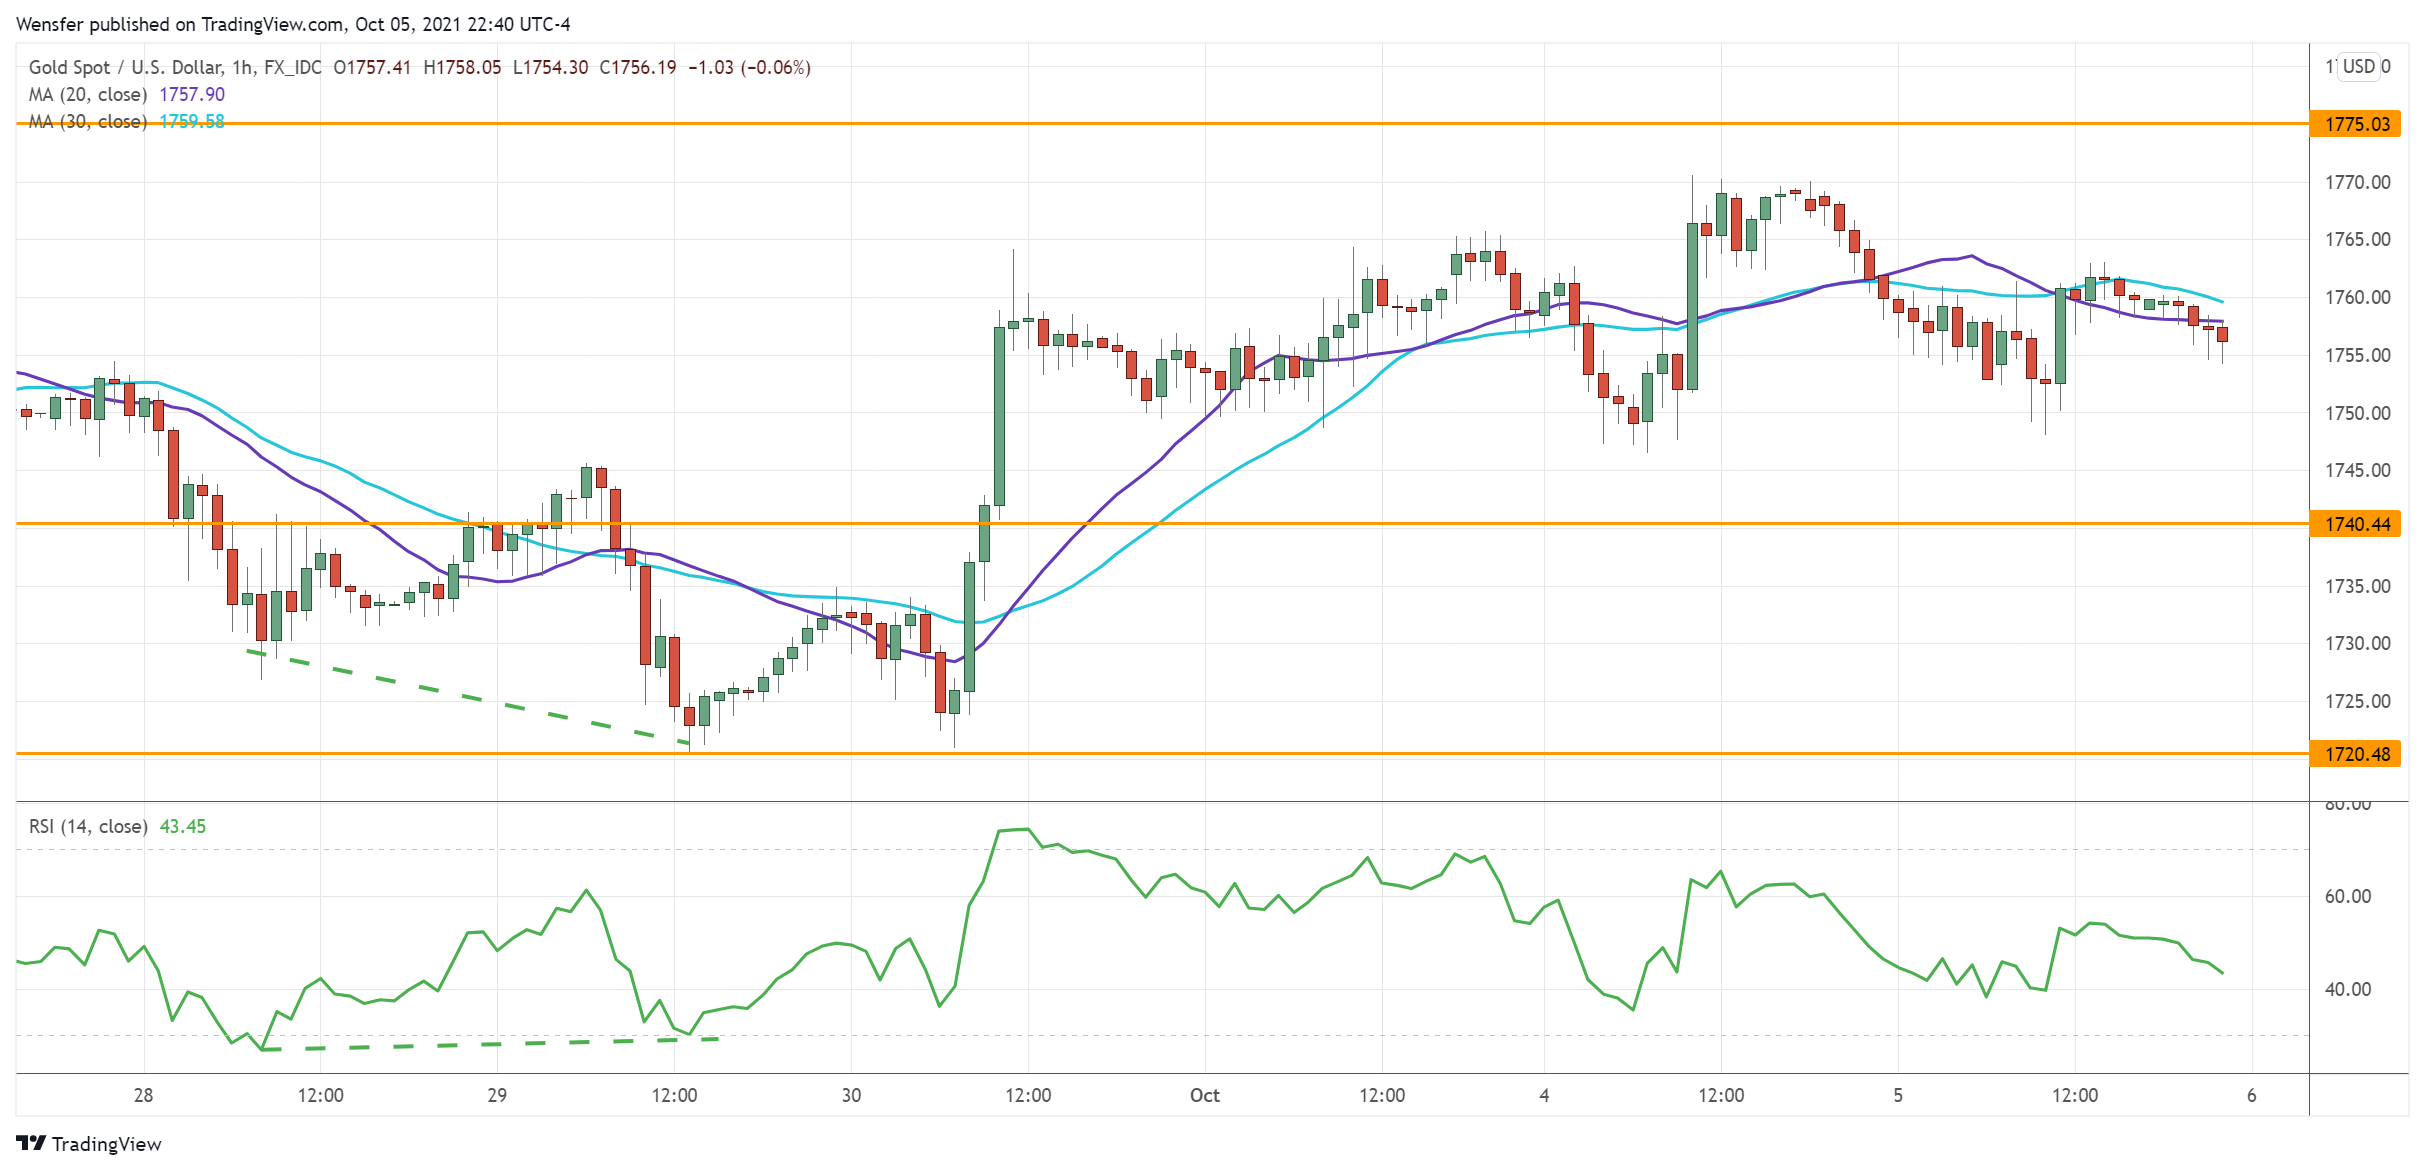
XAUUSD tests resistance

XAUUSD

Gold hit a speed bump after an upbeat ISM Services PMI boosted the dollar’s appeal.

The metal saw buying interest in the major demand zone around 1720. A bullish RSI divergence indicates a slowdown in the pace of the sell-off. The initial surge above 1745 could be due to profit-taking from the short side, a prerequisite for a reversal.

1775 is the main hurdle and its breach may lead to the psychological level of 1800. On the downside, the area between 1720 and 1740 is the floor to keep price action afloat.

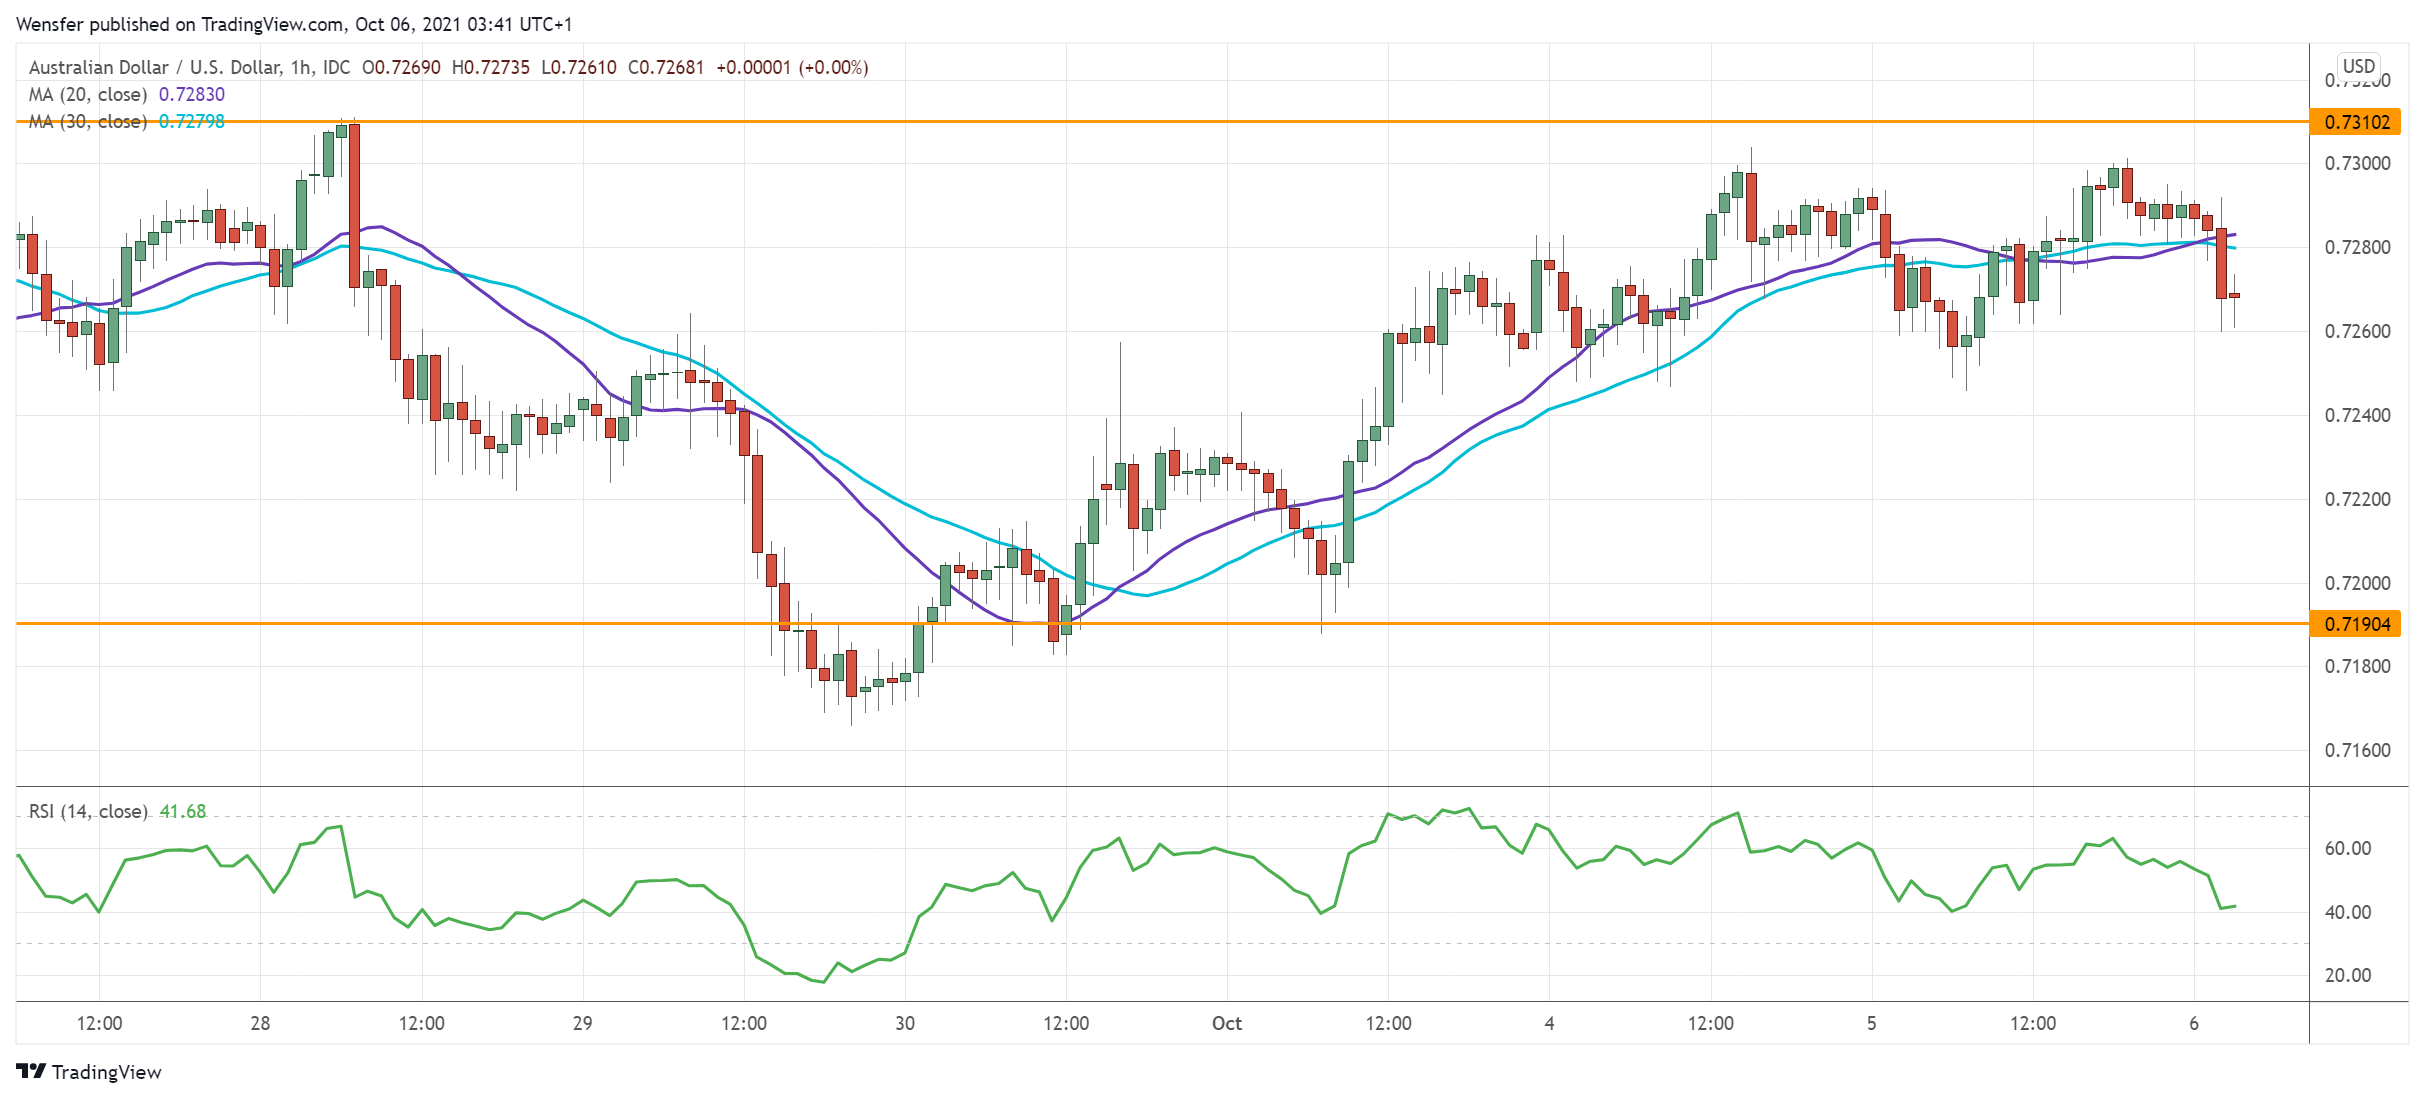
AUDUSD attempts to rebound

AUDUSD

The Australian dollar consolidated its gains after the RBA played down the rate-hike pressure.

The rally above 0.7250 has prompted short-term traders to take some chips off the table. However, the bulls will need to clear the main hurdle at 0.7310 before they could extend upward. The RSI’s double top in this congestion area may momentarily restrain their optimism.

In case of a pullback, 0.7190 is a key support to keep the rebound relevant. Failing that, the pair could tumble towards the daily support at 0.7120.

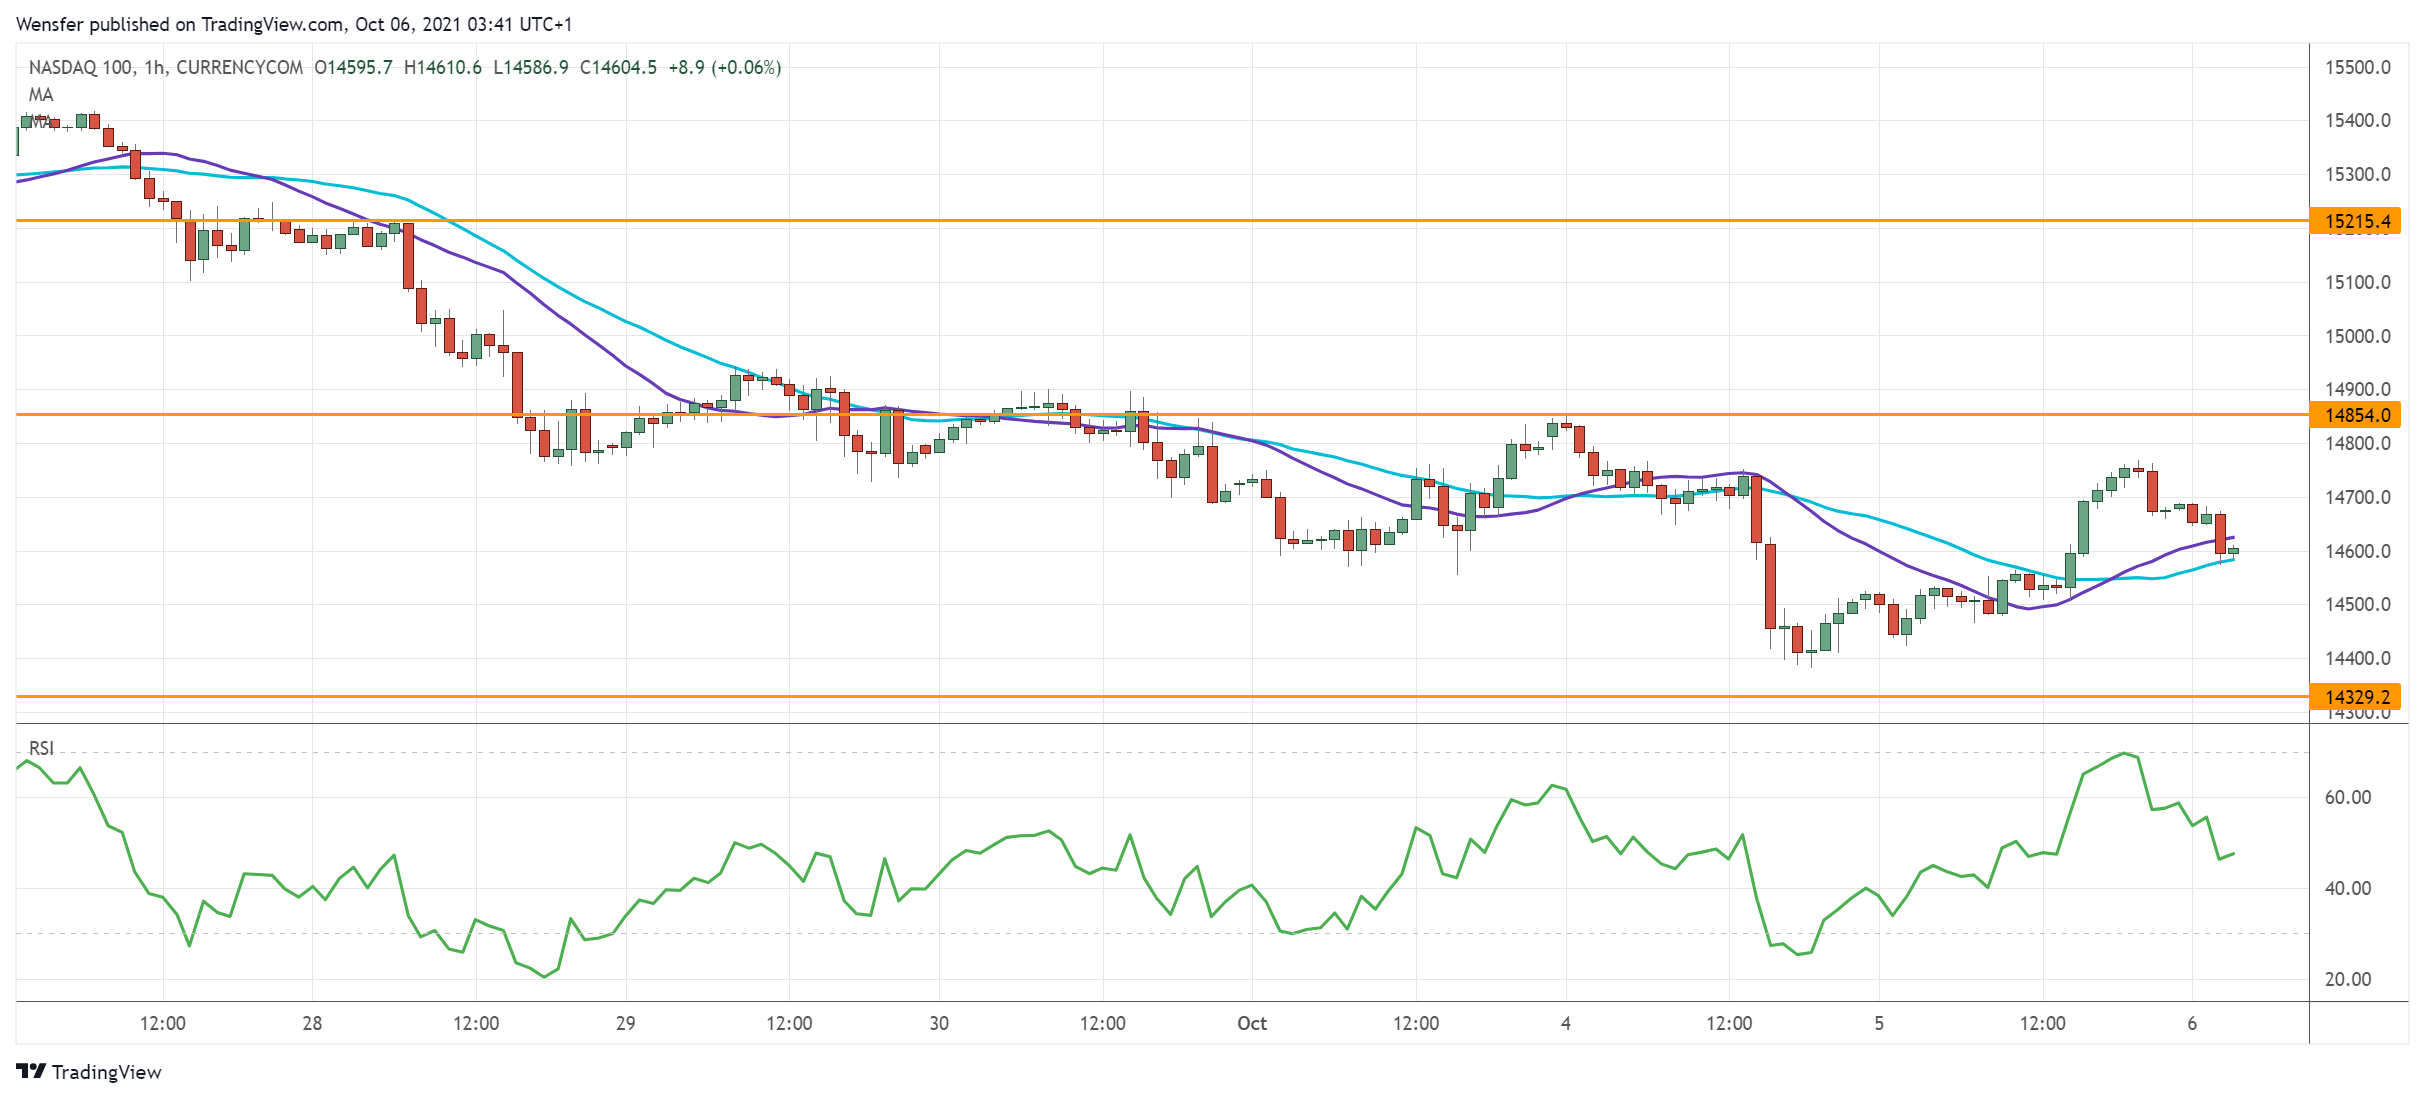
NAS 100 breaks key support

US100

The Nasdaq 100 struggles as investors rotate out of growth stocks amid an uncertain outlook.

The break below last July’s low (14450) has pushed the index into a deeper correction. A bearish MA cross on the daily chart points to a downgrade in market sentiment.

An oversold RSI has caused a temporary rebound, which would be an opportunity for trend followers to sell into strength. 14330 is the next support. Short-term traders who are brave enough to buy the dips must push through 14850 to secure a foothold.


Orbex-LogoArticle by Orbex

Orbex is a fully licensed broker that was established in 2011. Founded with a mission to serve its traders responsibly and provides traders with access to the world’s largest and most liquid financial markets. www.orbex.com