By InvestMacro
Here are the latest charts and statistics for the Commitment of Traders (COT) reports data published by the Commodities Futures Trading Commission (CFTC).
The latest COT data is updated through Tuesday August 12th and shows a quick view of how large traders (for-profit speculators and commercial entities) were positioned in the futures markets.
Weekly Speculator Changes led by Soybeans & Soybean Meal
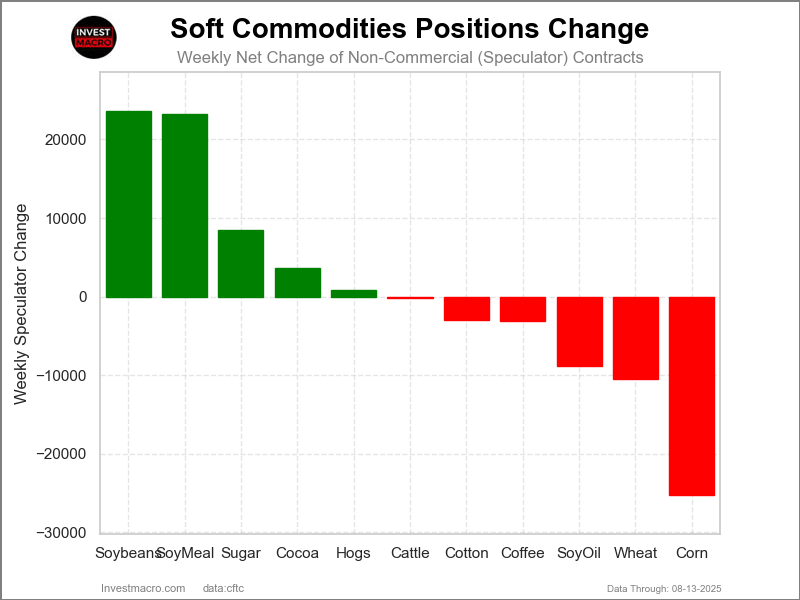
The COT soft commodities markets speculator bets were slightly lower this week as five out of the eleven softs markets we cover had higher positioning while the other six markets had lower speculator contracts.
Leading the gains for the softs markets was Soybeans (23,585 contracts) with Soybean Meal (23,298 contracts), Sugar (8,460 contracts), Cocoa (3,706 contracts) and Lean Hogs (789 contracts) also showing positive weeks.
The markets with the declines in speculator bets this week were Corn (-25,206 contracts), Wheat (-10,481 contracts), Soybean Oil (-8,877 contracts), Coffee (-3,056 contracts), Cotton (-2,961 contracts) and with Live Cattle (-234 contracts) also registering lower bets on the week.
Soft Commodities Price Changes:
Leading the prices this week for the soft commodity markets was Coffee, which jumped by over 10%. Coffee has now been up by 16% in the last 30 days, but over the last 90 days it is down by almost 1%.
Soybeans came in second this week with a gain of over 5%, followed by Soybean Meal, which rose by over 2.5% on the week. Cocoa was next with a gain of almost 2%, followed by Cotton with a 1.3% rise, and then Sugar, which rose by just about 1.2% on the week. Corn (0.29%) and Soybean Oil (0.14%) edged up a minuscule amount on the week.
Live cattle (-0.22%), Lean Hogs (-0.97%), and Wheat were all down on the week, with Wheat seeing the biggest downfall at -1.86%.
Soft Commodities Data:

Legend: Weekly Speculators Change | Speculators Current Net Position | Speculators Strength Score compared to last 3-Years (0-100 range)
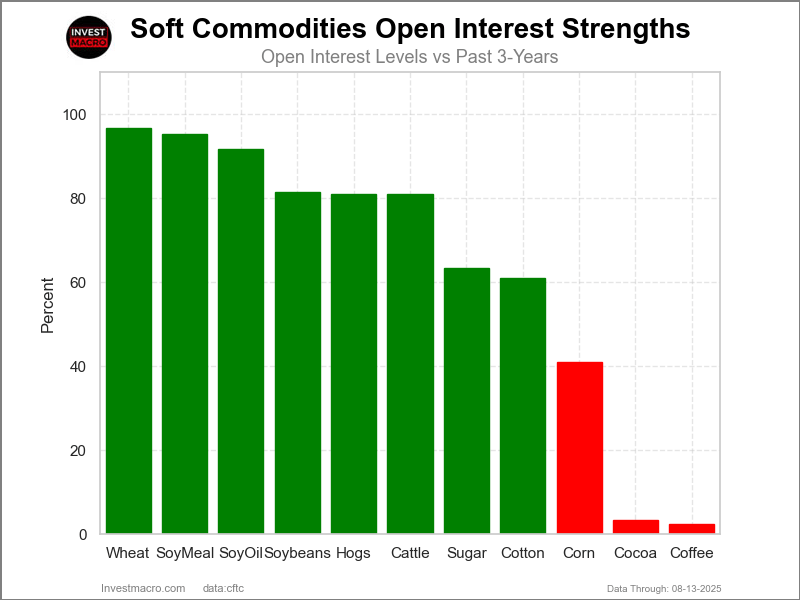
Strength Scores led by Live Cattle & Lean Hogs
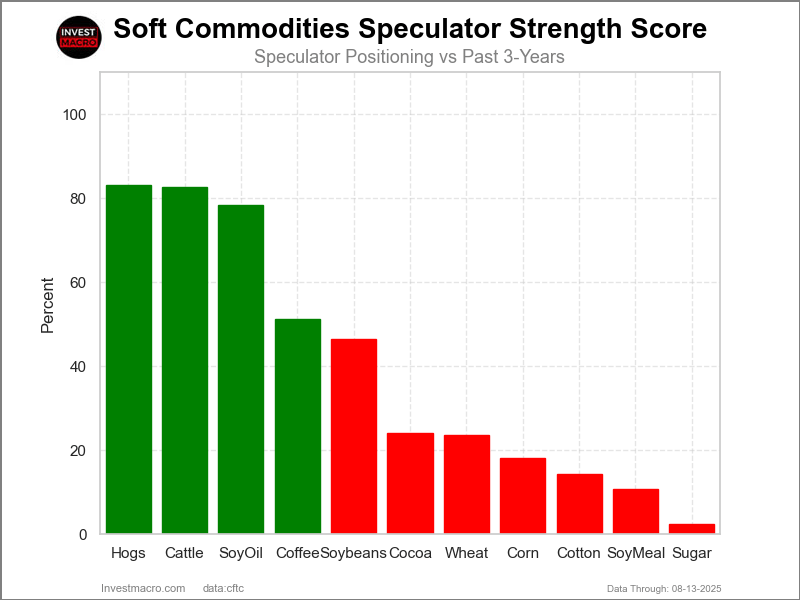
COT Strength Scores (a normalized measure of Speculator positions over a 3-Year range, from 0 to 100 where above 80 is Extreme-Bullish and below 20 is Extreme-Bearish) showed that Live Cattle (83 percent) and Lean Hogs (83 percent) lead the softs markets this week. Soybean Oil (78 percent) and Coffee (51 percent) come in as the next highest in the weekly strength scores.
On the downside, Sugar (2 percent), Soybean Meal (11 percent), Cotton (14 percent) and the Corn (18 percent) come in at the lowest strength levels currently and are in Extreme-Bearish territory (below 20 percent).
Strength Statistics:
Corn (18.1 percent) vs Corn previous week (21.5 percent)
Sugar (2.4 percent) vs Sugar previous week (0.0 percent)
Coffee (51.3 percent) vs Coffee previous week (54.2 percent)
Soybeans (46.5 percent) vs Soybeans previous week (40.5 percent)
Soybean Oil (78.3 percent) vs Soybean Oil previous week (83.3 percent)
Soybean Meal (10.8 percent) vs Soybean Meal previous week (2.0 percent)
Live Cattle (82.6 percent) vs Live Cattle previous week (82.9 percent)
Lean Hogs (83.1 percent) vs Lean Hogs previous week (82.5 percent)
Cotton (14.4 percent) vs Cotton previous week (16.2 percent)
Cocoa (24.0 percent) vs Cocoa previous week (20.2 percent)
Wheat (23.5 percent) vs Wheat previous week (32.0 percent)
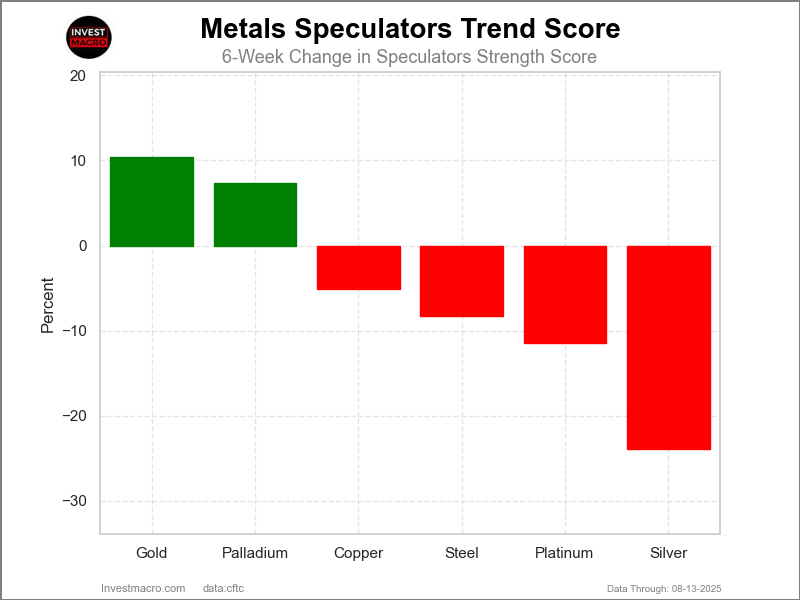
Soybean Meal & Soybean Oil top the 6-Week Strength Trends
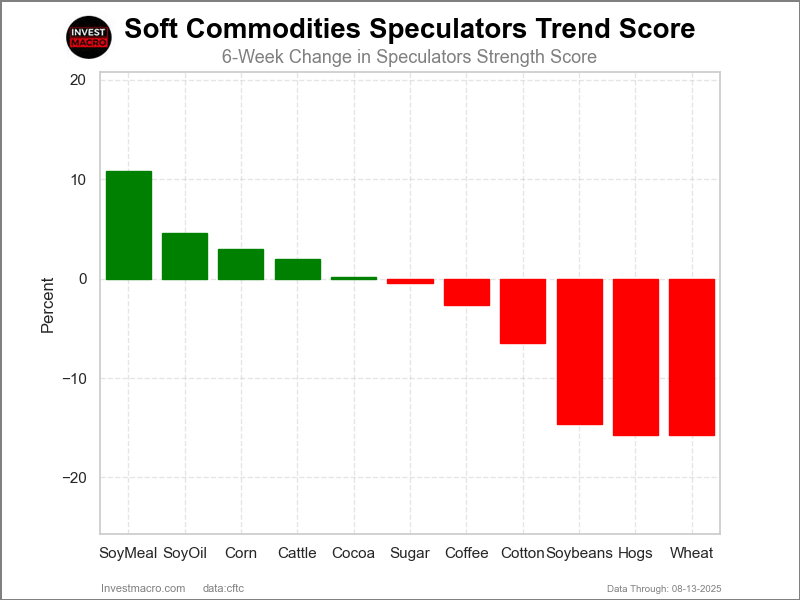
COT Strength Score Trends (or move index, calculates the 6-week changes in strength scores) showed that Soybean Meal (11 percent) and Soybean Oil (5 percent) lead the past six weeks trends for soft commodities. Corn (3 percent) and Live Cattle (2 percent) are the next highest positive movers in the latest trends data.
Lean Hogs (-16 percent) leads the downside trend scores currently with Wheat (-16 percent), Soybeans (-15 percent) and Cotton (-7 percent) following next with lower trend scores.
Strength Trend Statistics:
Corn (3.0 percent) vs Corn previous week (3.1 percent)
Sugar (-0.4 percent) vs Sugar previous week (-8.3 percent)
Coffee (-2.7 percent) vs Coffee previous week (-1.8 percent)
Soybeans (-14.6 percent) vs Soybeans previous week (-24.3 percent)
Soybean Oil (4.6 percent) vs Soybean Oil previous week (6.3 percent)
Soybean Meal (10.8 percent) vs Soybean Meal previous week (-2.1 percent)
Live Cattle (2.0 percent) vs Live Cattle previous week (0.2 percent)
Lean Hogs (-15.7 percent) vs Lean Hogs previous week (-16.5 percent)
Cotton (-6.5 percent) vs Cotton previous week (-2.7 percent)
Cocoa (0.2 percent) vs Cocoa previous week (-2.9 percent)
Wheat (-15.7 percent) vs Wheat previous week (-6.0 percent)
Individual Soft Commodities Markets:
CORN Futures:
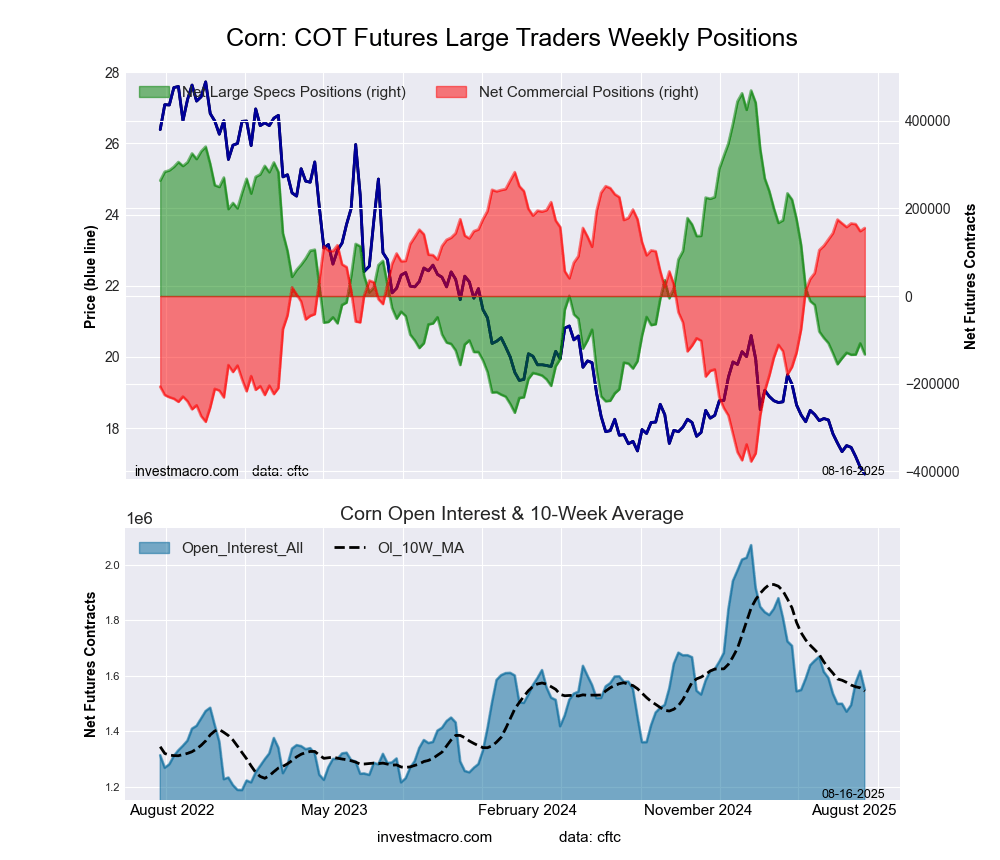 The CORN large speculator standing this week came in at a net position of -133,174 contracts in the data reported through Tuesday. This was a weekly decline of -25,206 contracts from the previous week which had a total of -107,968 net contracts.
This week’s current strength score (the trader positioning range over the past three years, measured from 0 to 100) shows the speculators are currently Bearish-Extreme with a score of 18.1 percent. The commercials are Bullish-Extreme with a score of 80.7 percent and the small traders (not shown in chart) are Bullish-Extreme with a score of 81.0 percent.
Price Trend-Following Model: Strong Downtrend
Our weekly trend-following model classifies the current market price position as: Strong Downtrend.
| CORN Futures Statistics | SPECULATORS | COMMERCIALS | SMALL TRADERS |
| – Percent of Open Interest Longs: | 20.2 | 44.6 | 9.3 |
| – Percent of Open Interest Shorts: | 28.8 | 34.5 | 10.7 |
| – Net Position: | -133,174 | 155,179 | -22,005 |
| – Gross Longs: | 313,217 | 690,502 | 144,348 |
| – Gross Shorts: | 446,391 | 535,323 | 166,353 |
| – Long to Short Ratio: | 0.7 to 1 | 1.3 to 1 | 0.9 to 1 |
| NET POSITION TREND: | | | |
| – Strength Index Score (3 Year Range Pct): | 18.1 | 80.7 | 81.0 |
| – Strength Index Reading (3 Year Range): | Bearish-Extreme | Bullish-Extreme | Bullish-Extreme |
| NET POSITION MOVEMENT INDEX: | | | |
| – 6-Week Change in Strength Index: | 3.0 | -2.9 | -3.8 |
SUGAR Futures:
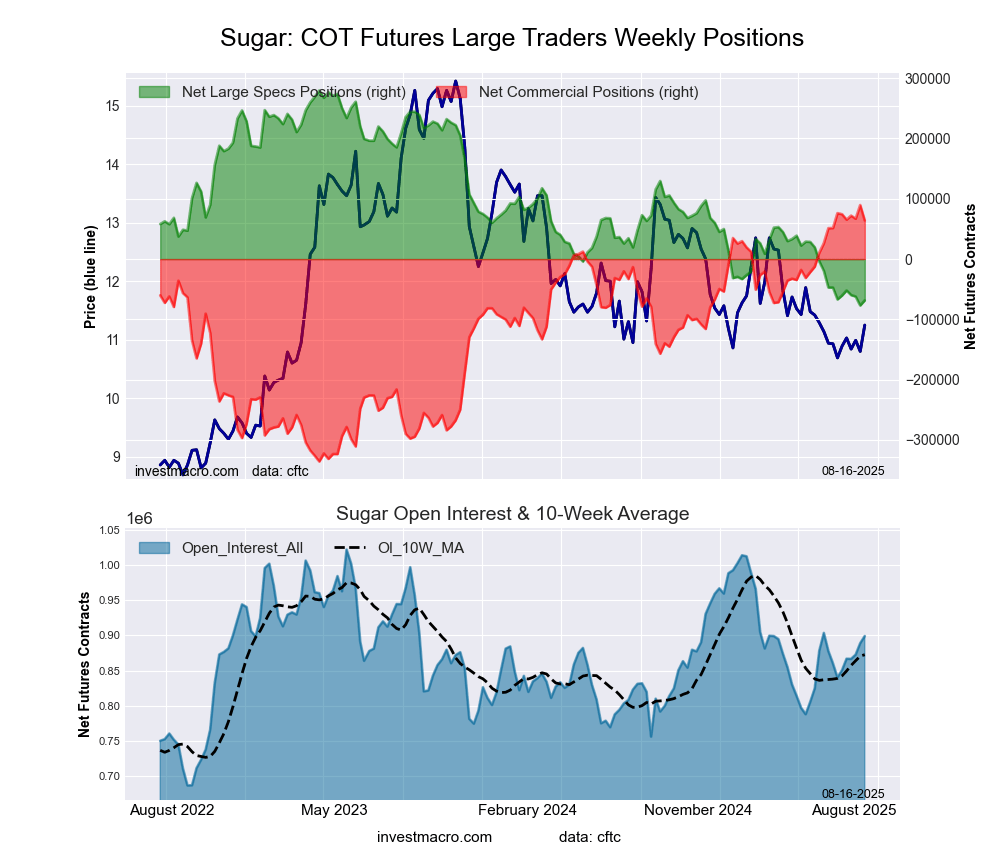 The SUGAR large speculator standing this week came in at a net position of -68,512 contracts in the data reported through Tuesday. This was a weekly boost of 8,460 contracts from the previous week which had a total of -76,972 net contracts.
This week’s current strength score (the trader positioning range over the past three years, measured from 0 to 100) shows the speculators are currently Bearish-Extreme with a score of 2.4 percent. The commercials are Bullish-Extreme with a score of 94.0 percent and the small traders (not shown in chart) are Bearish with a score of 26.9 percent.
Price Trend-Following Model: Downtrend
Our weekly trend-following model classifies the current market price position as: Downtrend.
| SUGAR Futures Statistics | SPECULATORS | COMMERCIALS | SMALL TRADERS |
| – Percent of Open Interest Longs: | 22.1 | 52.3 | 8.0 |
| – Percent of Open Interest Shorts: | 29.7 | 45.2 | 7.5 |
| – Net Position: | -68,512 | 64,008 | 4,504 |
| – Gross Longs: | 198,447 | 470,364 | 72,133 |
| – Gross Shorts: | 266,959 | 406,356 | 67,629 |
| – Long to Short Ratio: | 0.7 to 1 | 1.2 to 1 | 1.1 to 1 |
| NET POSITION TREND: | | | |
| – Strength Index Score (3 Year Range Pct): | 2.4 | 94.0 | 26.9 |
| – Strength Index Reading (3 Year Range): | Bearish-Extreme | Bullish-Extreme | Bearish |
| NET POSITION MOVEMENT INDEX: | | | |
| – 6-Week Change in Strength Index: | -0.4 | -2.9 | 18.9 |
COFFEE Futures:
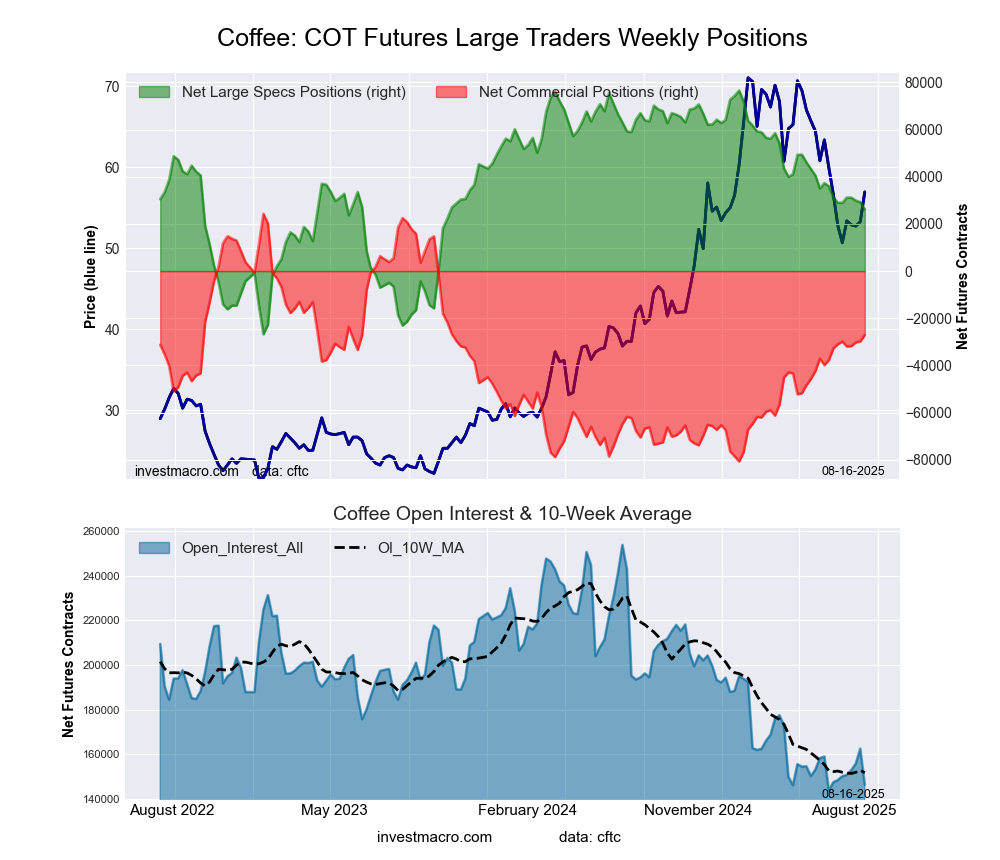 The COFFEE large speculator standing this week came in at a net position of 26,202 contracts in the data reported through Tuesday. This was a weekly lowering of -3,056 contracts from the previous week which had a total of 29,258 net contracts.
This week’s current strength score (the trader positioning range over the past three years, measured from 0 to 100) shows the speculators are currently Bullish with a score of 51.3 percent. The commercials are Bullish with a score of 51.1 percent and the small traders (not shown in chart) are Bearish with a score of 32.6 percent.
Price Trend-Following Model: Weak Downtrend
Our weekly trend-following model classifies the current market price position as: Weak Downtrend.
| COFFEE Futures Statistics | SPECULATORS | COMMERCIALS | SMALL TRADERS |
| – Percent of Open Interest Longs: | 31.8 | 39.1 | 5.2 |
| – Percent of Open Interest Shorts: | 13.9 | 57.6 | 4.6 |
| – Net Position: | 26,202 | -27,078 | 876 |
| – Gross Longs: | 46,593 | 57,194 | 7,616 |
| – Gross Shorts: | 20,391 | 84,272 | 6,740 |
| – Long to Short Ratio: | 2.3 to 1 | 0.7 to 1 | 1.1 to 1 |
| NET POSITION TREND: | | | |
| – Strength Index Score (3 Year Range Pct): | 51.3 | 51.1 | 32.6 |
| – Strength Index Reading (3 Year Range): | Bullish | Bullish | Bearish |
| NET POSITION MOVEMENT INDEX: | | | |
| – 6-Week Change in Strength Index: | -2.7 | 3.7 | -19.6 |
SOYBEANS Futures:
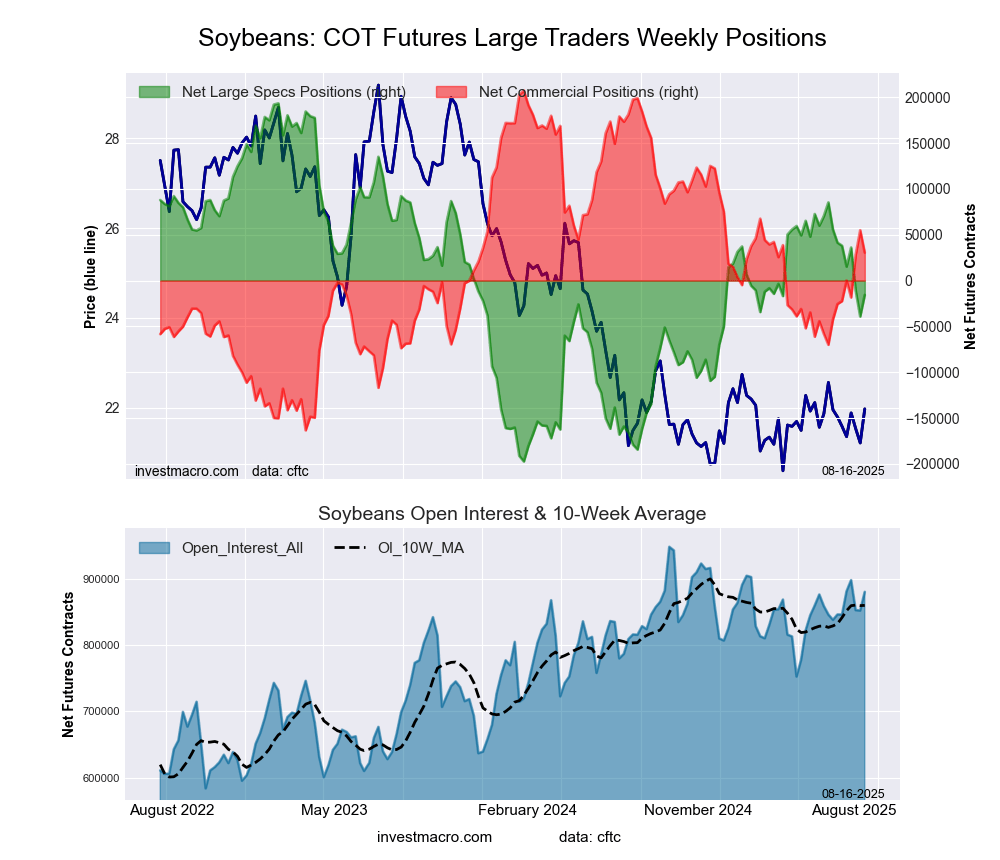 The SOYBEANS large speculator standing this week came in at a net position of -15,575 contracts in the data reported through Tuesday. This was a weekly rise of 23,585 contracts from the previous week which had a total of -39,160 net contracts.
This week’s current strength score (the trader positioning range over the past three years, measured from 0 to 100) shows the speculators are currently Bearish with a score of 46.5 percent. The commercials are Bullish with a score of 52.3 percent and the small traders (not shown in chart) are Bullish with a score of 73.4 percent.
Price Trend-Following Model: Strong Uptrend
Our weekly trend-following model classifies the current market price position as: Strong Uptrend.
| SOYBEANS Futures Statistics | SPECULATORS | COMMERCIALS | SMALL TRADERS |
| – Percent of Open Interest Longs: | 17.4 | 52.3 | 5.6 |
| – Percent of Open Interest Shorts: | 19.2 | 48.8 | 7.3 |
| – Net Position: | -15,575 | 30,518 | -14,943 |
| – Gross Longs: | 153,439 | 460,202 | 49,113 |
| – Gross Shorts: | 169,014 | 429,684 | 64,056 |
| – Long to Short Ratio: | 0.9 to 1 | 1.1 to 1 | 0.8 to 1 |
| NET POSITION TREND: | | | |
| – Strength Index Score (3 Year Range Pct): | 46.5 | 52.3 | 73.4 |
| – Strength Index Reading (3 Year Range): | Bearish | Bullish | Bullish |
| NET POSITION MOVEMENT INDEX: | | | |
| – 6-Week Change in Strength Index: | -14.6 | 15.1 | 2.1 |
SOYBEAN OIL Futures:
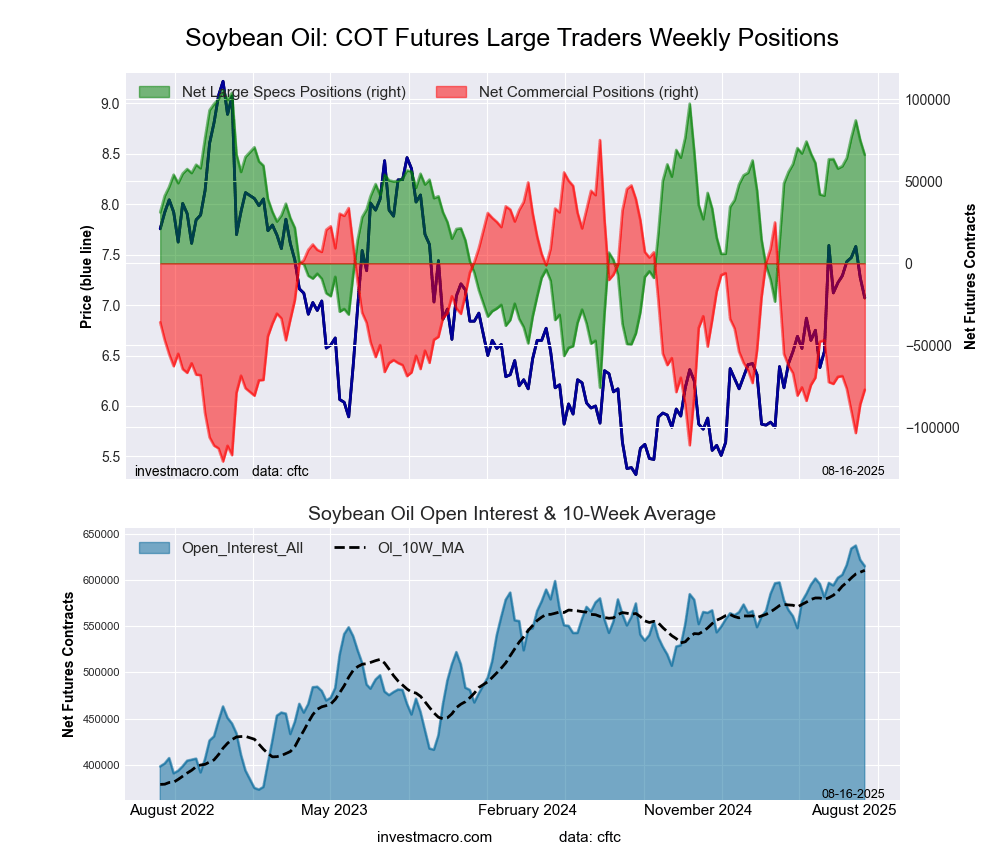 The SOYBEAN OIL large speculator standing this week came in at a net position of 66,069 contracts in the data reported through Tuesday. This was a weekly decrease of -8,877 contracts from the previous week which had a total of 74,946 net contracts.
This week’s current strength score (the trader positioning range over the past three years, measured from 0 to 100) shows the speculators are currently Bullish with a score of 78.3 percent. The commercials are Bearish with a score of 22.3 percent and the small traders (not shown in chart) are Bullish with a score of 73.1 percent.
Price Trend-Following Model: Uptrend
Our weekly trend-following model classifies the current market price position as: Uptrend.
| SOYBEAN OIL Futures Statistics | SPECULATORS | COMMERCIALS | SMALL TRADERS |
| – Percent of Open Interest Longs: | 22.6 | 44.9 | 6.3 |
| – Percent of Open Interest Shorts: | 11.9 | 57.5 | 4.6 |
| – Net Position: | 66,069 | -77,075 | 11,006 |
| – Gross Longs: | 139,219 | 276,377 | 39,003 |
| – Gross Shorts: | 73,150 | 353,452 | 27,997 |
| – Long to Short Ratio: | 1.9 to 1 | 0.8 to 1 | 1.4 to 1 |
| NET POSITION TREND: | | | |
| – Strength Index Score (3 Year Range Pct): | 78.3 | 22.3 | 73.1 |
| – Strength Index Reading (3 Year Range): | Bullish | Bearish | Bullish |
| NET POSITION MOVEMENT INDEX: | | | |
| – 6-Week Change in Strength Index: | 4.6 | -4.0 | -2.6 |
SOYBEAN MEAL Futures:
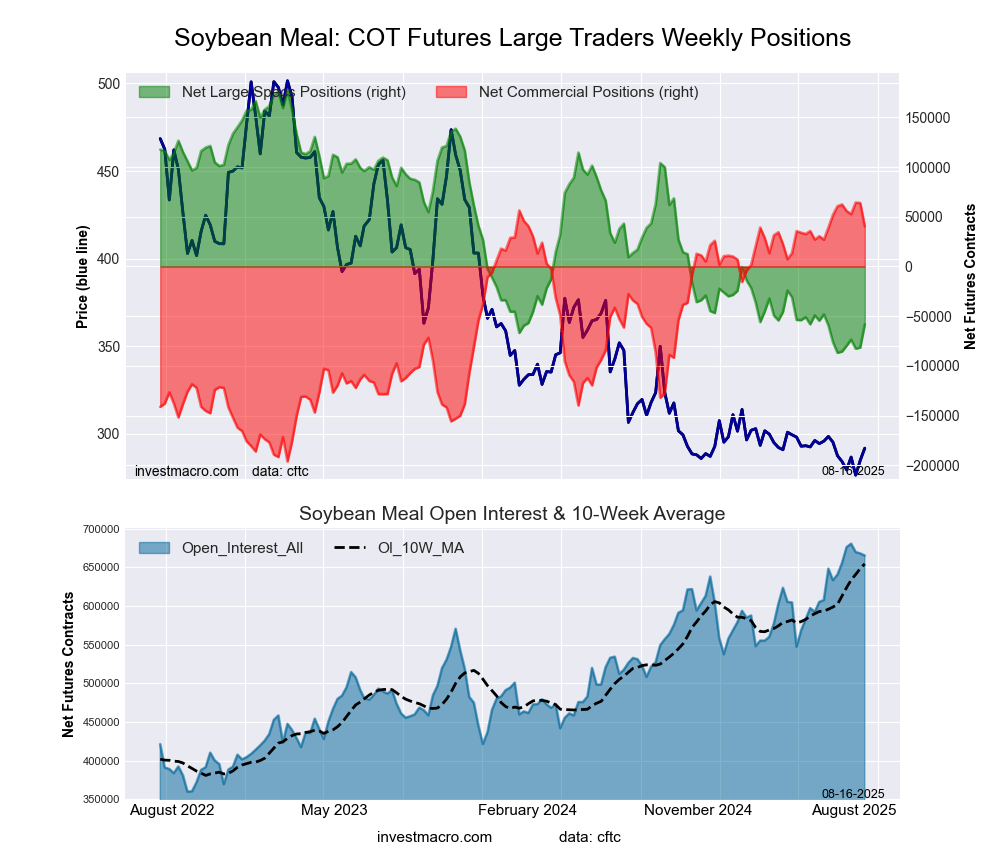 The SOYBEAN MEAL large speculator standing this week came in at a net position of -58,312 contracts in the data reported through Tuesday. This was a weekly advance of 23,298 contracts from the previous week which had a total of -81,610 net contracts.
This week’s current strength score (the trader positioning range over the past three years, measured from 0 to 100) shows the speculators are currently Bearish-Extreme with a score of 10.8 percent. The commercials are Bullish-Extreme with a score of 90.8 percent and the small traders (not shown in chart) are Bearish with a score of 44.5 percent.
Price Trend-Following Model: Weak Downtrend
Our weekly trend-following model classifies the current market price position as: Weak Downtrend.
| SOYBEAN MEAL Futures Statistics | SPECULATORS | COMMERCIALS | SMALL TRADERS |
| – Percent of Open Interest Longs: | 16.7 | 51.5 | 7.8 |
| – Percent of Open Interest Shorts: | 25.5 | 45.4 | 5.1 |
| – Net Position: | -58,312 | 40,390 | 17,922 |
| – Gross Longs: | 111,199 | 342,675 | 51,943 |
| – Gross Shorts: | 169,511 | 302,285 | 34,021 |
| – Long to Short Ratio: | 0.7 to 1 | 1.1 to 1 | 1.5 to 1 |
| NET POSITION TREND: | | | |
| – Strength Index Score (3 Year Range Pct): | 10.8 | 90.8 | 44.5 |
| – Strength Index Reading (3 Year Range): | Bearish-Extreme | Bullish-Extreme | Bearish |
| NET POSITION MOVEMENT INDEX: | | | |
| – 6-Week Change in Strength Index: | 10.8 | -7.8 | -45.8 |
LIVE CATTLE Futures:
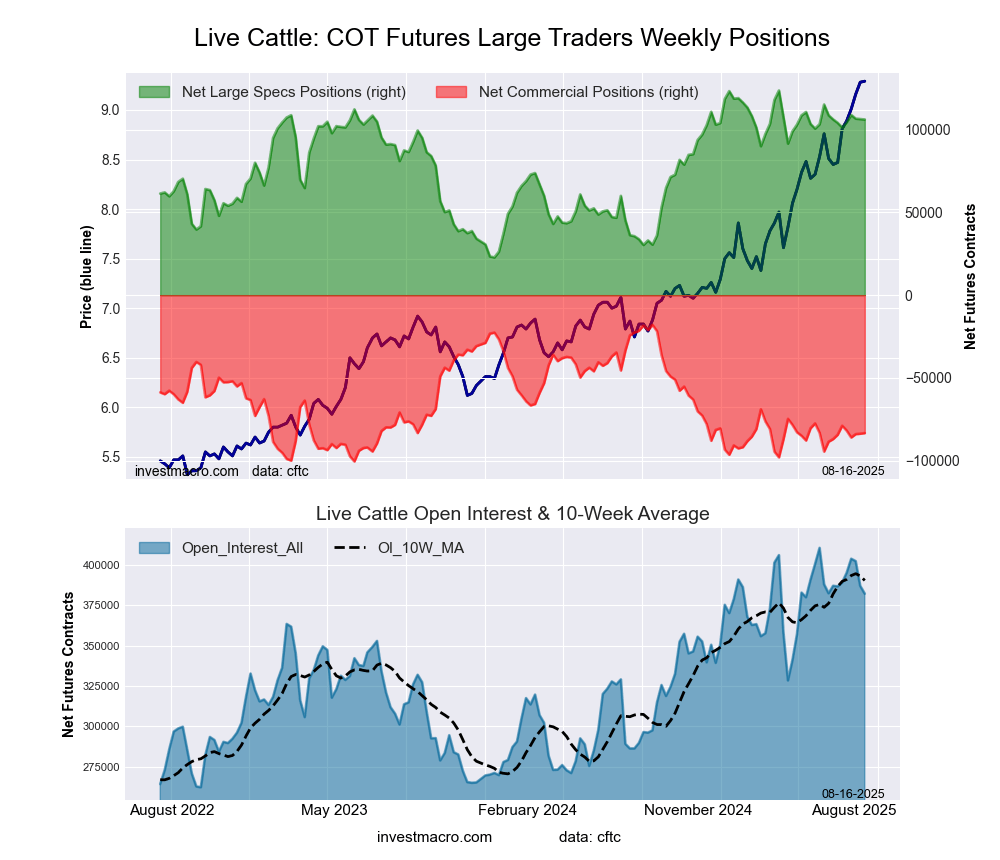 The LIVE CATTLE large speculator standing this week came in at a net position of 106,141 contracts in the data reported through Tuesday. This was a weekly decrease of -234 contracts from the previous week which had a total of 106,375 net contracts.
This week’s current strength score (the trader positioning range over the past three years, measured from 0 to 100) shows the speculators are currently Bullish-Extreme with a score of 82.6 percent. The commercials are Bearish with a score of 20.7 percent and the small traders (not shown in chart) are Bearish-Extreme with a score of 17.2 percent.
Price Trend-Following Model: Strong Uptrend
Our weekly trend-following model classifies the current market price position as: Strong Uptrend.
| LIVE CATTLE Futures Statistics | SPECULATORS | COMMERCIALS | SMALL TRADERS |
| – Percent of Open Interest Longs: | 48.1 | 29.2 | 7.6 |
| – Percent of Open Interest Shorts: | 20.3 | 51.0 | 13.5 |
| – Net Position: | 106,141 | -83,367 | -22,774 |
| – Gross Longs: | 183,808 | 111,511 | 28,951 |
| – Gross Shorts: | 77,667 | 194,878 | 51,725 |
| – Long to Short Ratio: | 2.4 to 1 | 0.6 to 1 | 0.6 to 1 |
| NET POSITION TREND: | | | |
| – Strength Index Score (3 Year Range Pct): | 82.6 | 20.7 | 17.2 |
| – Strength Index Reading (3 Year Range): | Bullish-Extreme | Bearish | Bearish-Extreme |
| NET POSITION MOVEMENT INDEX: | | | |
| – 6-Week Change in Strength Index: | 2.0 | 1.2 | -10.2 |
LEAN HOGS Futures:
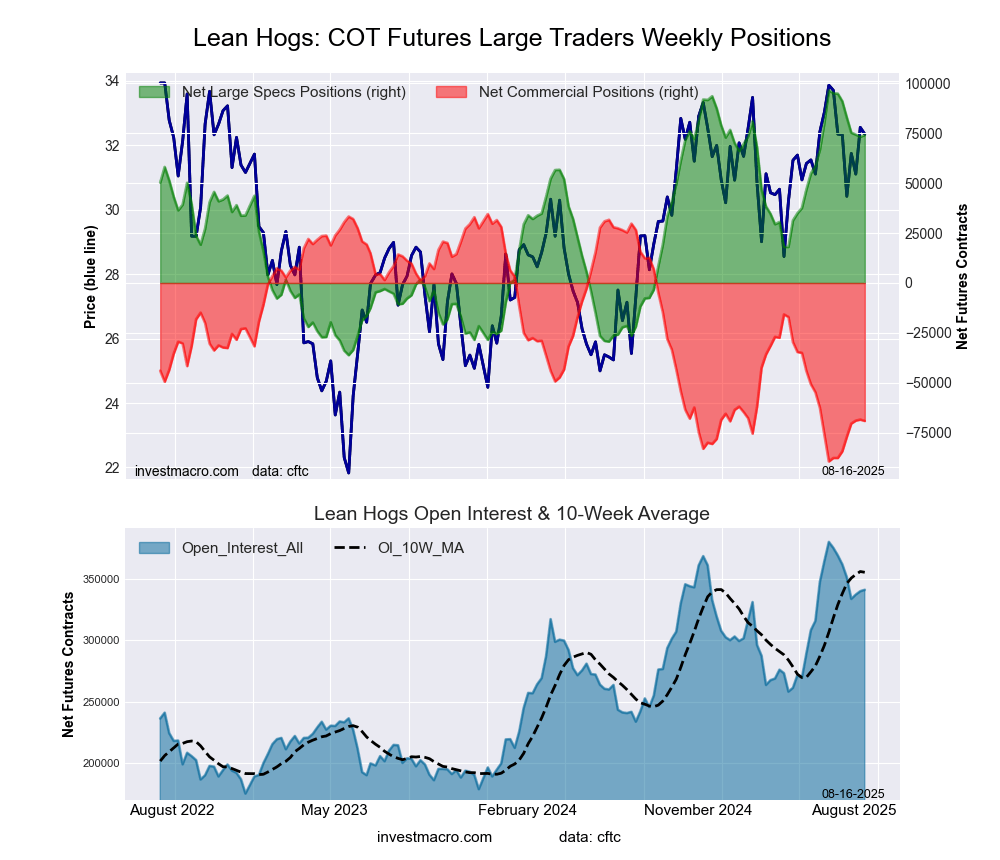 The LEAN HOGS large speculator standing this week came in at a net position of 73,927 contracts in the data reported through Tuesday. This was a weekly increase of 789 contracts from the previous week which had a total of 73,138 net contracts.
This week’s current strength score (the trader positioning range over the past three years, measured from 0 to 100) shows the speculators are currently Bullish-Extreme with a score of 83.1 percent. The commercials are Bearish-Extreme with a score of 16.4 percent and the small traders (not shown in chart) are Bearish with a score of 48.1 percent.
Price Trend-Following Model: Weak Uptrend
Our weekly trend-following model classifies the current market price position as: Weak Uptrend.
| LEAN HOGS Futures Statistics | SPECULATORS | COMMERCIALS | SMALL TRADERS |
| – Percent of Open Interest Longs: | 45.0 | 28.7 | 6.0 |
| – Percent of Open Interest Shorts: | 23.4 | 49.0 | 7.4 |
| – Net Position: | 73,927 | -69,042 | -4,885 |
| – Gross Longs: | 153,610 | 98,076 | 20,430 |
| – Gross Shorts: | 79,683 | 167,118 | 25,315 |
| – Long to Short Ratio: | 1.9 to 1 | 0.6 to 1 | 0.8 to 1 |
| NET POSITION TREND: | | | |
| – Strength Index Score (3 Year Range Pct): | 83.1 | 16.4 | 48.1 |
| – Strength Index Reading (3 Year Range): | Bullish-Extreme | Bearish-Extreme | Bearish |
| NET POSITION MOVEMENT INDEX: | | | |
| – 6-Week Change in Strength Index: | -15.7 | 15.0 | 13.6 |
COTTON Futures:
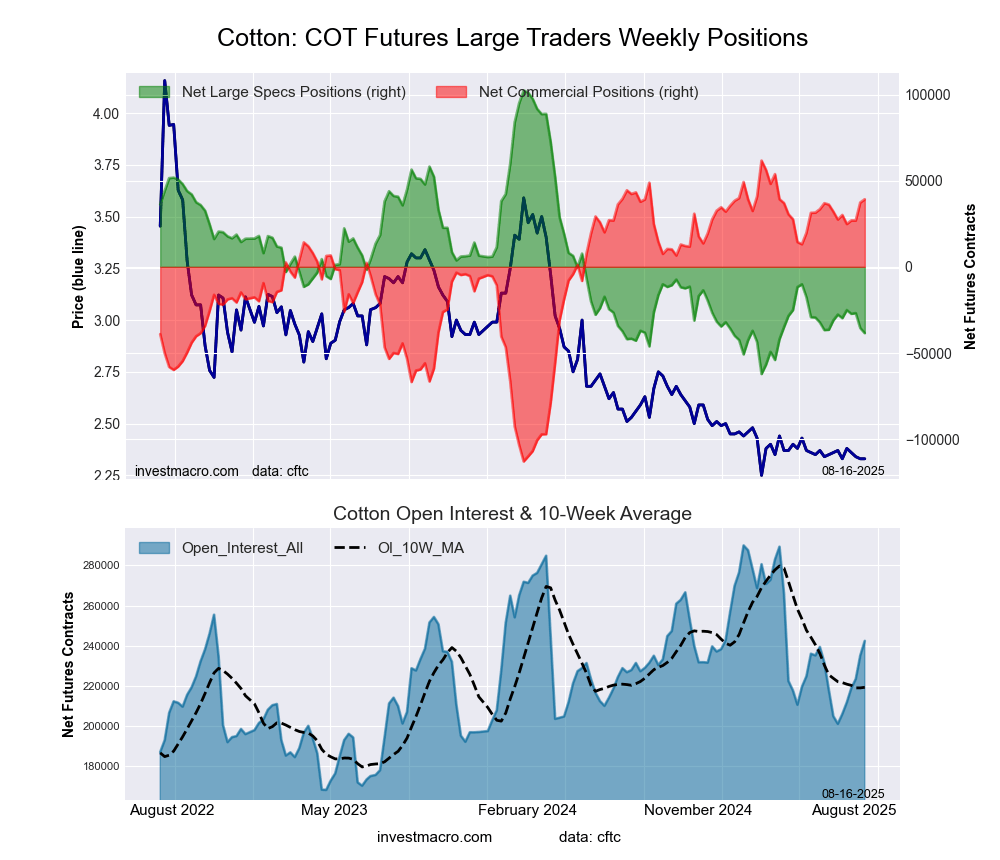 The COTTON large speculator standing this week came in at a net position of -38,439 contracts in the data reported through Tuesday. This was a weekly fall of -2,961 contracts from the previous week which had a total of -35,478 net contracts.
This week’s current strength score (the trader positioning range over the past three years, measured from 0 to 100) shows the speculators are currently Bearish-Extreme with a score of 14.4 percent. The commercials are Bullish-Extreme with a score of 87.2 percent and the small traders (not shown in chart) are Bearish-Extreme with a score of 16.7 percent.
Price Trend-Following Model: Downtrend
Our weekly trend-following model classifies the current market price position as: Downtrend.
| COTTON Futures Statistics | SPECULATORS | COMMERCIALS | SMALL TRADERS |
| – Percent of Open Interest Longs: | 28.1 | 46.6 | 4.8 |
| – Percent of Open Interest Shorts: | 44.0 | 30.5 | 5.1 |
| – Net Position: | -38,439 | 39,218 | -779 |
| – Gross Longs: | 68,099 | 113,063 | 11,588 |
| – Gross Shorts: | 106,538 | 73,845 | 12,367 |
| – Long to Short Ratio: | 0.6 to 1 | 1.5 to 1 | 0.9 to 1 |
| NET POSITION TREND: | | | |
| – Strength Index Score (3 Year Range Pct): | 14.4 | 87.2 | 16.7 |
| – Strength Index Reading (3 Year Range): | Bearish-Extreme | Bullish-Extreme | Bearish-Extreme |
| NET POSITION MOVEMENT INDEX: | | | |
| – 6-Week Change in Strength Index: | -6.5 | 6.7 | -7.2 |
COCOA Futures:
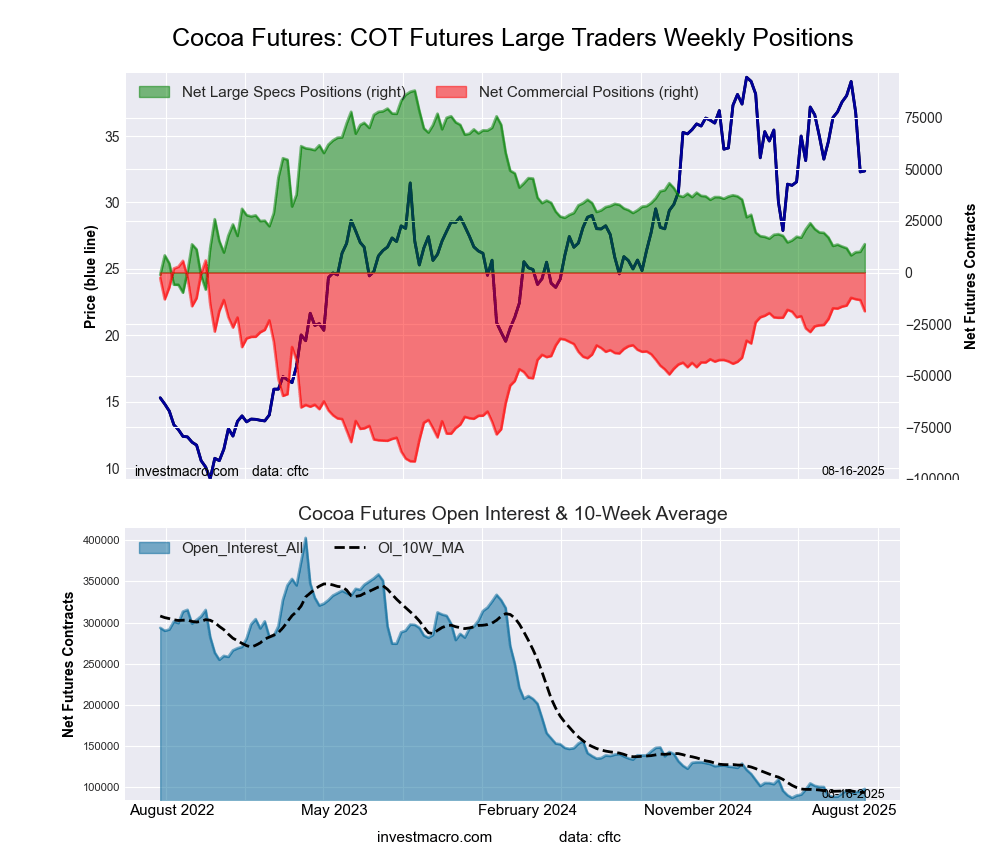 The COCOA large speculator standing this week came in at a net position of 13,749 contracts in the data reported through Tuesday. This was a weekly increase of 3,706 contracts from the previous week which had a total of 10,043 net contracts.
This week’s current strength score (the trader positioning range over the past three years, measured from 0 to 100) shows the speculators are currently Bearish with a score of 24.0 percent. The commercials are Bullish with a score of 74.8 percent and the small traders (not shown in chart) are Bullish with a score of 71.3 percent.
Price Trend-Following Model: Weak Uptrend
Our weekly trend-following model classifies the current market price position as: Weak Uptrend.
| COCOA Futures Statistics | SPECULATORS | COMMERCIALS | SMALL TRADERS |
| – Percent of Open Interest Longs: | 28.1 | 40.6 | 12.2 |
| – Percent of Open Interest Shorts: | 14.0 | 59.9 | 7.1 |
| – Net Position: | 13,749 | -18,785 | 5,036 |
| – Gross Longs: | 27,469 | 39,736 | 11,968 |
| – Gross Shorts: | 13,720 | 58,521 | 6,932 |
| – Long to Short Ratio: | 2.0 to 1 | 0.7 to 1 | 1.7 to 1 |
| NET POSITION TREND: | | | |
| – Strength Index Score (3 Year Range Pct): | 24.0 | 74.8 | 71.3 |
| – Strength Index Reading (3 Year Range): | Bearish | Bullish | Bullish |
| NET POSITION MOVEMENT INDEX: | | | |
| – 6-Week Change in Strength Index: | 0.2 | -1.3 | 11.9 |
WHEAT Futures:
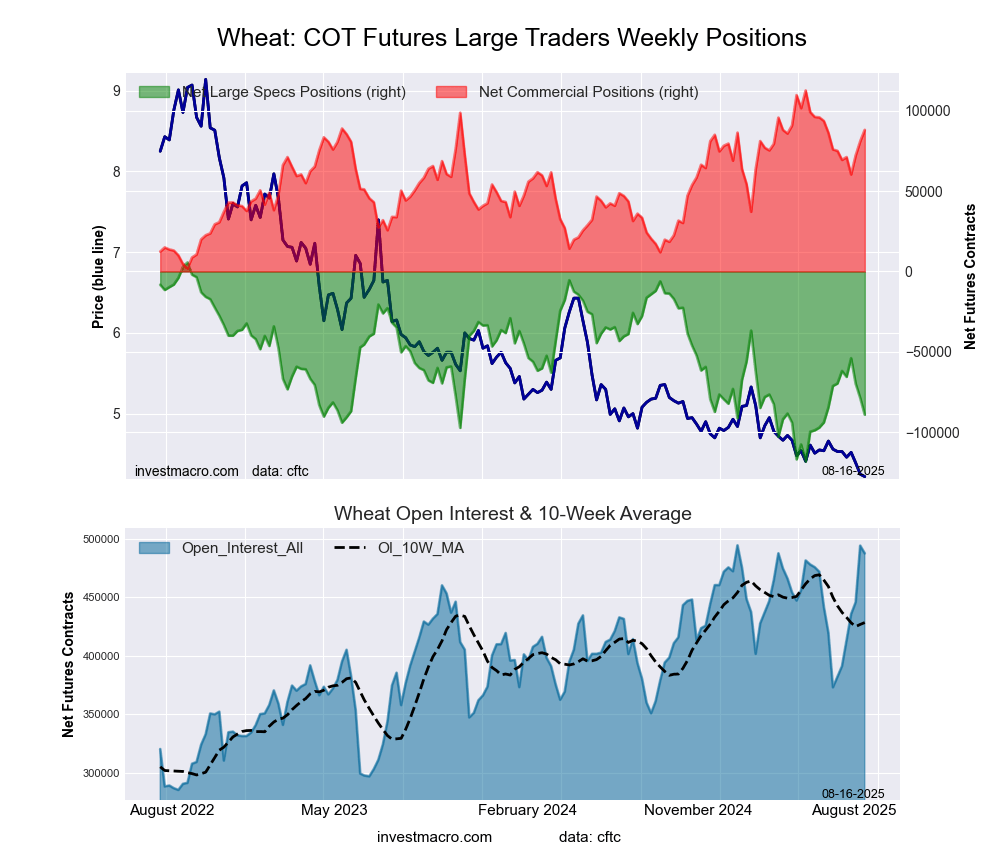 The WHEAT large speculator standing this week came in at a net position of -89,046 contracts in the data reported through Tuesday. This was a weekly decrease of -10,481 contracts from the previous week which had a total of -78,565 net contracts.
This week’s current strength score (the trader positioning range over the past three years, measured from 0 to 100) shows the speculators are currently Bearish with a score of 23.5 percent. The commercials are Bullish with a score of 77.9 percent and the small traders (not shown in chart) are Bullish with a score of 60.1 percent.
Price Trend-Following Model: Strong Downtrend
Our weekly trend-following model classifies the current market price position as: Strong Downtrend.
| WHEAT Futures Statistics | SPECULATORS | COMMERCIALS | SMALL TRADERS |
| – Percent of Open Interest Longs: | 27.4 | 37.0 | 7.9 |
| – Percent of Open Interest Shorts: | 45.6 | 19.0 | 7.7 |
| – Net Position: | -89,046 | 88,024 | 1,022 |
| – Gross Longs: | 133,455 | 180,598 | 38,421 |
| – Gross Shorts: | 222,501 | 92,574 | 37,399 |
| – Long to Short Ratio: | 0.6 to 1 | 2.0 to 1 | 1.0 to 1 |
| NET POSITION TREND: | | | |
| – Strength Index Score (3 Year Range Pct): | 23.5 | 77.9 | 60.1 |
| – Strength Index Reading (3 Year Range): | Bearish | Bullish | Bullish |
| NET POSITION MOVEMENT INDEX: | | | |
| – 6-Week Change in Strength Index: | -15.7 | 11.8 | 37.3 |
Article By InvestMacro – Receive our weekly COT Newsletter
*COT Report: The COT data, released weekly to the public each Friday, is updated through the most recent Tuesday (data is 3 days old) and shows a quick view of how large speculators or non-commercials (for-profit traders) were positioned in the futures markets.
The CFTC categorizes trader positions according to commercial hedgers (traders who use futures contracts for hedging as part of the business), non-commercials (large traders who speculate to realize trading profits) and nonreportable traders (usually small traders/speculators) as well as their open interest (contracts open in the market at time of reporting). See CFTC criteria here.