
By RoboForex Analytical Department
On Friday, the USD/JPY pair advanced to 146.93, marking a three-week high as the US dollar continued to strengthen against a backdrop of escalating global trade tensions.
Recent developments in US trade policy have further unsettled markets. US President Donald Trump announced additional tariffs, including a 35% levy on Canadian imports, alongside plans for sweeping 15-20% duties on most other trading partners.
Of particular concern are US-Japan relations, following Trump’s imposition of a 25% tariff on Japanese goods this week, set to take effect on 1 August. The move has intensified bilateral strains, with Japanese Prime Minister Shigeru Ishiba warning of the need to reduce Japan’s reliance on the US in defence, food security, and energy.
Ishiba described the ongoing negotiations as a “battle for national interests”. At the same time, a leading Japanese think tank projected that the tariffs could shave 0.8% off Japan’s GDP in 2025, with a cumulative decline of 1.9% by 2029.
Technical Analysis: USD/JPY
Free Reports:
 Download Our Metatrader 4 Indicators – Put Our Free MetaTrader 4 Custom Indicators on your charts when you join our Weekly Newsletter
 Get our Weekly Commitment of Traders Reports - See where the biggest traders (Hedge Funds and Commercial Hedgers) are positioned in the futures markets on a weekly basis.
H4 Chart:
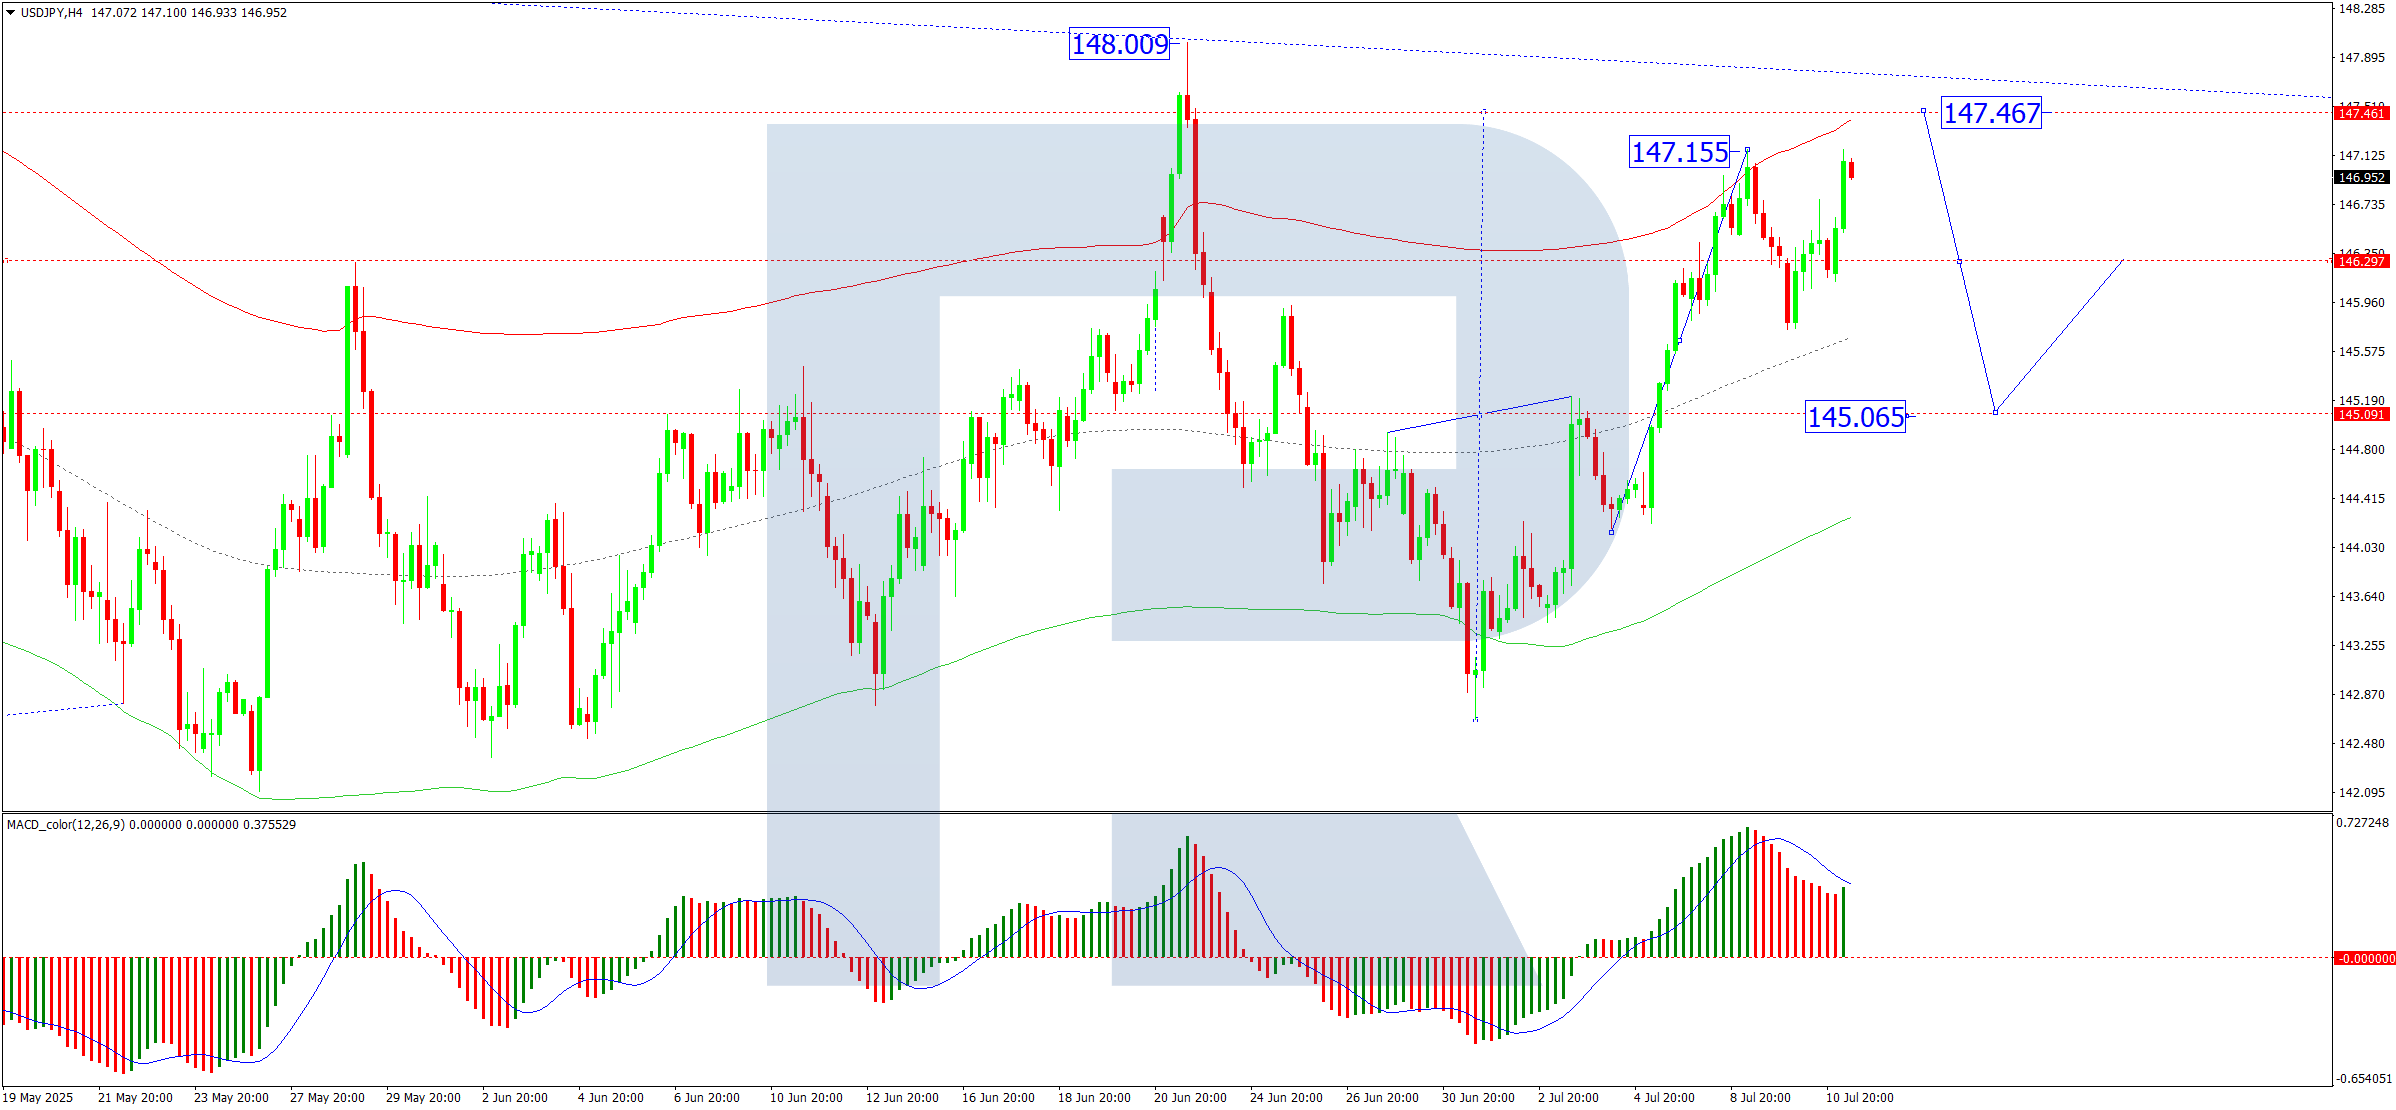
The USD/JPY has established a consolidation range around 145.65, now extending to 147.17. A short-term pullback to 145.65 (testing from above) is anticipated, followed by a potential upward wave targeting 147.47 at minimum. This outlook is supported by the MACD indicator, with its signal line firmly above zero and trending upward.
H1 Chart:

A consolidation phase near 146.41 preceded an upward breakout, completing a wave structure at 147.17. A downward correction towards 145.65 is now in view, corroborated by the Stochastic oscillator, where the signal line sits at 80 and points sharply downward.
Conclusion
The yen’s weakness persists amid dollar strength and trade uncertainties, with technical indicators suggesting near-term volatility. Traders should monitor 145.65 as a key support level, while further upside towards 147.47 remains plausible.
Disclaimer
Any forecasts contained herein are based on the author’s particular opinion. This analysis may not be treated as trading advice. RoboForex bears no responsibility for trading results based on trading recommendations and reviews contained herein.

- The Tech‑heavy NASDAQ Index jumped by more than 3.3%. The offshore yuan is trading at its highest level since 2023 Jul 31, 2026
- USD/JPY After Volatility: Multiple Events in One Day Jul 31, 2026
- The US indices sell off amid renewed US-Iran clashes. Oil jumps by 7% Jul 30, 2026
- USD/JPY Temporary in Equilibrium: Multiple Factors in Focus Jul 30, 2026
- GBP/USD at Month’s Lows: The Outlook Remains Weak Jul 29, 2026
- Crude oil falls below $80 per barrel. Australia sees inflation slowdown Jul 29, 2026
- The US Tech sector hit by sell‑off. Oil prices decline on renewed negotiations Jul 28, 2026
- Gold Declines, Focus on Fed and Falling Oil Prices Jul 28, 2026
- This week will be one of the most crowded for central‑bank meetings Jul 27, 2026
- EUR/USD Ahead of a Key Week: Holding Near Lows Jul 27, 2026
