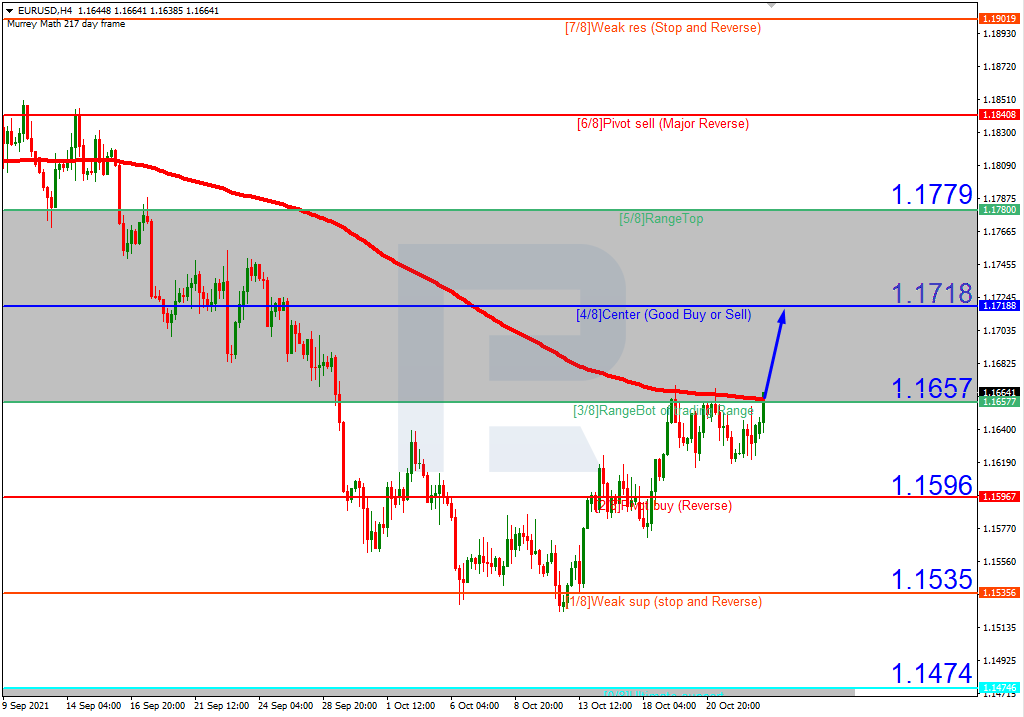
In the H4 chart, after breaking 3/8, EURUSD is consolidating. In this case, the price is expected to continue growing to reach the resistance at 4/8. Still, this scenario may no longer be valid if the price breaks 3/8 to the downside. After that, the instrument may fall towards the support at 1/8.
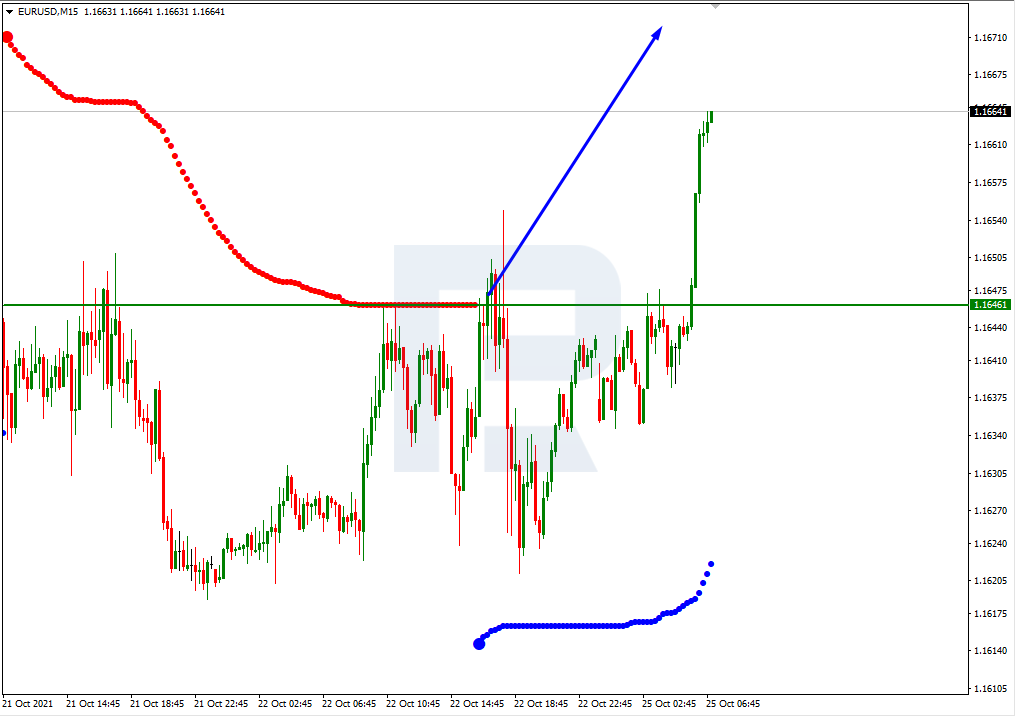
As we can see in the M15 chart, the pair has broken the upside line of the VoltyChannel indicator and, as a result, may continue its growth.
GBPUSD, “Great Britain Pound vs US Dollar”
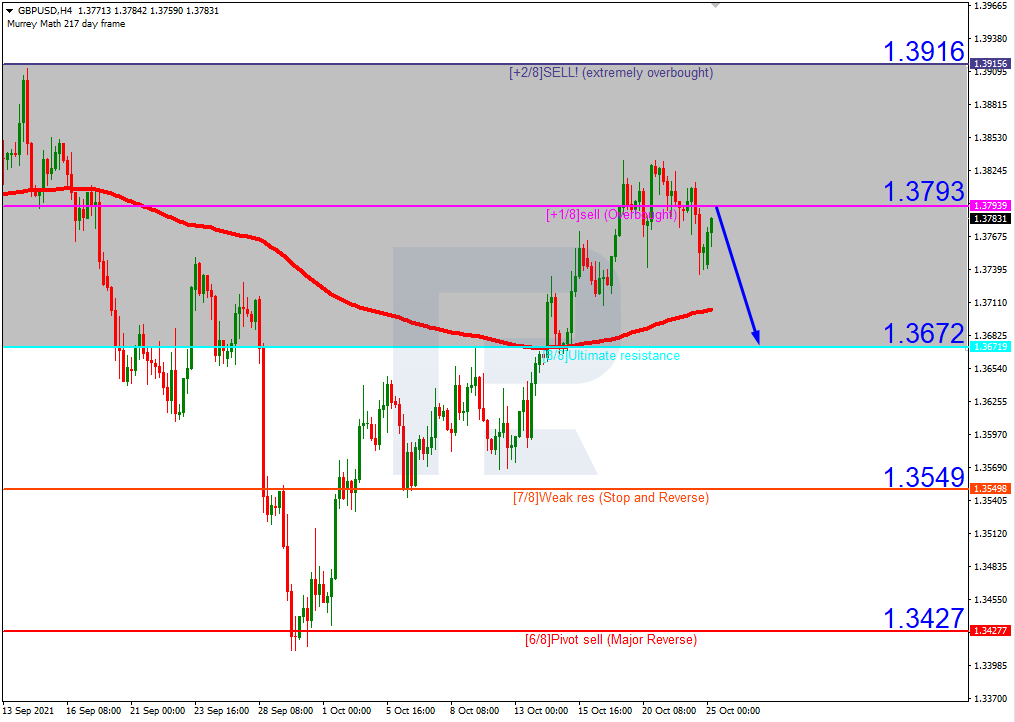
In the H4 chart, GBPUSD is still moving within the “overbought area”. In this case, the asset is expected to test +1/8, rebound from it, and then resume falling towards the support at 8/8. However, this scenario may no longer be valid if the price breaks +1/8 to the upside. After that, the instrument may continue growing to reach the resistance at +2/8.
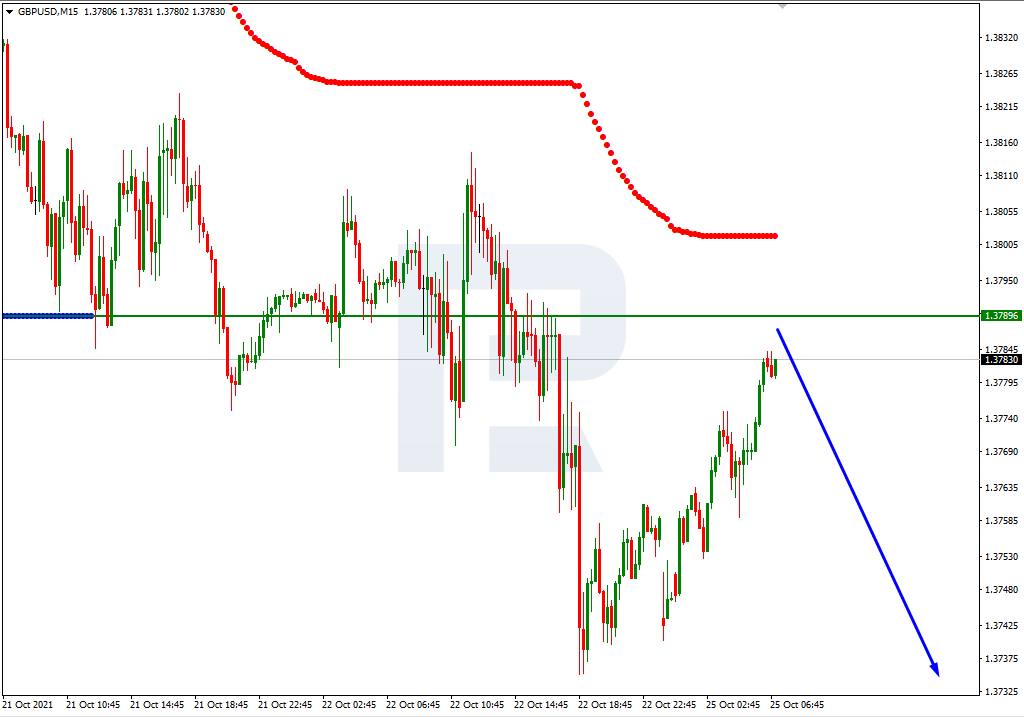
As we can see in the M15 chart, the pair has broken the downside line of the VoltyChannel indicator and, as a result, may continue trading downwards to reach 8/8 from the H4 chart.
Attention! Forecasts presented in this section only reflect the author’s private opinion and should not be considered as guidance for trading. RoboForex LP bears no responsibility for trading results based on trading recommendations described in these analytical reviews.
On Thursday, traders were a little surprised, if not disconcerted, following the third-quarter earnings report from Tri Pointe Homes. This is one of the US major home builders, and although they had relatively good overall earnings there were two points that were concerning.
Average sales price -1%. This might not seem all that significant. However, in an industry that has so far been growing at twice the inflation rate, a drop in prices signifies a substantial loss of interest.
Forward orders -30%. Compounding the prior assessment, a significant drop in people signing up to buy new homes could be evidence that the market is reaching its limits.
Of course, a single company’s report doesn’t necessarily imply an overall trend. But, it could be the canary in the coal mine.
Tri Pointe sells at the higher end of the market, with average sales prices of over $600K per home. So, if there were trouble in the housing market, we’d likely see it in the higher end first.
The underlying issue
Average mortgage rates in the US have been on the rise since September when the Fed announced that they would start their taper.
Analysts anticipate that the Fed is going to cut its purchase of mortgage-backed securities by $10B when they do start winding down their buying spree. The emergency monetary measures had pushed mortgage rates down to record lows last year.
Average mortgage rates recently cracked above the 3.0% level. But they are still far from the 3.5-4.5% range that was normal before the pandemic. With soaring raw material costs home builders could be feeling the pinch as they try to pass on costs to customers.
Upcoming data
Tomorrow we get the release of new home sales data for the US, which could show a slowing of growth.
Throughout the summer, home sales numbers had been slowly increasing. Nevertheless, they were already below last year’s high levels when interest rates were significantly lower.
Economists are forecasting that there were 755K home sales during September, compared to 740K reported in August. That would be a slowing of the growth pace to a 1% monthly increase from a 1.5% increase prior.
The broader economic impact
The prices of homes are not factored into inflation calculations and don’t appear to be something on the Fed’s radar yet.
If the Fed pushes for higher interest rates in the near future though it could put a damper on house buying. Dividend payments are the largest component of American household spending, and many rely on home equity loans. Higher interest rates would restrict their potential spending pool.
Given how important the housing market is to the US economy, traders are likely to be paying close attention to this sector throughout the rest of the earnings season.
Maybe Tri Pointe’s results were just unusual, and other companies will have better results. DR Horton reports on November 9th. As the largest US homebuilder, their earnings report might be the key to understanding what’s going on in the market.
Orbex is a fully licensed broker that was established in 2011. Founded with a mission to serve its traders responsibly and provides traders with access to the world’s largest and most liquid financial markets. www.orbex.com
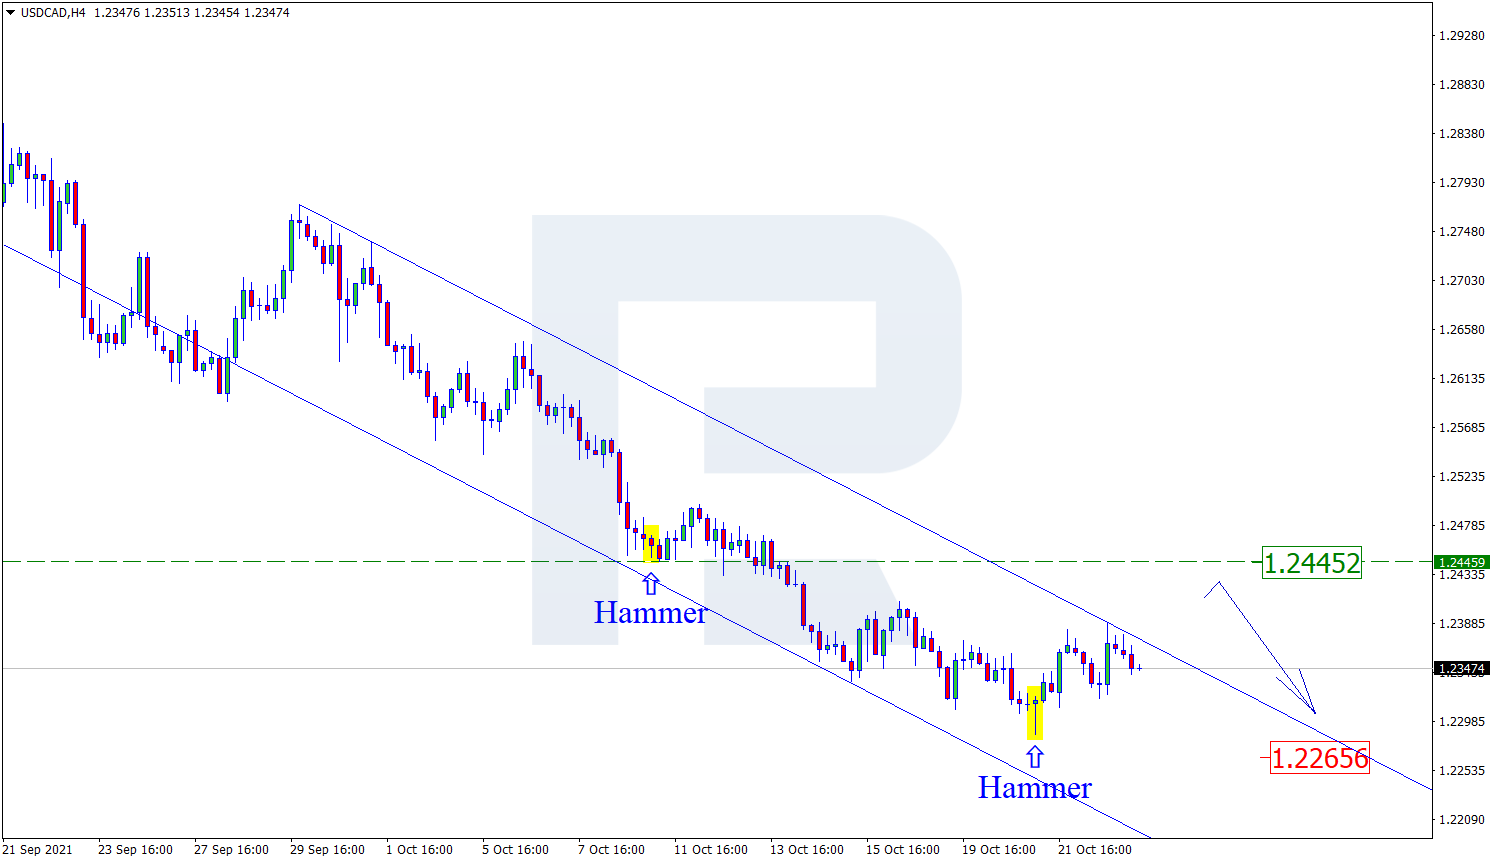
As we can see in the H4 chart, after forming several reversal patterns, including Hammer, close to the support level, USDCAD may reverse in the form of a new correctional impulse. In this case, the correctional target may be the resistance area at 1.2445. However, an alternative scenario implies that the asset may continue falling to reach 1.2265 without reversing and correcting.
AUDUSD, “Australian Dollar vs US Dollar”
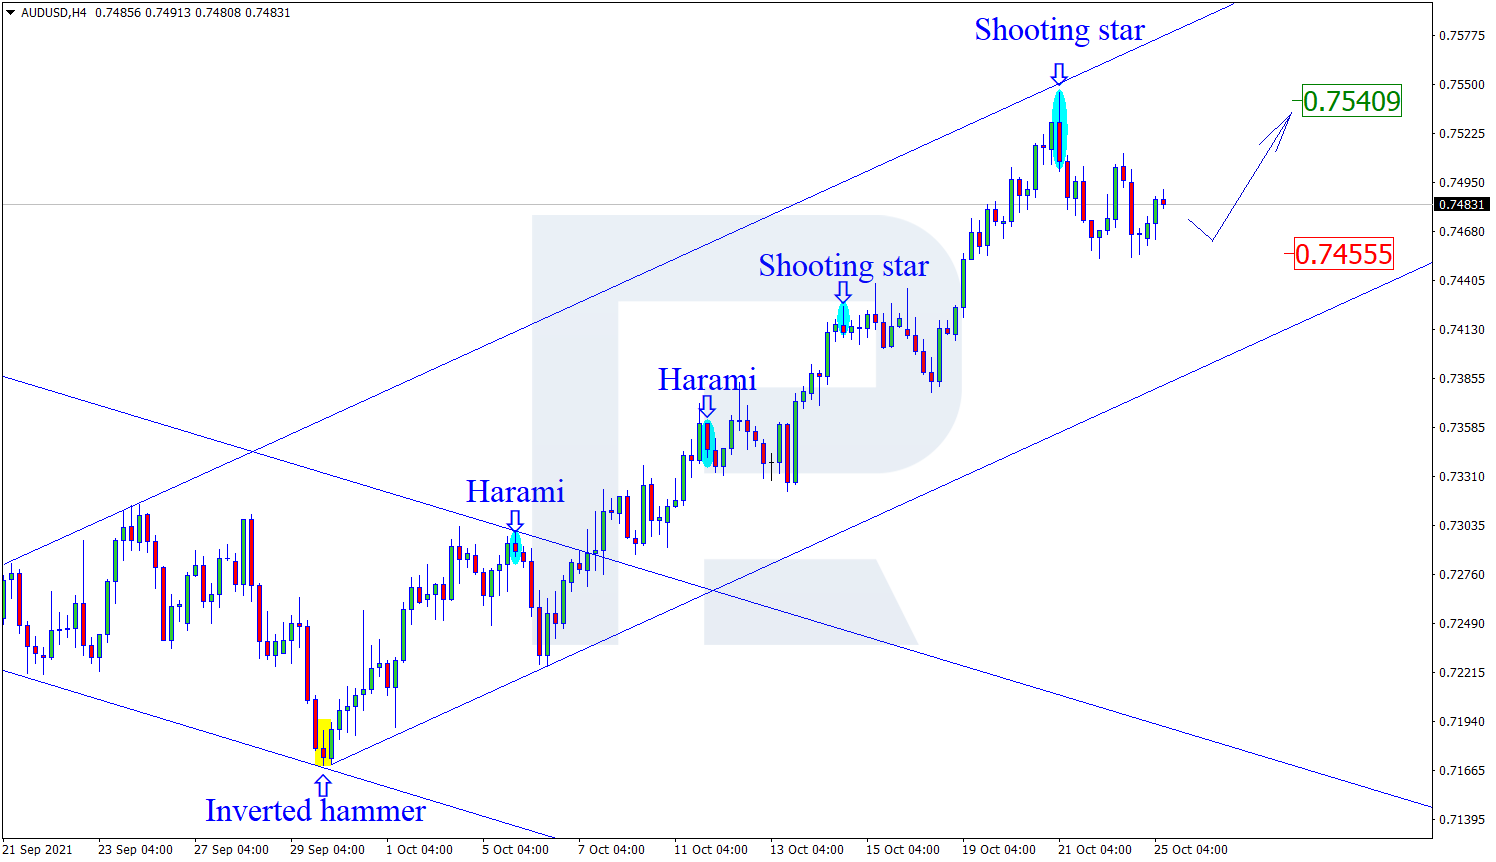
As we can see in the H4 chart, AUDUSD has formed a Shooting Star reversal pattern while testing the resistance level. At the moment, the asset may reverse and start a new pullback. In this case, the correctional target may be at 0.7455. At the same time, an opposite scenario implies that the price may continue growing towards 0.7540 without reversing and forming any corrections.
USDCHF, “US Dollar vs Swiss Franc”
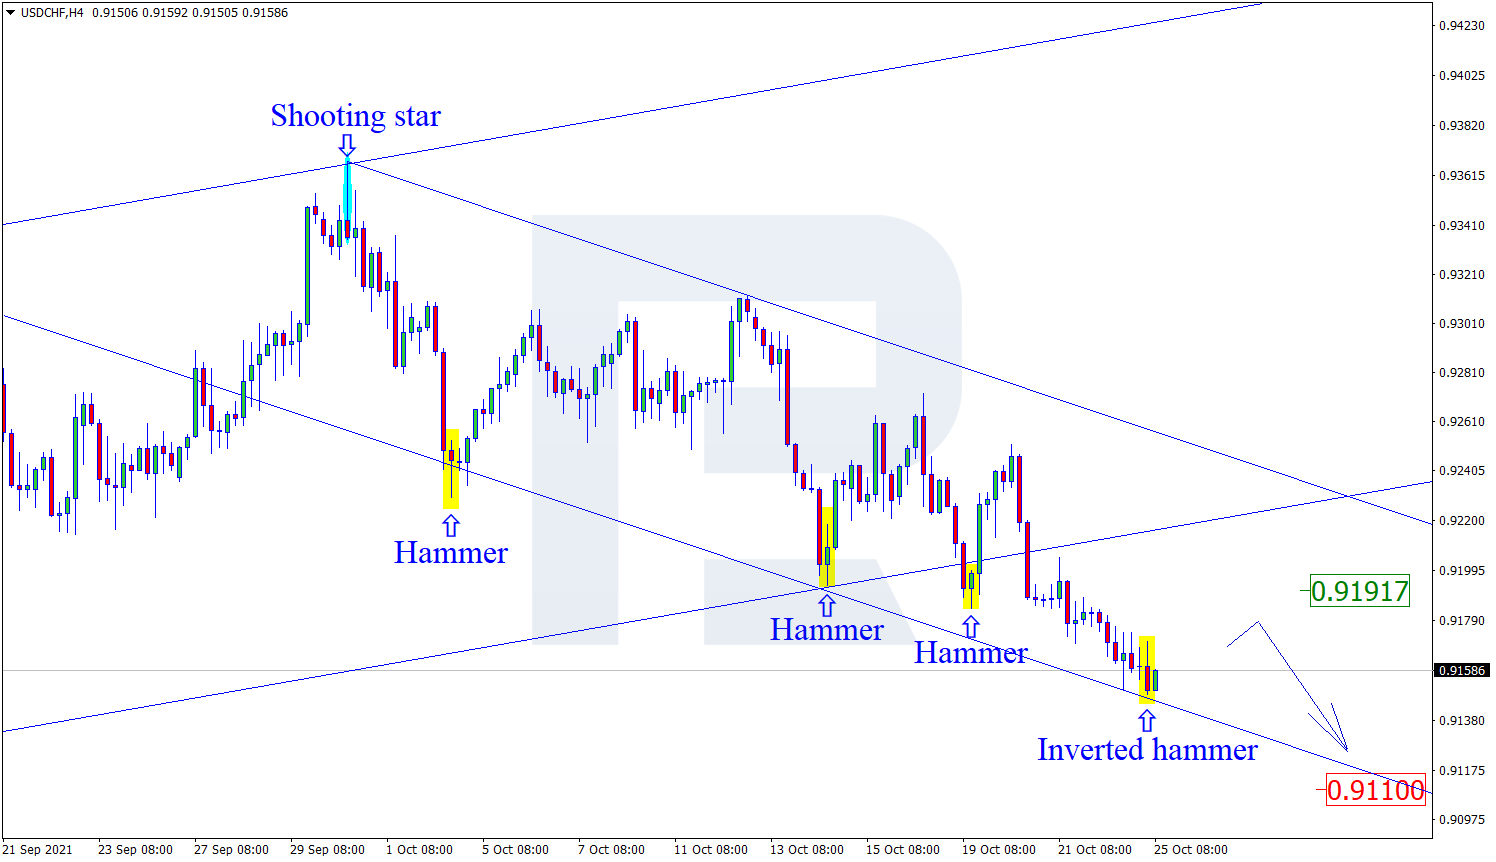
As we can see in the H4 chart, after testing the rising channel’s downside border once again, the pair has formed several reversal patterns, for example, Inverted Hammer. At the moment, USDCHF is reversing in the form of a new correctional wave towards the resistance level. In this case, the upside target may be at 0.9191. Still, there might be an alternative scenario, according to which the asset may continue falling to reach 0.9110 without correcting towards the resistance level.
Attention! Forecasts presented in this section only reflect the author’s private opinion and should not be considered as guidance for trading. RoboForex LP bears no responsibility for trading results based on trading recommendations described in these analytical reviews.
The current SPX500 formation suggests the construction of a large bullish impulse that consists of primary sub-waves.
At the time of writing, the primary wave ③ is under development. Intermediate sub-waves (1)-(2)-(3)-(4)-(5) marked this impulse. This pattern may soon come to an end.
Not so long ago the price was moving in minor wave 4, and then the bulls took the initiative and led the market up in wave 5. We can assume that wave 5 will take the form of a minute impulse, and can complete near 5033.15.
At that level, the intermediate wave (5) will be at the 161.8% Fibonacci extension of wave (3).
Alternatively, the construction of an impulse wave ③ is almost complete. Perhaps in the near term, after a small minuette correction, the price will rise a little more in the sub-wave (v) to the 4639.65 area.
Thus, after the full completion of wave ③, the price could begin to fall within the primary correction ④.
Consequently, in the near future, we could expect a corrective decline near 3807.17. At that level, primary wave ④ will be at 38.2% of impulse wave ③.
Orbex is a fully licensed broker that was established in 2011. Founded with a mission to serve its traders responsibly and provides traders with access to the world’s largest and most liquid financial markets. www.orbex.com
USD: US September personal income and spending, PCE price index, October consumer sentiment
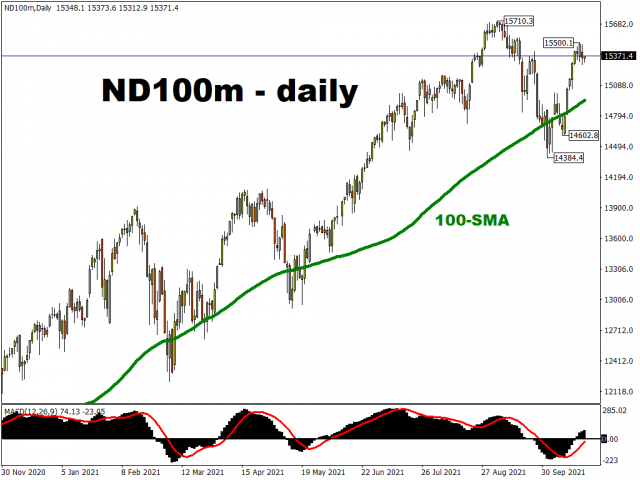
The ongoing US earnings season has already helped the likes of the S&P 500 and the Dow Jones indexes to close at fresh record highs this past week. Over the coming days, with the likes of Facebook, Twitter, Alphabet (Google’s parent company), Microsoft, Amazon, and Apple all due to release their respective earnings, could Big Tech’s earnings help push the Nasdaq 100 index to a fresh record high as well?
Note that the tech behemoths listed above have a combined value of over US$ 9 trillion, which is about 52% of the Nasdaq 100’s total market cap. In other words, given the sheer size of these stocks (except for Twitter which is not a member of the Nasdaq 100 index), they should have a major say on how the broader index performs.
Given that the Nasdaq 100 is just some 2% from its highest-ever closing price, which was registered on 7th September, one would think that a fresh peak is within reach. However, those who have been following global markets would know of the major headwinds facing tech stocks. From the looming prospects of Fed rate hikes (overall, tech stocks do not perform well as US interest rates rise), to global supply chain issues, to heightened regulatory scrutiny, there are enough reasons on the table currently to warrant caution surrounding tech stocks. Recall how the share prices of social media platforms such as Facebook and Twitter were dragged lower by Snap’s dismal outlook after reporting its own earnings last week.
In short, it might be a bigger ask for the Nasdaq 100 to climb to a new summit relative to the S&P 500 and the Dow, given the challenges for tech companies.
As for the economic calendar, the Bank of Canada, European Central Bank, and the Bank of Japan are all not expected to adjust their respective benchmark rates this week nor make any policy adjustments. However, it’s their commentary surrounding their next policy move which could move their respective currencies. Should any of these central bankers harp on concerns over potentially out-of-control inflation, that might suggest that they’d have to raise rates earlier than expected. Such an outlook could push their currency higher; so watch the CAD, EUR, and JPY pairs.
The GDP prints out of the US and the Eurozone, as well as China’s latest industrial profits, will all be closely monitored amidst fears that the global economy risks entering a period of stagflation (higher consumer prices amid sluggish economic growth). If the US, Europe, and China combined can show that these major economies have enough growth momentum, despite concerns over the Delta variant and supply chain bottlenecks during the third quarter, that could be conducive for risk appetite.
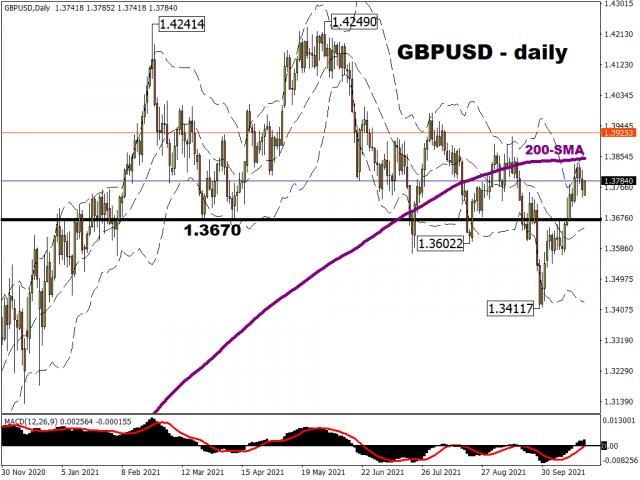
The UK government’s autumn budget release is also set to be a key event for the Pound. If markets take positively to a budget that solidifies the UK’s post-pandemic recovery, that might cheer Sterling bulls into helping cable launch another attempt to breach its 200-day simple moving average.
Disclaimer: The content in this article comprises personal opinions and should not be construed as containing personal and/or other investment advice and/or an offer of and/or solicitation for any transactions in financial instruments and/or a guarantee and/or prediction of future performance. ForexTime (FXTM), its affiliates, agents, directors, officers or employees do not guarantee the accuracy, validity, timeliness or completeness, of any information or data made available and assume no liability as to any loss arising from any investment based on the same.
– Watching Zillow (ZG) move from over $200 per share to recent levels below $90, reflecting a more than 55% collapse in price, while the housing market continues to rally may be an indication that traders/investors have already discounted the future peak in the US capital markets and Real Estate assets related to the current market environment. Zillow is not the only symbol experiencing this broad price decline. Redfin (RDFN) has also declined more than 54% over the past 7+ months.
Is The Peak In Real Estate Flippers Prices Sending A Strong Warning For Traders/Investors?
The peak in these stocks happened near February 16~22, 2021. This date, interestingly enough, aligns with a peak in global capital markets using my proprietary Smart Cash Index and a very clear peak in the Chinese Hang Seng Index.
Recent news that Zillow halted the purchases of homes using its “Zestimate” and Ibuyer programs, which act as a purchase, renovate, flip-type of market service allowing home sellers to get an almost instant purchase offer from Zillow has raised questions in my mind related to the potential risks involved in owning large quantities of real estate assets in a shifting market (source: https://finance.yahoo.com/news/why-zillow-had-stop-buying-170414137.html).
This news article suggests Zillow has over 2800 US homes available for sale. We are not aware of how many homes have been purchased and are waiting for completed repairs/inspections before they go on the market.
This article also suggests other flipping companies are still actively engaging in this risky activity. Opendoor peaked at share price near the same February dates this year but has continued to acquire and flip more homes than Zillow over the past 5+ years. Redfin, yet another flipper company, also continues to engage in buying, renovating, and flipping real estate in hot US markets.
My thinking is the rally in Real Estate prices, in some cases, more than 35%, which started near the end of 2020 and carried into the first two quarters of 2021 may have prompted a very risky race to acquire and flip hot market real estate at a time when labor shortages and commodity price rallies pushed the costs of “flipping” even higher may have put extended pressures on these firms to “flip for profits”.
Then add into this mix the Chinese/Asian Real Estate market concerns and the potential that Chinese/foreign market buyers may have moved away from the super-heated US Real Estate market recently while US consumers are starting waiting for the US Fed to potentially raise interest rates and we have a very interesting storm on the horizon.
These Flipper firms are holding large quantities of Real Estate assets where their purchase price likely reflects the dramatic increases in selling prices over the past 15+ months and is further complicated by supply-side costs for raw materials, labor, and equipment to complete the refurnished property while consumers may be starting to shift away from the “buy it at any cost” type of mentality.
Could the collapse in Zillow, Redfin, and OpenDoor reflect the underlying risks of an overly aggressive buying/flipping algorithm event?
Zillow Daily Chart Clearly Reflects Investor Sentiment Compared To US Major Indexes
This Daily Zillow Group chart clearly shows the extended price decline that has taken place over the past 7+ months. What is interesting is that the US major indexes continue to push higher and Real Estate prices continue to push higher while traders/investors are obviously not sharing the same bullish enthusiasm in Zillow, Redfin, and Opendoor.
A price collapse of over 50% is a big downside price trend for these types of companies. Consider the fact that they are buying thousands of homes across the US, which likely suggests they are taking on close to a $500m to $1b+ in assets/risk while attempting to quickly flip these properties for moderate profits. In a hot Real Estate market with strong buyer activity, one would think owning these hot assets would push traders/investors to believe “future profits are almost certain”. Yet that is clearly not the case on this chart.
Could it be that traders/investors are more keenly aware of the extended risks related to a potential US/global housing market bubble and the underlying liabilities related to a more extended downturn in this sector? Obviously, traders/investors have not been super excited about future potential profits for these firms recently. Maybe something will change in the near future? If not, this downward price trend suggests traders believe the risks outweigh the potential gains.
This Weekly Zillow chart shows how quickly the price trend reversed direction in February 2021. Remember, this date also aligned with a peak in the Chinese Hang Seng Index and likely represented a broad shift in investor sentiment as dynamics suddenly changed in the global Real Estate sector.
Still, the price of Zillow Group shares is trading near $90 – more than 400% higher than the COVID low price levels and more than 200% more than the pre-COVID average price level.
Are these price declines a warning that the Real Estate market/sector has shifted away from the active “flipper” mode and transitioned into more conservative expectations?
In Part II of this article, I’ll explore more detailed market analysis and trends related to the Real Estate market and price dynamics.
After these extended downtrends in price levels for these Real Estate/Flipper firms, it seems likely that some type of base/bottom will likely set up, which may prompt a new rally phase or a breakdown below this base/bottom level. I believe these trends reflect broad market concerns related to the super-heated Real Estate market over the past 15+ months. In short, I believe this extended price decline highlights inherent risks related to the type of investments and potential returns on those investments. Traders should cautiously watch how this trend plays out over the next few months.
Over the next 12 to 24+ months, I expect very large price swings in the US stock market and other asset classes across the globe. I believe the markets are starting to transition away from the continued central bank support rally phase and may start a revaluation phase as global traders attempt to identify the next big trends. Precious Metals will likely start to act as a proper hedge as caution and concern start to drive traders/investors into Metals.
Please take a minute to visit www.TheTechnicalTraders.com to learn about our Total ETF Portfolio (TEP) technology and it can help you identify and trade better sector setups. We’ve built this technology to help us identify the strongest and best trade setups in any market sector. Every day, we deliver these setups to our subscribers along with the TEP system trades. You owe it to yourself to see how simple it is to trade 30% to 40% of the time to generate incredible results.
Early in the new week of October, EUR/USD is looking good and trading at 1.1660. the factor that supports the European currency is the global risk attitude.
So far, the US Fed hasn’t given any signals of the QE programme reduction in November. This fact upsets the “greenback” enthusiasts, who obviously decided to take a break and wait for any relevant news.
This week, the European Central Bank is scheduled to have a meeting, where it is expected to keep its monetary policy aspects intact. It will be very interesting to hear the regulator’s comments about the stimulus, which is currently not expected to change.
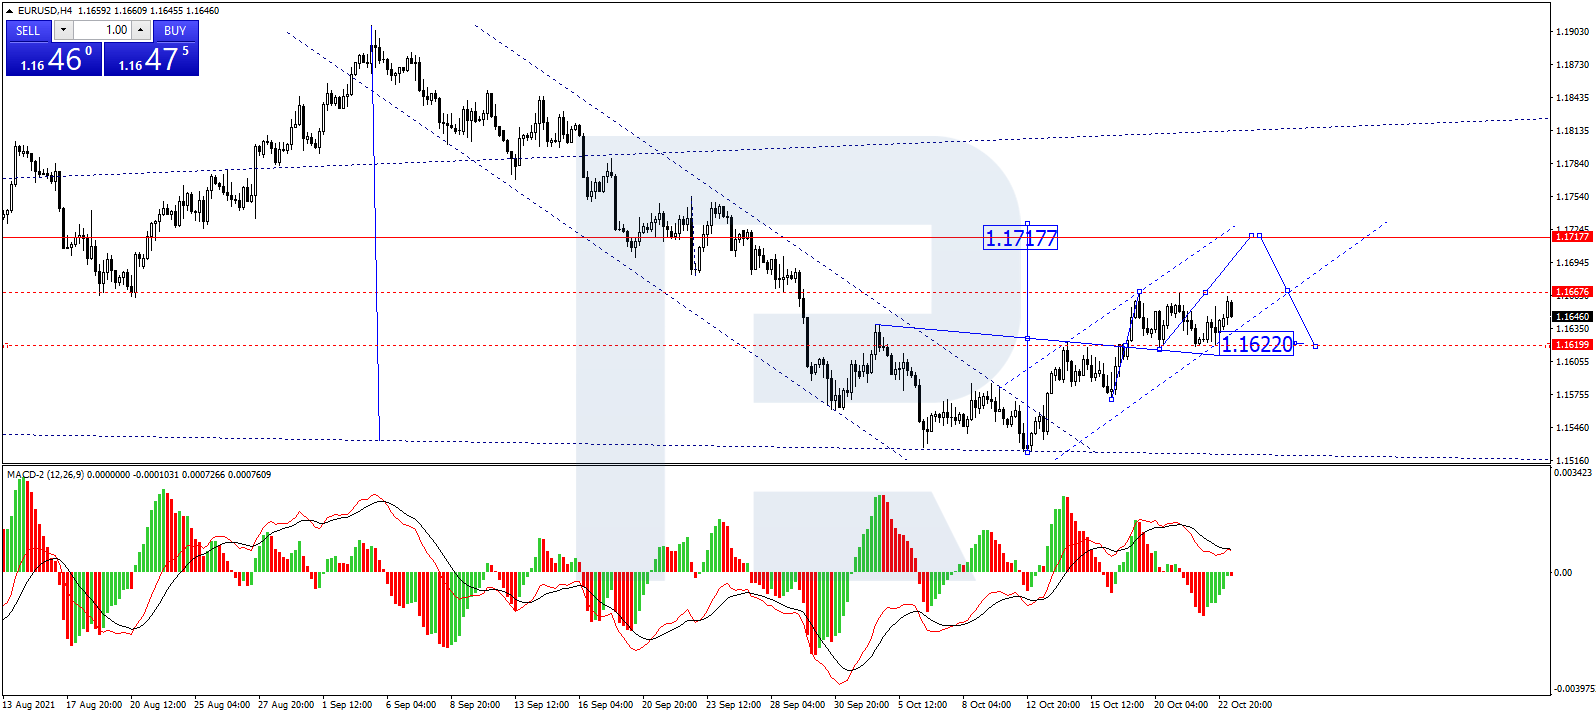
In the H4 chart, EUR/USD has formed a consolidation range around 1.1642 in the form of a Triangle pattern. Possibly, the pair may break the range and grow to reach the pattern’s upside border at 1.1685. If later the price breaks this level to the upside, the market may continue trading upwards with the target at 1.1710 (at least). From the technical point of view, this scenario is confirmed by MACD Oscillator: its signal line is moving above 0, while histograms are showing a steady wave to the upside.
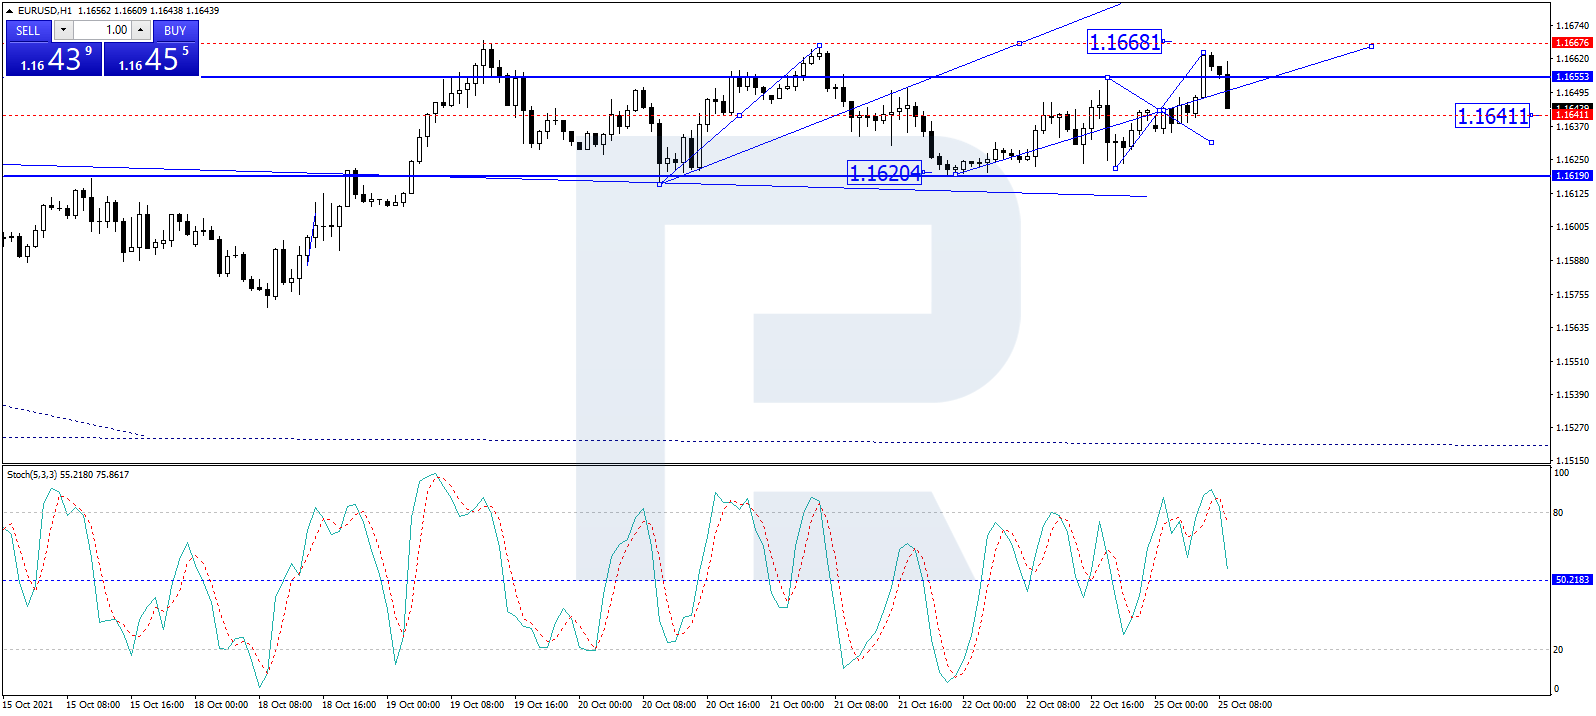
As we can see in the H1 chart, after rebounding from 1.1664 to the downside, EUR/USD is falling towards 1.1642. Possibly, the pair may rebound from the latter level and resume growing to reach 1.1688. After that, the instrument may break this level as well and continue trading upwards with the target at 1.1710. From the technical point of view, this scenario is confirmed by the Stochastic Oscillator: its signal line is moving below 80. Later, the line is expected to fall towards 50, a rebound from which may lead to another growth to reach 80.
Disclaimer
Any forecasts contained herein are based on the author’s particular opinion. This analysis may not be treated as trading advice. RoboForex bears no responsibility for trading results based on trading recommendations and reviews contained herein.
The sterling hit the brakes after the UK’s retail sales fell for the fifth month in a row in September.
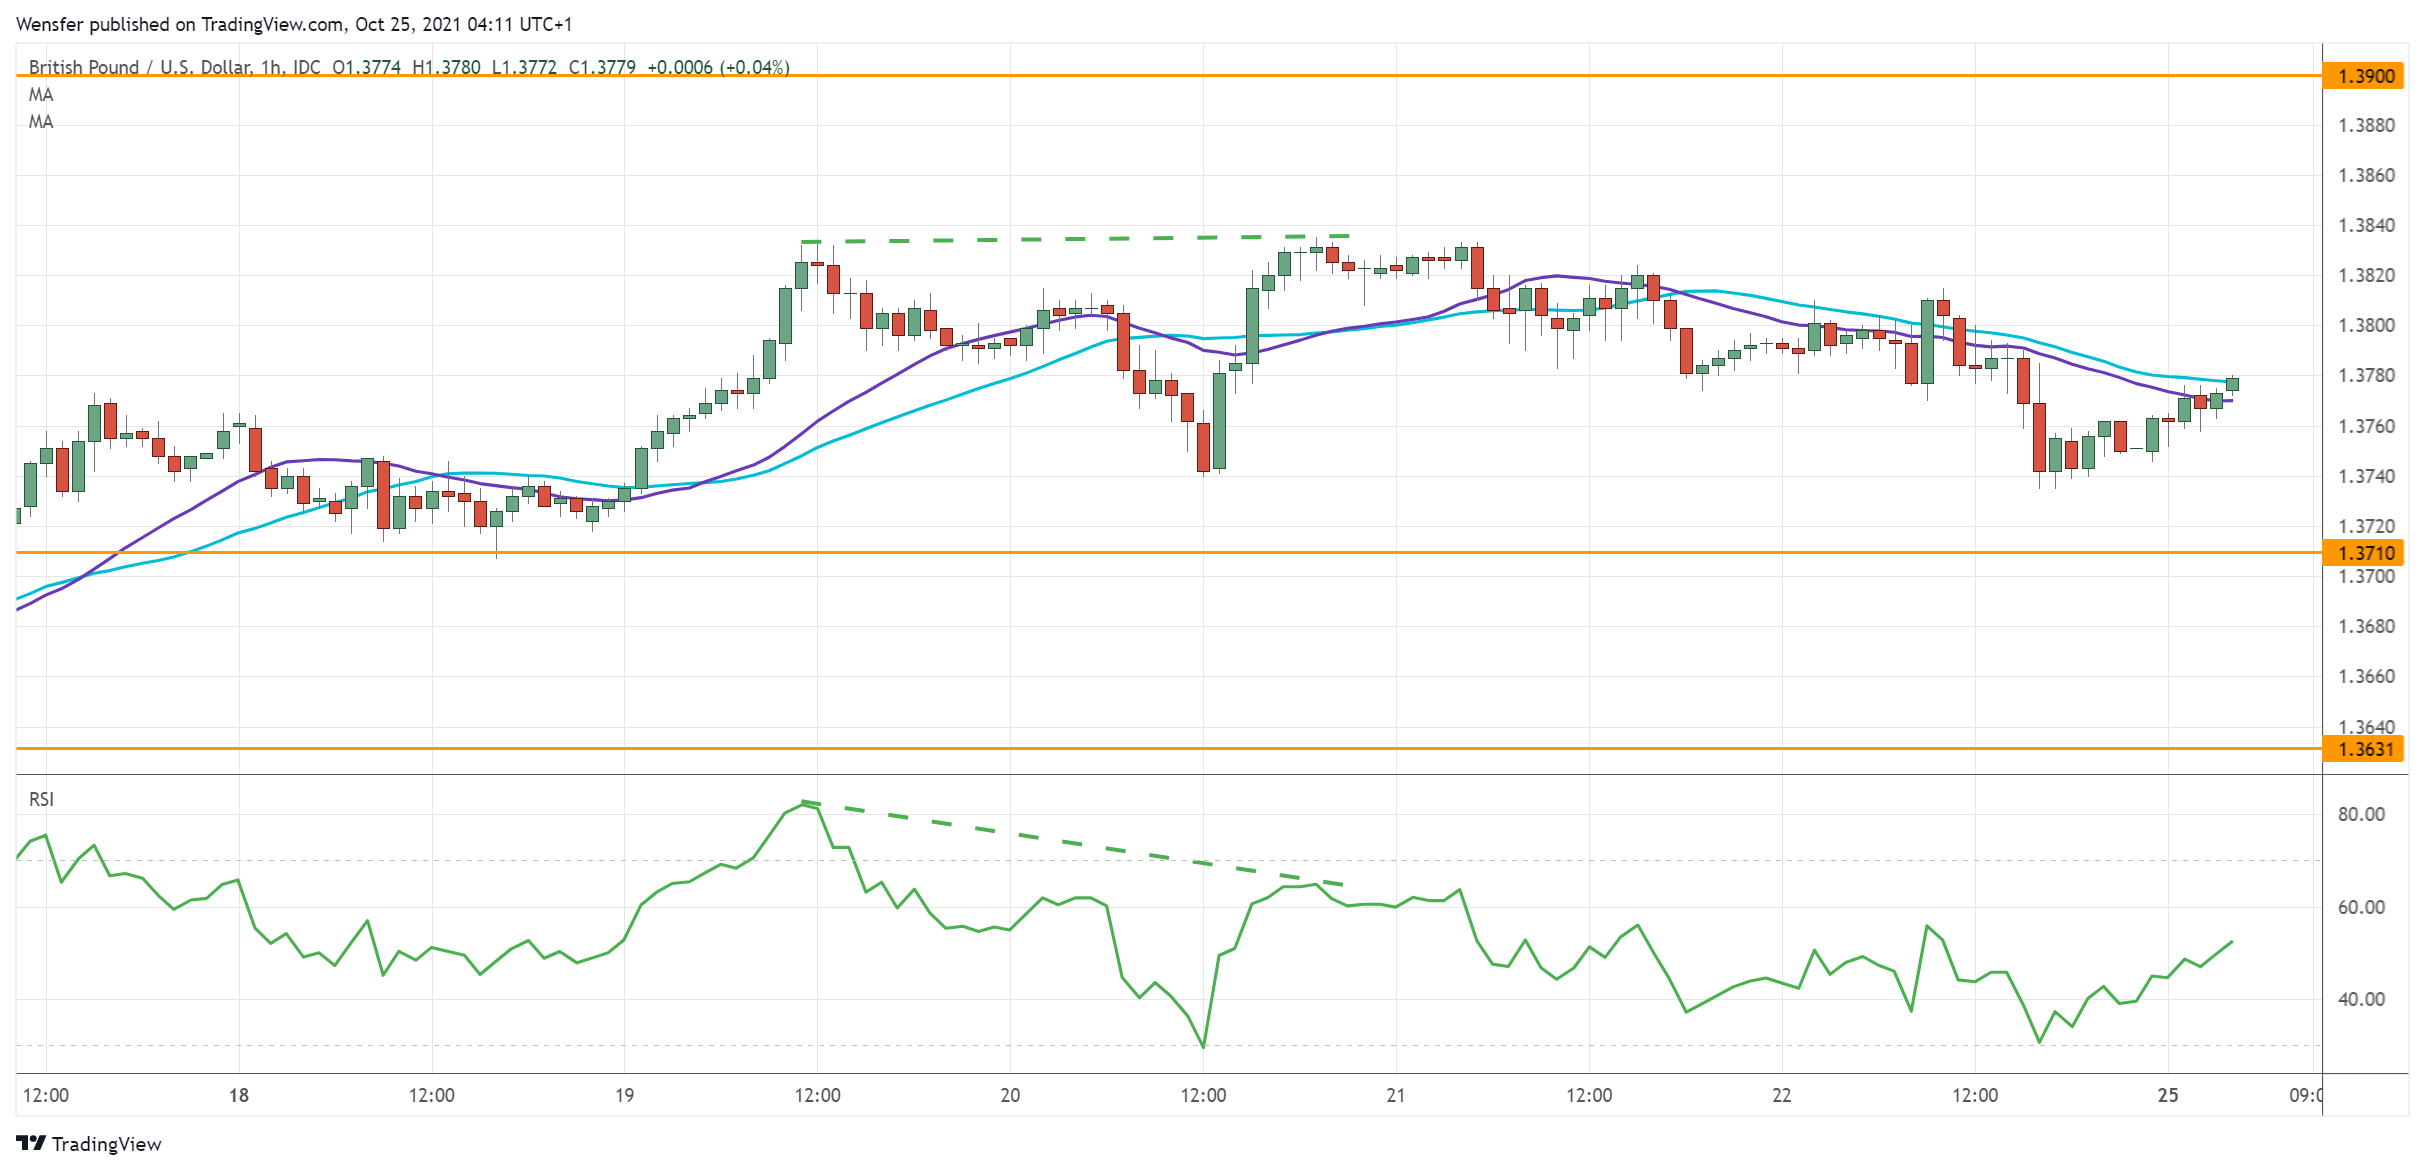
The pair has been inching up towards the hurdle on the daily chart (1.3900). The RSI’s bearish divergence, however, shows less enthusiasm from buyers as the price approaches the major resistance.
Sentiment remains bullish but we can expect profit-taking. 1.3710 would be the first support to monitor in case of retracement. On the upside, a bullish breakout may trigger an extended rally to 1.4000 and signal a potential reversal.
CADJPY hits 6-year high
The Canadian dollar slipped despite solid retail sales numbers in August. The pair has come under pressure at a six-year high (93.00).
A bearish RSI divergence indicates a loss of momentum as the bulls proceed with caution in this key supply zone. A repeatedly overbought situation has been calling for a consolidation and might limit their risk appetite.
A break below 91.80 would prompt more buyers to bail out. The psychological level of 91.00 from last June’s peak would turn into the second line of defense.
GER 40 tests daily resistance
The DAX 40 found support after Germany’s manufacturing PMI beat the consensus.
The latest rally above the 30-day moving average is a strong bullish signal. And after a brief horizontal consolidation, the index is climbing towards the key hurdle at 15700. A bullish close above this daily resistance would throw the bears off balance.
A combination of short-covering and momentum buying may heighten volatility. This is a prerequisite before the uptrend could resume. On the downside, 15400 is the immediate support in case of a pullback.
Orbex is a fully licensed broker that was established in 2011. Founded with a mission to serve its traders responsibly and provides traders with access to the world’s largest and most liquid financial markets. www.orbex.com
This week, traders will be focused on a wide range of important central bank statements and press conferences as well as corporate earnings from some major companies.
The Bank of Canada, Bank of Japan and European Central Bank are all on the calendar this week. The Canadian dollar has been the strongest currency over the past four weeks and is likely to react strongly to the latest from the Bank of Canada.
While the euro has been mostly lower in the past few weeks, it is likely the European Central Bank will inject some volatility into European stock market indices which have been stagnant. However, all eyes will start to turn to European corporate earnings starting next week as US earnings wind down this week.
You can learn more about some of the global themes affecting the markets in this selection of new education articles.
Source: Forex Calendar from the MetaTrader 5 trading platform provided by Admirals.
Did you know that three times a week, three professional traders talk through the markets live and show you how to identify potential trading opportunities? Reserve your complimentary spot in the live trading webinar now by clicking the banner below!
Trader’s Radar – ECB Press Conference
On Thursday 28 October, the European Central Bank releases its latest monetary policy statement which will be accompanied by a press conference at 1.30 pm BST. The European economy is not in a good place right now.
Disruptions to supply, rocketing energy prices, a rising number of coronavirus cases in Eastern Europe, a slowdown in China are all causes for concern for the bank – especially as China is Europe’s biggest trading partner.
With this in mind, it’s likely ECB president Christine Lagarde will strike a gloomier tone which could cause some further weakness in the euro and a possible boost for European stock indices.
Source: Admirals MetaTrader 5, EURUSD, Monthly – Data range: from 1 Jul 2013 to 24 Oct 2021, performed on 24 Oct 2021 at 7:00 pm GMT. Please note: Past performance is not a reliable indicator of future results.
The price of EURUSD is currently sitting at a very interesting level of horizontal support around 1.1515. There have been significant turning points around this price level in 2015, 2016, 2017, 2018 and 2020.
A move below this price level could see EURUSD go on to test the lows of the pandemic period. Much will depend on the tone the central bank strikes this week but it’s a key level to watch.
If you’re feeling inspired and ready to trade live in the market, you can open a live trading account by clicking on the banner below and accessing an impressive range of trading features to support you in your journey.
Corporate Trading Updates and Stock Indices
Global stock market indices made small gains last week with the S&P 500 and Dow Jones 30 index recording new all-time highs. However, the Nasdaq 100 and European indices are still trading below record highs. Investors will be looking for them to catch up.
Keep an eye on the following companies reporting this week:
Tuesday – Pfizer, AMD, McDonald’s, Microsoft
Wednesday – Boeing, Ford, PayPal, Alphabet
Thursday – Lloyds Banking, Volkswagen, Coca-Cola
Source: Admirals MetaTrader 5, SP500, Daily – Data range: from 22 Jan 2021 to 24 Oct 2021, performed on 24 Oct 2021 at 6:30 pm GMT. Please note: Past performance is not a reliable indicator of future results.
Past five-year performance of the S&P 500: 2020 = +16.17%, 2019 = +29.09%, 2018 = -5.96%, 2017 = +19.08%, 2016 = +8.80
The daily price chart of the S&P 500 stock market index shown above still highlights a clear uptrend. While the price decline during the typically weak summer months, the price has come roaring back higher to record a new all-time high last week.
However, the price has broken away from the previous record strongly. There is a chance that price could struggle here as earnings season winds down next week. If the Nasdaq can continue its run to its record high then there could be some momentum left in the S&P 500 index as well.
It’s definitely one to watch!
Did you know that you can use the Trading Central Technical Ideas Lookup indicator to find actionable trading ideas on this index and thousands of other instruments across Forex, stocks, indices, commodities and more?
You can get this indicator completely FREE in the Premium Analytics section once you open an account…
INFORMATION ABOUT ANALYTICAL MATERIALS:
The given data provides additional information regarding all analysis, estimates, prognosis, forecasts, market reviews, weekly outlooks or other similar assessments or information (hereinafter “Analysis”) published on the websites of Admirals investment firms operating under the Admirals trademark (hereinafter “Admirals”) Before making any investment decisions please pay close attention to the following:
This is a marketing communication. The content is published for informative purposes only and is in no way to be construed as investment advice or recommendation. It has not been prepared in accordance with legal requirements designed to promote the independence of investment research, and that it is not subject to any prohibition on dealing ahead of the dissemination of investment research.
Any investment decision is made by each client alone whereas Admirals shall not be responsible for any loss or damage arising from any such decision, whether or not based on the content.
With a view to protecting the interests of our clients and the objectivity of the Analysis, Admirals has established relevant internal procedures for the prevention and management of conflicts of interest.
The Analysis is prepared by an independent analyst, Jitan Solanki (analyst), (hereinafter “Author”) based on their personal estimations.
Whilst every reasonable effort is taken to ensure that all sources of the content are reliable and that all information is presented, as much as possible, in an understandable, timely, precise and complete manner, Admirals does not guarantee the accuracy or completeness of any information contained within the Analysis.
Any kind of past or modelled performance of financial instruments indicated within the content should not be construed as an express or implied promise, guarantee or implication by Admirals for any future performance. The value of the financial instrument may both increase and decrease and the preservation of the asset value is not guaranteed.
Leveraged products (including contracts for difference) are speculative in nature and may result in losses or profit. Before you start trading, please ensure that you fully understand the risks involved.
Jitanchandra Solanki Financial Markets Author, Admirals LondonJitanchandra is a financial markets author with more than 15 years experience trading currencies, indices and US equities. He is an accredited Market Technician with a BA Hons degree.
Chris joins Elijah K Johnson from Liberty and Finance to discuss Silver’s latest price actions and Precious Metals in general. We’ve seen a pretty big move from Silver in the last two trading sessions and Silver miners are starting to come back to life.
When silver moves, it can move fast. By the end of the year, we expect a signal showing that gold and silver are ready for the next leg up.
CLICK ON THE IMAGE BELOW TO LISTEN TO THE INTERVIEW
GET YOUR DAILY DOSE OF CHRIS’ PRECIOUS METALS ANALYSIS ALONG WITH THE HOTTEST ETFS TO TRADE WITH BAN TRADER PRO NOW PART OF THE TOTAL ETF PORTFOLIO!










 Article by