Murrey Math Lines 12.04.2022 (AUDUSD, NZDUSD)

Article By RoboForex.com

AUDUSD, “Australian Dollar vs US Dollar”

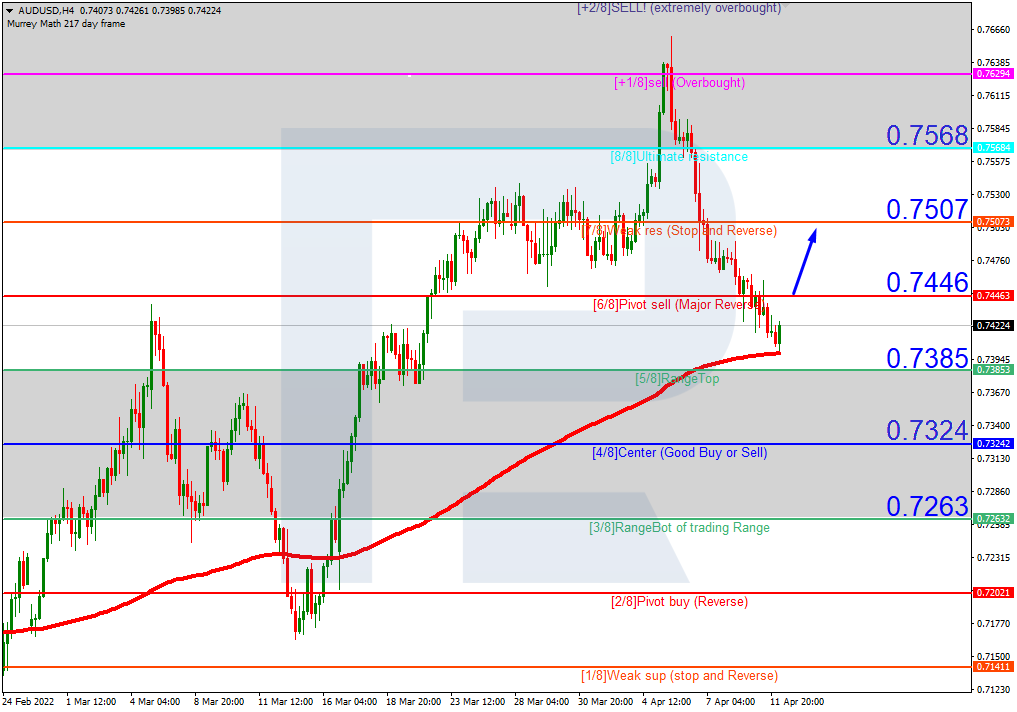
As we can see in the H4 chart, AUDUSD is trading above the 200-day Moving Average to indicate an ascending tendency. In this case, the price is expected to test 6/8, break it, and then continue growing to reach the resistance at 7/8. However, this scenario may no longer be valid if the price breaks the support at 5/8 to the downside. After that, the instrument may reverse and fall towards 4/8.

AUDUSDH4
Risk Warning: the result of previous trading operations do not guarantee the same results in the future

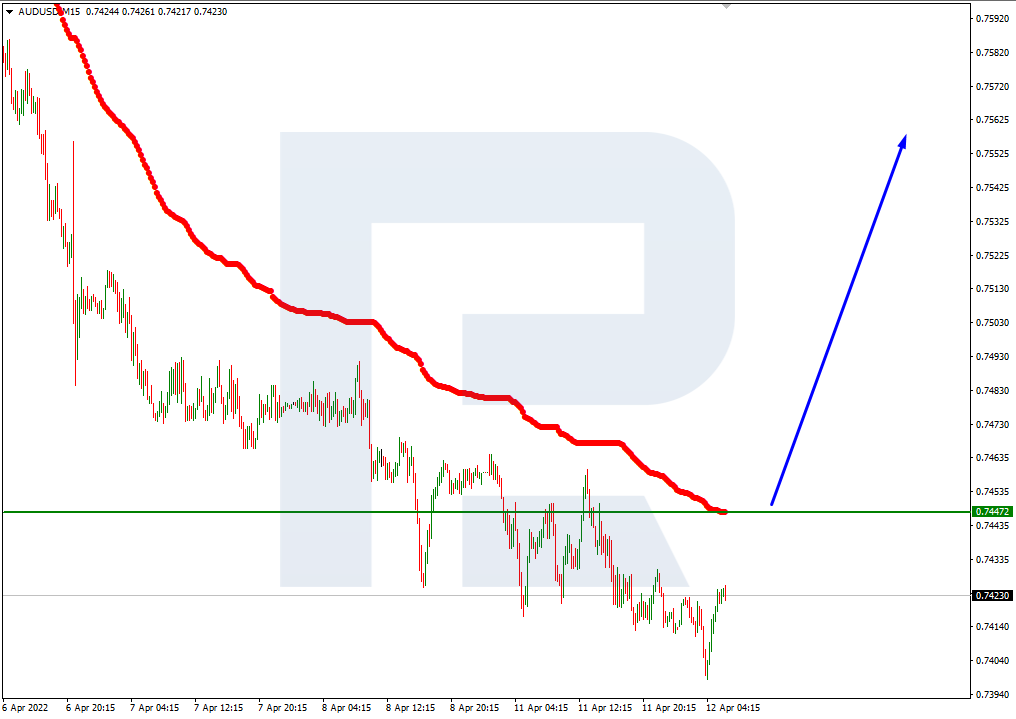
In the M15 chart, the pair may break the upside line of the VoltyChannel indicator and, as a result, continue trading upwards.

AUDUSD_M15
Risk Warning: the result of previous trading operations do not guarantee the same results in the future

NZDUSD, “New Zealand Dollar vs US Dollar”

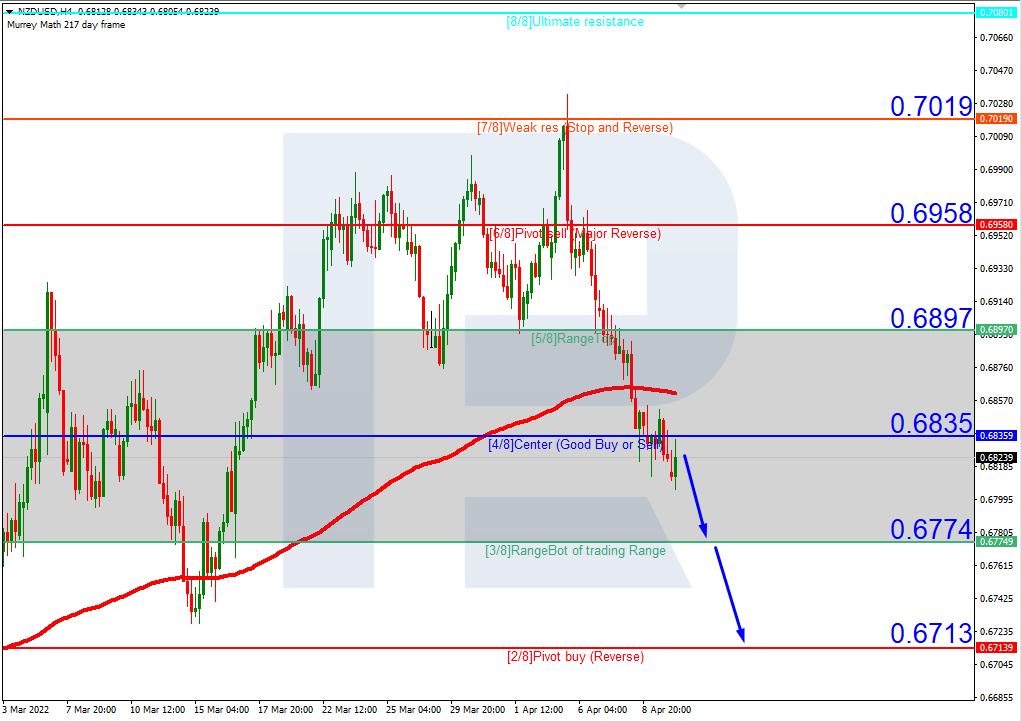
In the H4 chart, NZDUSD is trading below the 200-day Moving Average, thus indicating a possible descending tendency. In this case, the price is expected to rebound from 4/8 and then resume moving downwards to reach the support at 2/8. However, this scenario may no longer be valid if the price breaks the resistance at 4/8 to the upside. After that, the instrument may grow towards 5/8.

NZDUSD_H4
Risk Warning: the result of previous trading operations do not guarantee the same results in the future

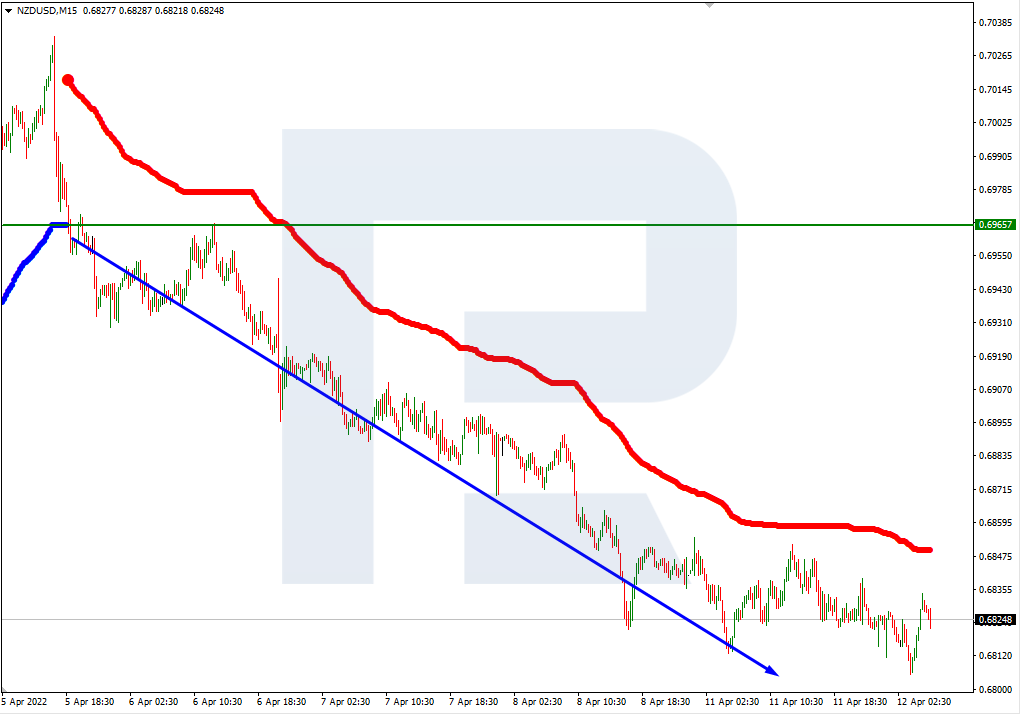
As we can see in the M15 chart, the pair has broken the downside line of the VoltyChannel indicator and, as a result, may continue its decline.

NZDUSD_M15

Article By RoboForex.com

Attention!
Forecasts presented in this section only reflect the author’s private opinion and should not be considered as guidance for trading. RoboForex LP bears no responsibility for trading results based on trading recommendations described in these analytical reviews.

The Analytical Overview of the Main Currency Pairs on 2022.04.12

by JustForex

The EUR/USD currency pair

Technical indicators of the currency pair:
  • Prev Open: 1.0920
  • Prev Close: 1.0883
  • % chg. over the last day: -0.33%

Inflation reports will be released today in the US and Germany. Analysts forecast another 1.2% increase in US inflation. Germany’s inflation rate in March 2022 was 7.3% year on year. Last month, the value was 5.1%. Thus, German inflation in March 2022 reached its highest level since the German reunification. ZEW institute forecasts are also important indicators of the European economy, and analysts expect a significant slowdown.

Trading recommendations
  • Support levels: 1.0857, 1.0823, 1.0633
  • Resistance levels: 1.0946, 1.0958, 1.1027, 1.1075, 1.1135, 1.1196, 1.1291

From the technical point of view, the trend on the EUR/USD currency pair in the hourly time frame is bearish. The price has adopted a more flat structure. The MACD indicator is inactive, but the first signs of buyers have appeared. Under such market conditions, it is possible to look for buy trades on intraday timeframes from the support level of 1.0857, but only with short targets and confirmation. Sell trades should be considered from the resistance level of 1.0946 or 1.0958, but only after the additional confirmation.

Alternative scenario: if the price breaks out through the 1.1075 resistance level and fixes above, the uptrend will likely resume.

EUR/USD
News feed for 2022.04.12:
  • – German Consumer Price Index (m/m) at 09:00 (GMT+3);
  • – German ZEW Economic Sentiment (m/m) at 12:00 (GMT+3);
  • – Eurozone ZEW Economic Sentiment (m/m) at 12:00 (GMT+3);
  • – US Consumer Price Index (m/m) at 15:30 (GMT+3);
  • – US FOMC Member Brainard Speaks at 19:10 (GMT+3).

The GBP/USD currency pair

Technical indicators of the currency pair:
  • Prev Open: 1.3029
  • Prev Close: 1.3023
  • % chg. over the last day: -0.04%

Rising inflation in the US will increase expectations of an aggressive tightening by the Federal Reserve. Against this background, the dollar index may continue to rise, which will harm the British pound due to declining UK economic indicators.

Trading recommendations
  • Support levels: 1.2976, 1.2863
  • Resistance levels: 1.3053, 1.3107, 1.3144, 1.3181, 1.3244, 1.3274

On the hourly time frame, the GBP/USD currency pair trend has changed to bearish. Buyers failed to hold the priority change level. The price has consolidated below the moving averages. The MACD indicator has become inactive. Under such market conditions, sell trades should be looked for from the resistance level of 1.3053, but with confirmation. For buy deals, traders may consider the level of 1.2976 if the price shows bullish initiative.

Alternative scenario: if the price breaks down through the 1.3181 resistance level and fixes above, the mid-term uptrend will likely be resumed.

GBP/USD
News feed for 2022.04.12:
  • – UK Claimant Count Change (m/m) at 09:00 (GMT+3);
  • – UK Unemployment Rate (m/m) at 09:00 (GMT+3).

The USD/JPY currency pair

Technical indicators of the currency pair:
  • Prev Open: 124.01
  • Prev Close: 125.38
  • % chg. over the last day: +1.10%

The fundamental picture for the Japanese yen remains unchanged. The Bank of Japan keeps government bond yields near zero, while US government bonds are rising. The monetary policy of the Bank of Japan is now “ultra-soft” and aims to decrease the national currency rate (USD/JPY growth). The US Fed will tighten monetary policy more aggressively. The dollar index rose to its highest level in almost two years. The medium-term forecast remains unchanged – analysts see a continuation of the uptrend, as the monetary policies of the central banks in the United States and Japan are now opposed.

Trading recommendations
  • Support levels: 124.66, 124.24, 122.97, 122.63, 121.81
  • Resistance levels: 125.28, 125.82

The medium-term trend on the USD/JPY currency pair is bullish. The MACD indicator is positive again. The buyers’ pressure is increasing. But the price has deviated very much from the moving averages. Under such market conditions, it is best to look for buy deals, expecting the continuation of the uptrend, but after the price makes a pullback to the average lines. First of all, it is worth considering the support level of 124.66 or 124.24, but with additional confirmation. A resistance level of 125.82 may be considered for sell deals, but only after the seller’s initiative and only with short targets.

Alternative scenario: If the price fixes below 121.81, the uptrend will likely be broken.

USD/JPY
News feed for 2022.04.12:
  • – Japan Producer Price Index (m/m) at 02:50 (GMT+3).

The USD/CAD currency pair

Technical indicators of the currency pair:
  • Prev Open: 1.2562
  • Prev Close: 1.2632
  • % chg. over the last day: +0.79%

The Canadian dollar is a commodity currency and is highly dependent on the movement of oil prices and the dollar index. OPEC has told the EU that it is impossible to compensate for the potential loss of Russian oil supplies. Current and future sanctions against Russia could cause serious shocks to oil supplies in history, and it will be impossible to compensate for these volumes. This situation will contribute to rising commodity prices. On the other hand, the Bank of Canada plans to tighten its monetary policy, so in the medium-term, the USD/CAD currency pair will show broad volatility without a single dynamic.

Trading recommendations
  • Support levels: 1.2590, 1.2476, 1.2430
  • Resistance levels: 1.2654, 1.2713, 1.2754, 1.2851

In terms of technical analysis, the USD/CAD currency pair has changed to bullish, as the price has consolidated above moving averages. The MACD indicator is in the positive zone, but there are the first signs of weakness of the buyers. Trade is worth it only with short targets because, fundamentally, there are no prerequisites for the medium-term trend on the USD/CAD currency pair. Under such market conditions, it is better to look for buy trades on the lower timeframes from the support level of 1.2590, but it is better with additional confirmation. For sell deals, it is better to consider the resistance level of 1.2654, but it is better with confirmation.

Alternative scenario: if the price breaks through and consolidates below 1.2430, the downtrend will likely be resumed.

USD/CAD
There is no news feed for today.

by JustForex


This article reflects a personal opinion and should not be interpreted as an investment advice, and/or offer, and/or a persistent request for carrying out financial transactions, and/or a guarantee, and/or a forecast of future events.

Inflation in Germany breaks the record. OPEC+ countries will not pump more oil

by JustForex

The US Treasury bond yields jumped to a three-year high ahead of US inflation data. The Fed’s plan to curb inflation is subjected to additional analysis today. Analysts forecast the US inflation rate to show an increase of 8.4% year on year. The 10-year bond yields increased yesterday from 2.40% to 2.74%. Rising government bond yields tend to affect major stock indices negatively. At the end of the day yesterday, the Dow Jones Index (US30) decreased by 1.19%, the S&P 500 (US500) lost 1.69%, and the NASDAQ Technology Index (US100) fell by 2.18%.

Investors are looking forward to the start of the US earnings season, which begins on Wednesday with the release of companies from the banking sector. “Even if the US earnings season shows good earnings growth, we doubt companies will start revising their own forecasts upward,” said Capital Economics economist Oliver Allen. “Because of this, we expect only a slight increase in the US stock market until the end of the year.”

Yesterday, European stock markets were mostly declining. German DAX (DE30) fell by 0.64%, French CAC 40 (FR40) added 0.12%, Spanish IBEX 35 (ES35) decreased by 0.25%, British FTSE 100 (UK100) lost 0.67%. Germany’s inflation rate in March 2022 was 7.3% year on year. Last month, the value was 5.1%. Thus, German inflation in March 2022 reached its highest level since the German reunification. The unemployment rate in the UK fell to 3.8%. This is a record since the last time the UK unemployment rate was below 3.8% in 1974. Vacancy rates hit a new record high for three months to March – 1.288 million, a reminder of the potential inflationary heat in the labor market that has the Bank of England on its guard as it raises interest rates. France’s incumbent president Emmanuel Macron defeated rival Marine Le Pen in the first round of the presidential election on April 10. But the gap was narrow. France is currently preparing for a second round, held on April 24.

Finnish telecommunications equipment manufacturer Nokia announced its exit from the Russian market.

OPEC has told the EU that it is impossible to compensate for the potential loss of Russian oil supplies. Current and future sanctions against Russia could cause serious shocks to oil supplies in history, and these volumes cannot be offset. At the same time, OPEC countries will not fill the deficit by increasing production. OPEC is resisting calls by the United States and the International Energy Agency to increase oil production. OPEC opposes calls by the United States and the International Energy Agency to increase oil production. At the same time, EU representatives also noted that OPEC is responsible for balancing oil markets. However, OPEC has said that the current high market volatility results from “non-fundamental factors” beyond OPEC’s control, so the group will not pump more. Currently, oil is not rising as quarantines imposed in China due to COVID-19 have briefly reduced demand prospects.

Stock indices of the Asia-Pacific region traded flat yesterday. Japan’s Nikkei 225 (JP225) yesterday decreased by 0.61%, Australia’s S&P/ASX 200 (AU200) gained 0.10%, while Hong Kong’s Hang Seng (HK50) lost 3.03%. On the other hand, Chinese indices have strengthened as there are signs that some of the strict restrictions in Shanghai will be lifted.

Main market quotes:

S&P 500 (F) (US500) 4,412.53 -75.75 (-1.69%)

Dow Jones (US30) 34,308.08 -413.04 (-1.19%)

DAX (DE40) 14,192.78 -90.89 (-0.64%)

FTSE 100 (UK100) 7,618.31 -51.25 (-0.67%)

USD Index 99.99 +0.20 (+0.20%)

Important events for today:
  • – Japan Producer Price Index (m/m) at 02:50 (GMT+3);
  • – UK Claimant Count Change (m/m) at 09:00 (GMT+3);
  • – UK Unemployment Rate (m/m) at 09:00 (GMT+3);
  • – German Consumer Price Index (m/m) at 09:00 (GMT+3);
  • – German ZEW Economic Sentiment (m/m) at 12:00 (GMT+3);
  • – Eurozone ZEW Economic Sentiment (m/m) at 12:00 (GMT+3);
  • – US Consumer Price Index (m/m) at 15:30 (GMT+3);
  • – US FOMC Member Brainard Speaks at 19:10 (GMT+3).

by JustForex


This article reflects a personal opinion and should not be interpreted as an investment advice, and/or offer, and/or a persistent request for carrying out financial transactions, and/or a guarantee, and/or a forecast of future events.

The era of low interest rates is no more

By The Market Research Team, ForexTime

Last week’s ECB and FOMC minutes made investors across the globe realise that the end of an unprecedented era is now definitely over. Much will no doubt be written about the past decade and longer, when interest rates were cut and remained at levels previously seen decades and even centuries ago.

But now, markets are looking warily at major central banks, and certainly the world’s most powerful one, which is set to front-load interest rate hikes in order to tame the inflation genie that has been let out of the bottle to try and get rates quickly back to neutral.

The widely watched US 10-year Treasury yield has hit new cycle highs above 2.83% this morning. Interestingly, the move was still more or less equally driven by higher real yields and inflation expectations. The latter suggests that the market still sees room for the Fed to further step up the pace of tightening.

Red hot US inflation incoming

Today’s March US CPI release takes centre stage.

The headline print is expected to accelerate to 1.2% m/m and 8.4% y/y. The core measure, which excludes the volatile food and energy sectors, is also set to rise to 0.5% m/m and 6.6% y/y. All these readings will be new multi-decade highs with the persistent high pace in the monthly price rises justifying the Fed’s red alert inflation mode.

This means a major correction in the current uptrend in yields is not expected any time soon. Even European bonds have cratered with yields breaking key levels recently ahead of the ECB meeting on Thursday. The major German government bond hit its highest yield since 2015 yesterday with the 10-year at 0.78%. This was still negative as of early March which shows the seismic recent moves in bond markets.

USD in pole position, stocks suffering

The sharp rise in rates, combined with ongoing geopolitical tensions and rising doubts on growth triggered more risk-off in equity markets.

The tech-heavy Nasdaq lost over 2% and futures are pointing to further losses today.

The US earnings season kicks off in earnest this week with several major US banks reporting. Analysts are forecasting overall revenues at the banks to fall around 10% with a 26% drop in investment banking fees.

Meanwhile, King Dollar is enjoying its safe haven status amid rising rates. The DXY has topped the 100 barrier earlier today, with the euro failing to maintain its gains after the first round of voting in the French presidential election.


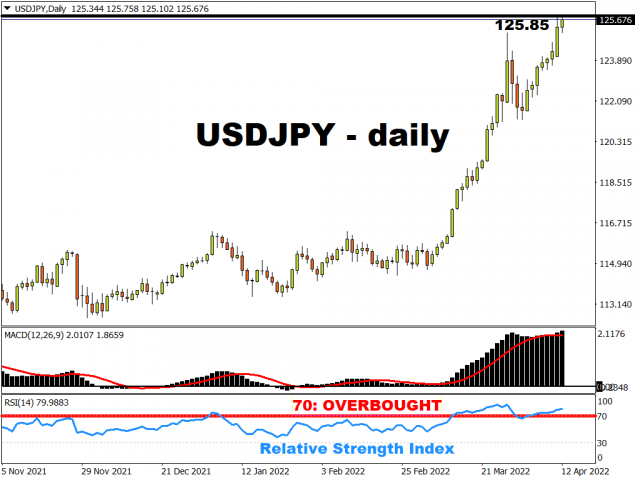
But the FX pair most affected by the long-end adjustment in bonds has been USD/JPY. Even rare jawboning from the Japanese authorities this morning has not stopped the enduring bids in this major.

Most seasoned traders don’t expect any proper intervention to start before 130, with the June 2015 peak at 125.85 the next resistance level to be toppled.


Disclaimer: The content in this article comprises personal opinions and should not be construed as containing personal and/or other investment advice and/or an offer of and/or solicitation for any transactions in financial instruments and/or a guarantee and/or prediction of future performance. ForexTime (FXTM), its affiliates, agents, directors, officers or employees do not guarantee the accuracy, validity, timeliness or completeness, of any information or data made available and assume no liability as to any loss arising from any investment based on the same.


Forex-Time-LogoArticle by ForexTime

ForexTime Ltd (FXTM) is an award winning international online forex broker regulated by CySEC 185/12 www.forextime.com

Trade Of The Week: Breakdown On The Horizon For EURUSD?

By Lukman Otunuga Senior Research Analyst, ForexTime

Watch this space as the EURUSD could turn volatile over the next few days!
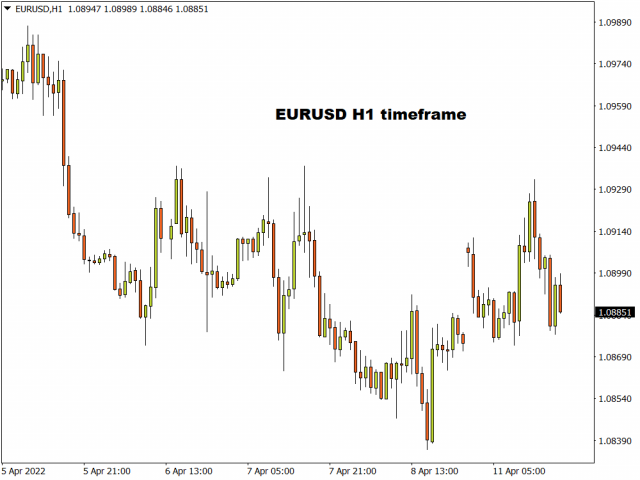
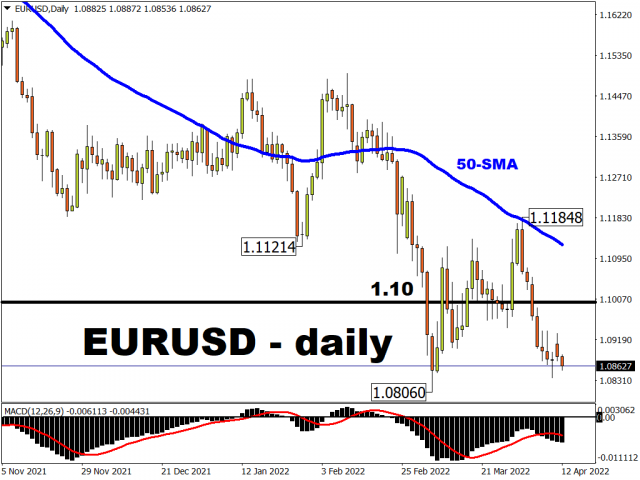
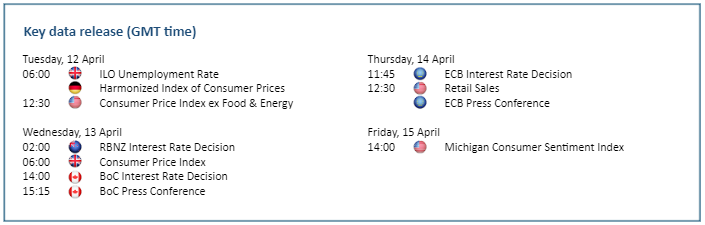
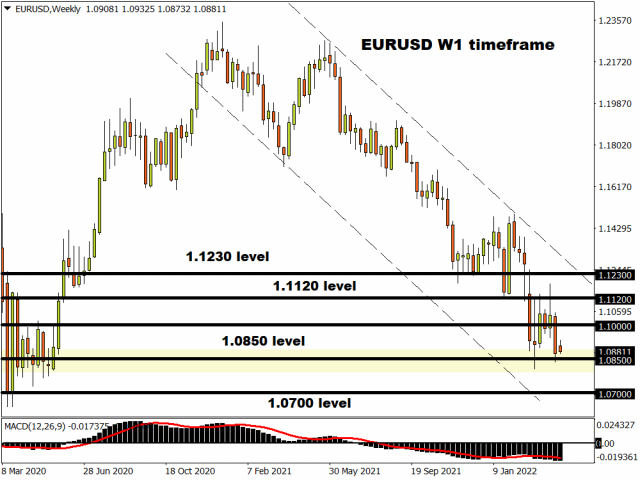
The currency pair seems to be gearing up for a major move with prices hovering above the key 1.0850 support level as of writing. While a solid breakdown below this level could signal further downside, such may require a strong fundamental catalyst. This may come in the form of the US inflation report on Tuesday or the European Central Bank (ECB) meeting on Thursday.

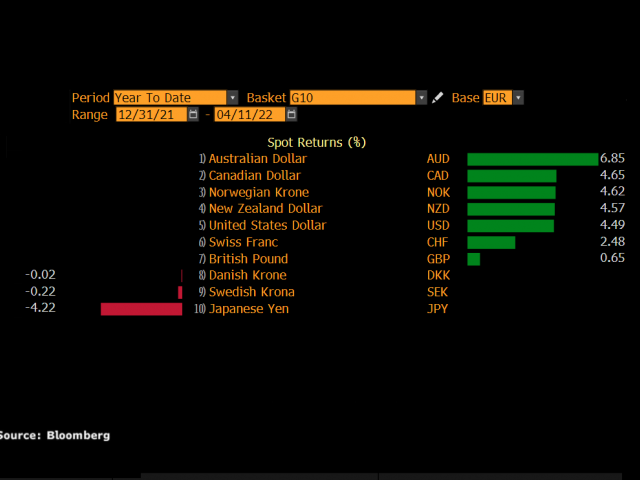
Before we take a deep dive into what to expect from the latest US CPI report and ECB, it is worth keeping in mind that the EURUSD has dropped over 4% year-to-date. The combination of geopolitical risks, surging energy prices and growth concerns continue to weigh on the Euro despite the ECB joining the hawkish bandwagon. Since the start of 2022, the euro has weakened against every single G10 currency excluding the Japanese Yen and Swedish Krona.
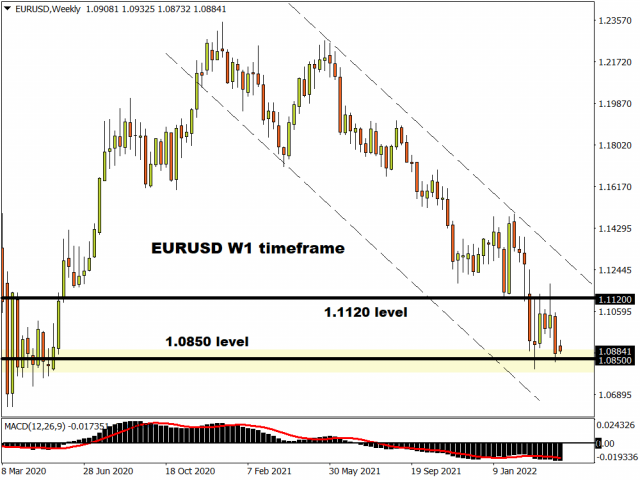
Taking a quick look at the technicals, things are looking noisy on the daily charts with resistance around 1.1120 and support at 1.0850. However, the trend remains firmly bearish on the weekly timeframe. Interestingly, the last time the currency pair secured a weekly close below 1.0850 was back in May 2020 – almost two years ago.
All eyes on the US CPI report…

US inflation is expected to have hit another 40-year high in March.

Consumer prices are forecast to have risen by 8.4% year-over-year, compared to the 7.9% in February. If expectations become reality, this will be the fastest pace since 1981! This could encourage Investors to pile bets on the Federal Reserve adopting a more aggressive pace of rate increases over the next few months – raising speculation around a 50-basis point hike in May (as opposed to the customary 25-basis point moves). Buying sentiment towards the dollar could also receive a boost, which may result in the EURUSD trading lower.

Speaking of the dollar, it has appreciated against most G10 currencies since the start of 2022.
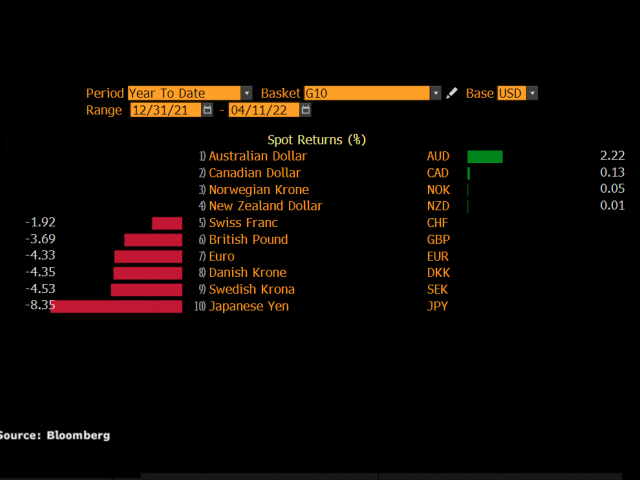
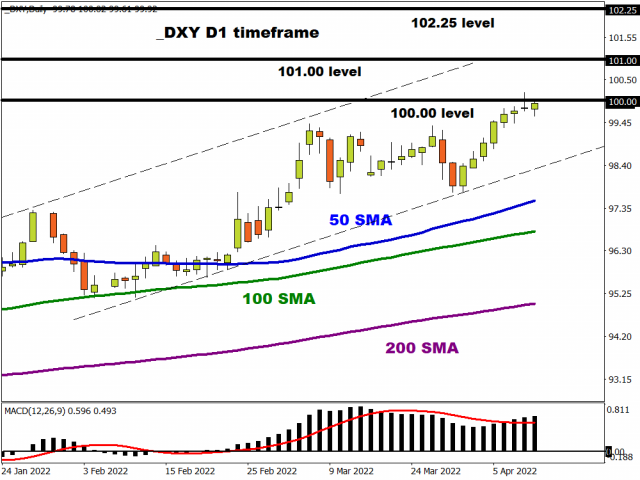
The benchmark dollar index (DXY) is up over 4.4% year-to-date with prices trading marginally below 100.00 as of writing. A solid daily close above 100.00 could open a path towards 101.00 and 102.25.
What to expect from the ECB?

The European Central Bank is widely expected to leave interest rates unchanged when it meets on Thursday. However, it may be unwise to label this as a non-event.

At its last meeting in March, the central bank stated it would accelerate the winding down of its bond-buying stimulus, with the possibility of the scheme ending in Q3 depending on economic data. Minutes from the March meeting were also hawkish, but members of the governing council had split opinions over how to tackle soaring inflation.

Euro area annual inflation surged to an all-time high of 7.5% in March, compared to the 5.9% in February. The recent surge in inflation was the product of geopolitical risks pushing fuel and natural gas prices to record high levels. With inflation now more than 3 times above the ECB target level of 2%, the central bank may be pressured to act. However, the fresh economic uncertainty caused by the war in Ukraine has placed the ECB in a tricky position.

Investors will be paying very close attention to ECB President Christine Lagarde’s speech which could offer fresh clues on the ending of the Asset Purchase Programme (APP) and rate hike timeline. If she strikes a hawkish tone, this could support Euro bulls. However, if the ECB disappoints hawks by adopting a cautious stance, expressing concerns over the economy, and offering nothing new on rate hike timelines, the Euro could weaken.

EURUSD poised to break below 1.0850?

Taking a look at the technical picture, the EURUSD remains in a wide range on the daily charts with support at 1.0850 and resistance around 1.1120. With prices trading well below the 200, 100, and 50-day Simple Moving Average, bears remain in a position of power.
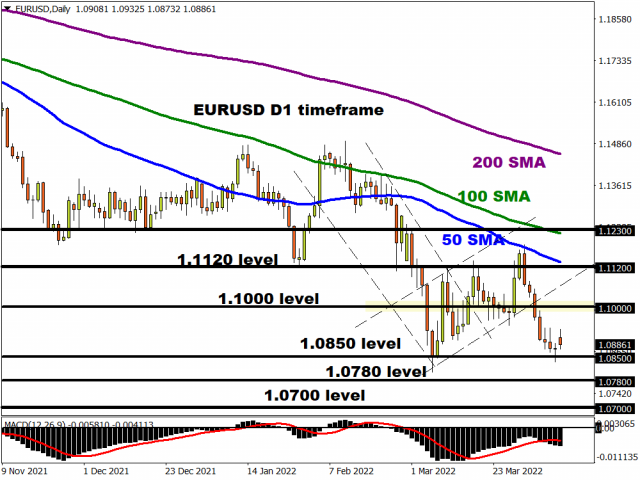
Should prices secure a weekly daily close below 1.0850, this could open the doors towards 1.0780 and 1.0700. Alternatively, a move back above 1.1000 could inspire an incline towards 1.1120. Beyond this point, bulls may challenge 1.1230.
Disclaimer: The content in this article comprises personal opinions and should not be construed as containing personal and/or other investment advice and/or an offer of and/or solicitation for any transactions in financial instruments and/or a guarantee and/or prediction of future performance. ForexTime (FXTM), its affiliates, agents, directors, officers or employees do not guarantee the accuracy, validity, timeliness or completeness, of any information or data made available and assume no liability as to any loss arising from any investment based on the same.


Forex-Time-LogoArticle by ForexTime

ForexTime Ltd (FXTM) is an award winning international online forex broker regulated by CySEC 185/12 www.forextime.com

Will Elon Musk Change Twitter’s Trajectory?

By Orbex

Over the weekend, it emerged that Tesla CEO Elon Musk would not be taking a seat on Twitter’s board of directors. And that is quite significant. Musk announced he had bought a 9.2% stake in the company, and became the largest shareholder.

In response, the company offered Musk a seat on the Board, but that would make it legally impossible for him to own more than 14.9% of the company. If Musk doesn’t take his seat on the board, then he could presumably keep increasing his stake.

We should remember that even after the price of the company spiked following Musk’s taking a stake, the market cap is $37B. Musk’s net worth is estimated at $274.3B. That means he has enough wealth to buy a controlling stake in Twitter 14 times over. And Musk has been quite interested in social media, lately.

So where does that leave the markets?

The problem with Twitter

Twitter’s stock price has been trending lower since it hit its peak back in early 2021. Even after Musk’s announcement, the share price started to slip lower after its initial rise.

Part of that can be due to Twitter posting two consecutive years of negative income. That is despite the increased demand for tech, as people were staying home due to covid. And the company’s revenue increased during the same period.

Since taking his stake in Twitter, Musk has been active on his own account. Furthermore, polls have been asking his followers about changes to the microblogging platform. But, most of those questions are mostly for aesthetic purposes (such as adding an edit button), or jokes (such as removing the “w” from the name). While those might get a lot of attention, they aren’t the sort of things that might change the direction that the platform has been moving in lately.

The financials are king

From a financial perspective, one of the main challenges that Twitter has is that its CPM (that is how much advertisers pay to put ads on the platform) is the lowest among major social media.

There are several reasons for this. One of the reasons is that only 0.2% of its users are exclusive to the platform. This means that advertisers can still reach the same demographic through other means.

Additionally, Twitter has mostly male users. Women drive 70-80% of consumer decisions, meaning that even though Twitter users typically tend to have more money, the largest consumer base isn’t as amply represented on the platform.

Moreover, a small percentage of the users generate most of the content. As Musk himself pointed out, the most followed users generate little content. And just a small subset of 10% of users generate 80% of the content on the platform.

The gap

In other words, there is a disconnect between what is on Twitter, and what people want to see on the platform.

Twitter’s “traffic acquisition costs” have increased by 32% in the last year, which includes advertising costs. This is aside from “marketing” costs, which have increased by 39% in the same period. Twitter spent an additional $176.6M last quarter trying to get more users. And that was more than the total operating income of the period.

Twitter appeals to a remarkably narrow set of users (affluent, politically left-leaning, highly educated males), who aren’t a major target of advertisers. And it appears to be struggling to break out of that mold.

Trading the news requires access to extensive market research – and that’s what we do best. Open your Orbex account now.


Orbex-LogoArticle by Orbex

Orbex is a fully licensed broker that was established in 2011. Founded with a mission to serve its traders responsibly and provides traders with access to the world’s largest and most liquid financial markets. www.orbex.com

GBPUSD Triple Zigzag Likely To End Primary Wave Ⓨ

By Orbex

GBPUSD

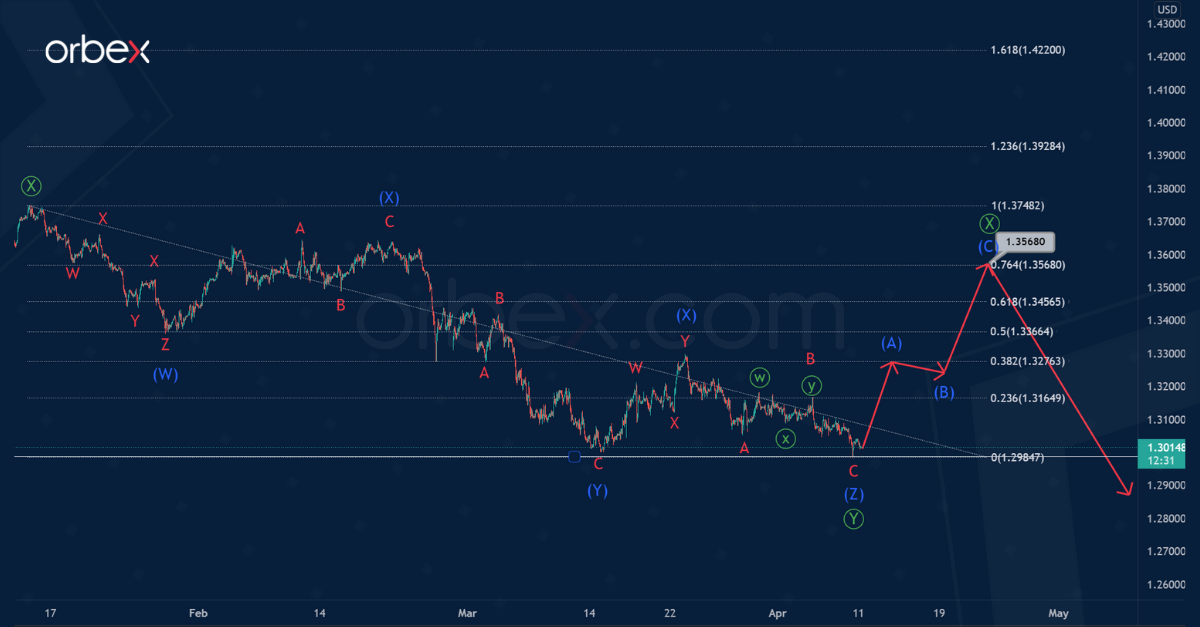
The current GBPUSD structure suggests a correction decline within the major trend. This takes the form of a primary triple zigzag Ⓦ-Ⓧ-Ⓨ-Ⓧ-Ⓩ. A bearish wave Ⓨ is currently developing.

Wave Ⓨ is a triple zigzag (W)-(X)-(Y)-(X)-(Z) of smaller degree. At the moment, the price is moving lower and a zigzag pattern A-B-C is forming. This can complete the intermediate wave (Z) at the level of 1.267.

At the specified price point, primary wave Ⓨ will be equal to wave Ⓦ. After reaching the level of 1.267, prices could move higher in the primary intervening wave Ⓧ.

GBPUSD

According to an alternative scenario, the formation of the primary wave Ⓨ has already come to an end.

Thus, in the next coming trading days, prices will increase in the bullish intervening wave Ⓧ.

Most likely, the wave Ⓧ will take the form of a simple zigzag (A)-(B)-(C) of the intermediate degree. It could end near 1.356. At that level, wave Ⓧ will be at 76.4% of wave Ⓨ.

The approximate internal structure of the intermediate zigzag (A)-(B)-(C) is shown by trend lines.

Time to put your research to the test! Open your Orbex account and start trading now!


Orbex-LogoArticle by Orbex

Orbex is a fully licensed broker that was established in 2011. Founded with a mission to serve its traders responsibly and provides traders with access to the world’s largest and most liquid financial markets. www.orbex.com

Intraday Market Analysis – USD Resumes Uptrend

By Orbex

USDJPY consolidates gains

USDJPY

The US dollar rallies as the 10-year Treasury yield hits a three-year high. Price action has been treading water after it bounced off 121.30.

The RSI shot back into the overbought area and could limit the upward momentum. Sentiment remains bullish but subdued volatility suggests a lack of volume. The recent peak at 125.00 is a major hurdle and its breach could resume the rally.

On the downside, a break below 122.70 could lead to an extended consolidation. 121.30 is a critical floor to keep the short-term rally intact.

EURCAD struggles to rebound

EURCAD

The Canadian dollar strengthened after a drop in the jobless rate in March. The RSI’s double-dip in the oversold area has attracted some buying interest.

A break above the demand-turned-supply zone around 1.3700 has improved the short-term mood. The origin of the previous sell-off at 1.3840 is a major resistance, as it sits on the 20-day moving average, making it a congestion area.

A bullish close could pave the way for a meaningful rebound. Failing that, a retreat back below 1.3600 may resume the downtrend.

GER 40 seeks support

DAX

The Dax 40 struggles on concerns about the economic costs of war in Ukraine. A bullish MA cross on the daily chart suggests steadied sentiment in the medium-term after a V-shaped rebound.

The bulls may see the pullback as an opportunity to accumulate. They will need to clear February’s sell-off point at 15500 before the uptrend could resume.

On the intraday level, a drop below 14200 prompted buyers to exit, making 14430 a fresh resistance. A break below 14050 may cause a deeper correction towards 13600.


Orbex-LogoArticle by Orbex

Orbex is a fully licensed broker that was established in 2011. Founded with a mission to serve its traders responsibly and provides traders with access to the world’s largest and most liquid financial markets. www.orbex.com

The Week Ahead – Fed’s Commitment Drives Dollar Assets

By Orbex

Fed

EURUSD falls over hesitant ECB

EURUSD

The euro softens over stark policy divergence from hawkish FOMC minutes. Soaring energy prices have pushed inflation in the eurozone to a record high of 7.5%, and the ECB is under intense pressure to make a move.

While the economy is still in a period of convalescence, tighter financial conditions could come at the expense of growth and employment. Despite the dilemma, the market is looking for hints of the first series of hikes in a decade that would bring the deposit rate back into positive territory.

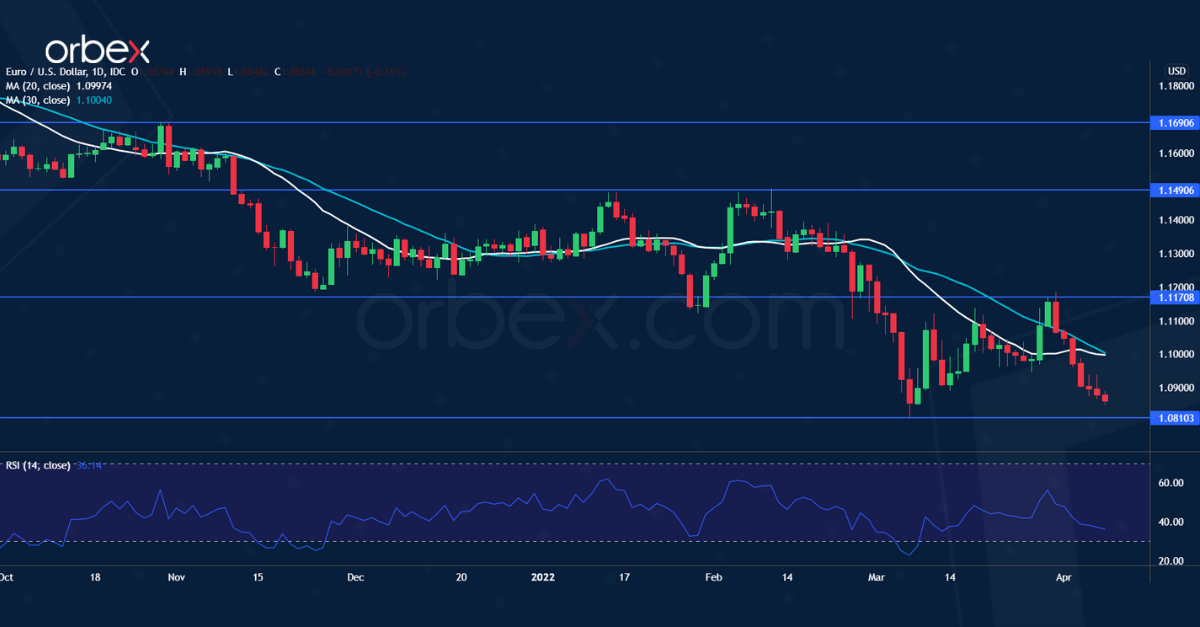
Upbeat comments from the ECB could raise the single currency above 1.1170. Otherwise, 1.0810 is the closest support.

USDCAD recovers ahead of BOC meeting

USDCAD

The Canadian dollar consolidates ahead of the BOC rate decision. As Canada’s economic activity picks up steam, the central bank could raise its overnight interest rate by 50bp this week.

The loonie so far has held well against a flamboyant US dollar thanks to an early hawkish shift from the BOC and higher commodity prices. However, a slowdown in the housing market might refrain policymakers from going all out in the current tightening cycle.

This difference in policy aggressiveness could benefit the greenback in the medium term. 1.2450 is the closest support and 1.2680 is a fresh resistance for the latest rebound.

NZDUSD finds support from RBNZ hike

NZDUSD

The New Zealand dollar recovered over rate hike expectations. With inflation expected to rise above 7% this year, the Reserve Bank of New Zealand may continue to press on tightening after three consecutive rate hikes.

New Zealand’s official cash rate is currently sitting at 1%. And traders are betting on a potential 50bp increase. The bigger picture could be a tripling of the OCR by the end of 2023.

Additionally, soaring commodity prices partially cushion the impact of supply disruptions and give the kiwi a strong tailwind. A break above 0.7050 may send the pair to last October’s high at 0.7210. 0.6740 is a fresh support.

SPX 500 recovers as Fed clarifies plans

SPX 500

The S&P 500 consolidates as investors embrace normalization. The market hates uncertainty, but the recent rally suggests that buyers prefer to see what is tangible and that is roaring inflation.

A peace deal in Ukraine seems remote, and lockdowns in China may have limited impact after the West chose to live with the virus. Monetary tightening has become the key driver once again after the Fed gave its roadmap.

Between the risk of weaker growth and the reality of high inflation, the S&P’s swift bounce is a nod to the central bank’s pledge to deal with the latter. The rebound is heading towards 4740 with 4380 as close support.


Orbex-LogoArticle by Orbex

Orbex is a fully licensed broker that was established in 2011. Founded with a mission to serve its traders responsibly and provides traders with access to the world’s largest and most liquid financial markets. www.orbex.com

EUR/USD Is Full of Risks

EURUSDH4

By RoboForex Analytical Department

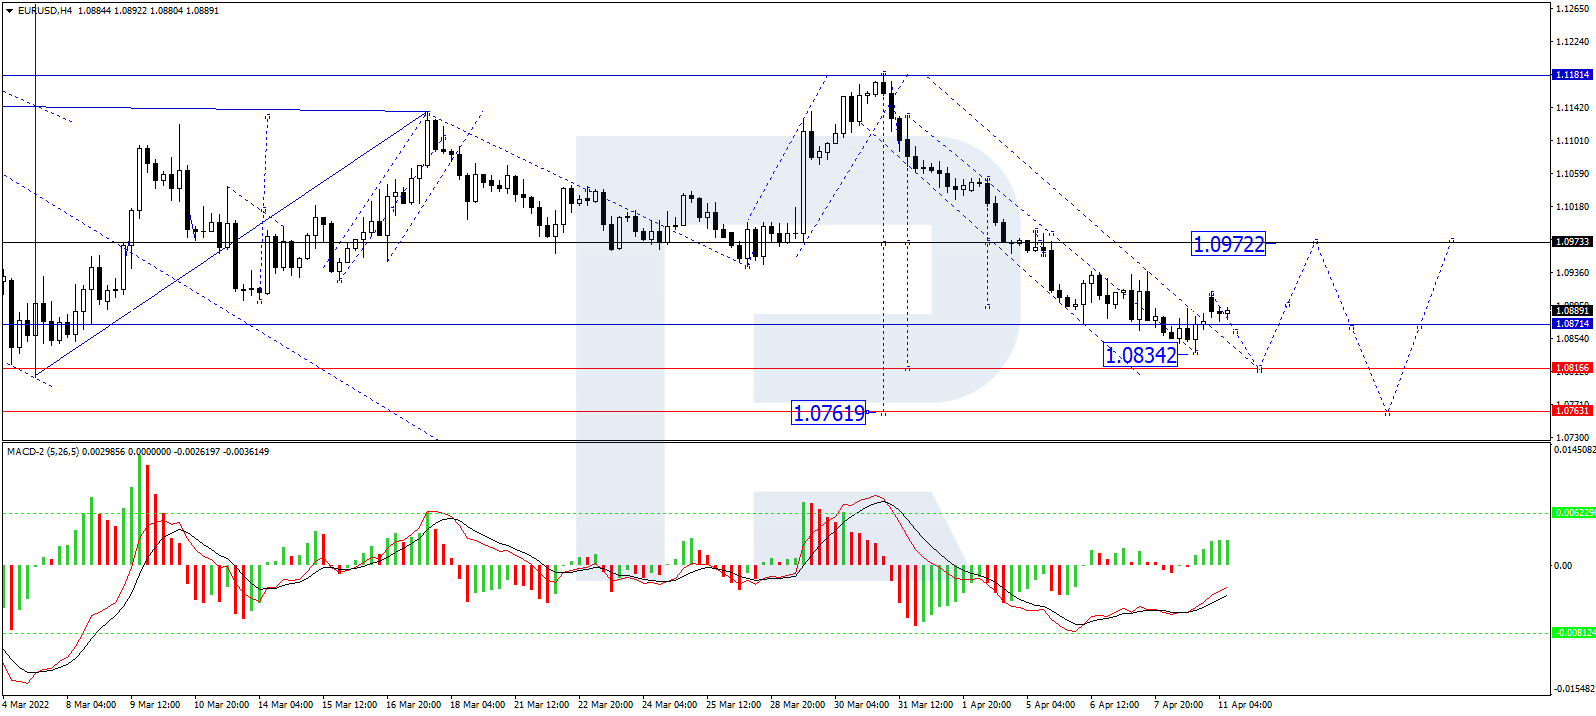
On Monday 11 April, EUR/USD remains weak; the asset is currently trading at 1.0892.

The Monetary Policy Meeting Accounts published by the European Central Bank last week said most policymakers believed that the regulator should take immediate measures aimed at helping the monetary policy reach stability. Such a stance is based on high inflation, which may preserve in the future. However, there is no consensus here, the monetary committee has the right to choose.

Still, this line is rather soft and couldn’t support the EUR, while the “greenback” got much stronger after the US Fed announced the rate hikes in the nearest future. American policymakers say that the rate might reach 3.5% by the end of the year to take control over inflation. By the end of 2022, the бmonetary policy should reach a neutral level.

Investors are also keeping a close eye on the presidential elections in France. The Euro is rather unlikely to be very sensitive to the voting results but some part of politics-related risks might be included in prices.

In the H4 chart, having rebounded from 1.0973, EUR/USD continues falling towards 1.0816. Later, the market may correct to test 1.0973 from below and then form one more descending wave with the target at 1.0763. From the technical point of view, this scenario is confirmed by MACD Oscillator: its signal line is growing to reach 0 and may soon rebound from this level to start a new decline and update the lows.

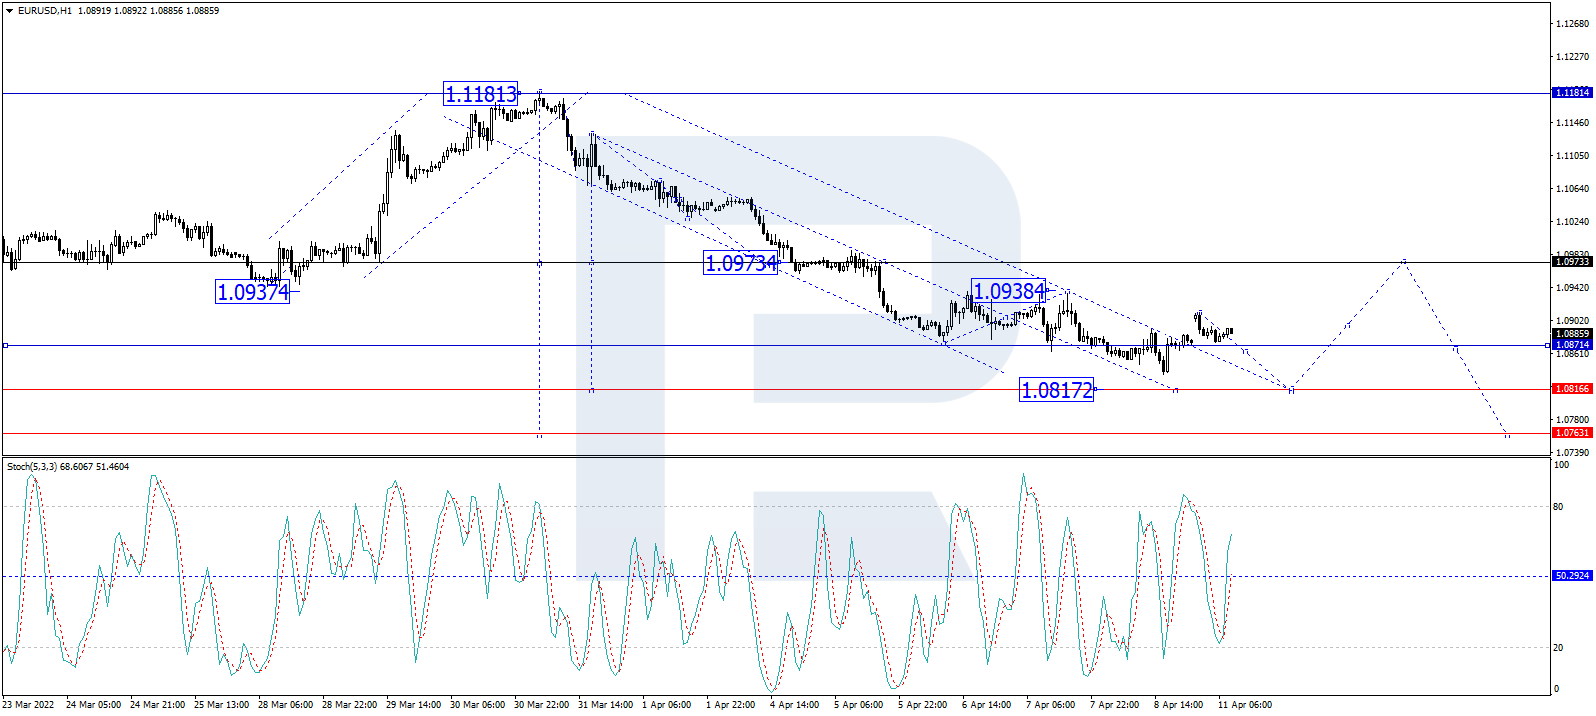
As we can see in the H1 chart, after completing the correction at 1.0910, EUR/USD is expected to resume falling towards 1.0816 and then start a new correction to reach 1.0973. After that, the instrument may resume trading downwards with the target at 1.0763. From the technical point of view, this idea is confirmed by the Stochastic Oscillator: after breaking 50 to the downside, its signal line may continue moving to reach 20. Later, the line may rebound from 20 and start a new growth towards 80.

EURUSDH1

Disclaimer

Any forecasts contained herein are based on the author’s particular opinion. This analysis may not be treated as trading advice. RoboForex bears no responsibility for trading results based on trading recommendations and reviews contained herein.