RoboMarkets is the Official Sponsor of the Cyprus Karate Federation and the Upcoming International Youth Championship

28.04.2022

Limassol, Cyprus

RoboMarkets, the company that provides investment services to European clients, has become the official sponsor of the Cyprus Karate Federation and will be supporting the upcoming International Youth Karate Championship in Limassol.

The International Youth League Karate Championship in Limassol is the second event organised by the Cyprus Karate Federation this season. The tournament, which will take place from 29 April to 1 May 2022, has become an essential part of the world’s sports schedule. Young athletes from all over the world are coming to Limassol to compete for the Karate championship title.

This is the third time that Limassol will be hosting a major Karate event – two previous championships were held in 2019 and 2021, while the 2020 tournament was cancelled due to the coronavirus pandemic. This year, 1,539 athletes from 51 countries have registered to participate.

Konstantin Rashap, CBO at RoboMarkets comments: “We’re always delighted to support sports organisations and events. RoboMarkets shares a common goal with the Cyprus Karate Federation – we help young athletes to make their appearance in the international field and compete for top places”.

About RoboMarkets

RoboMarkets is an investment company operating under CySEC license No. 191/13. RoboMarkets offers investment services in many European countries by providing traders who work in the financial market with access to its proprietary trading platforms. Find out more detailed information about the Company’s products and activities on www.robomarkets.com.


The Analytical Overview of the Main Currency Pairs on 2022.04.28

by JustForex

The EUR/USD currency pair

Technical indicators of the currency pair:
  • Prev Open: 1.0636
  • Prev Close: 1.0558
  • % chg. over the last day: -0.74%

Traders now expect the Fed to raise rates by 50 basis points at each of the next three meetings as the US central bank struggles to fight inflation well above its 2% target. The hawkish remarks by Powell and other Fed members have sparked rumors that a much higher level of 75 basis points will also be considered. Nevertheless, many analysts believe that the Fed’s aggressiveness is already in the prices. This means that when the official data is released, the dollar, on the contrary, may fall.

Trading recommendations
  • Support levels: 1.0453
  • Resistance levels: 1.0699, 1.0770, 1.0796, 1.0870, 1.0908, 1.0936

From the technical point of view, the EUR/USD currency pair trend on the hourly time frame is bearish. Growth in the dollar index led to the fall of the European currency. The MACD indicator is in the negative zone, selling pressure remains, but divergence has appeared. Under such market conditions, traders can look for sell deals from the resistance level of 1.0699, but only after the additional confirmation. Buy trades can be considered on intraday timeframes from the support level of 1.0453, but only with short targets and confirmation.

Alternative scenario: if the price breaks out through the 1.0770 resistance level and fixes above, the uptrend will likely resume.

EUR/USD
News feed for 2022.04.28:
  • – Eurozone Spanish Consumer Price Index (m/m) at 10:00 (GMT+2);
  • – Eurozone ECB Economic Bulletin (m/m) at 11:00 (GMT+2);
  • – Eurozone German Consumer Price Index (m/m) at 15:00 (GMT+2);
  • – US Initial Jobless Claims (w/w) at 15:30 (GMT+2);
  • – US GDP (q/q) at 15:30 (GMT+2).

The GBP/USD currency pair

Technical indicators of the currency pair:
  • Prev Open: 1.2573
  • Prev Close: 1.2545
  • % chg. over the last day: -0.22%

The pound sterling fell to a 21-month low against the dollar amid rising fears over the UK economic outlook. The UK government borrowing in the recently ended 2021/22 fiscal year was almost 20% higher than the country’s budget office forecast last month. This underscored the problem for Finance Minister Rishi Sunak, who is forced to provide new aid to households and businesses affected by rising inflation.

Trading recommendations
  • Support levels: 1.2438
  • Resistance levels: 1.2670, 1.2791, 1.2862, 1.2917, 1.2981, 1.3010, 1.3083, 1.3115

On the hourly time frame, the GBP/USD currency pair trend is still bearish. Growth in the dollar index led to the fall of the British pound. The MACD indicator is in the negative zone, selling pressure remains, but the divergence is increasing. The price has reached the daily support level. Under such market conditions, sell trades should be looked for from the resistance level of 1.2670, but with confirmation. For buy deals, traders may consider the level of 1.2438, but only after the appearance of a bullish initiative and with short targets.

Alternative scenario: if the price breaks down through the 1.2863 resistance level and fixes above, the mid-term uptrend will likely be resumed.

GBP/USD
There is no news feed for today.

The USD/JPY currency pair

Technical indicators of the currency pair:
  • Prev Open: 127.21
  • Prev Close: 128.42
  • % chg. over the last day: +0.95%

On Thursday, the Bank of Japan decided to maintain its monetary policy despite the weakening yen and rising inflationary pressures due to higher import costs. Japan is a major energy importer, and sustained increases in gas and oil prices undermine Japan’s trade conditions. The central bank’s board has decided to maintain its overall monetary policy, setting 10-year rates at around zero and short-term rates at -0.1%, reaffirming its commitment to unlimited government bond purchases. Thus, it may contribute to the next round of Japanese yen weakness.

Trading recommendations
  • Support levels: 128.87, 128.51, 127.24, 126.91, 125.48, 124.66, 122.97
  • Resistance levels: 130.85

The medium-term trend on the USD/JPY currency pair is bullish. The MACD indicator is positive again, and the buying pressure has increased. Under such market conditions, it is best to look for buy deals, expecting the continuation of the uptrend, but only after a pullback, as the price has strongly deviated from the average values. First of all, it is worth considering the support level of 128.87 or 128.51, but with additional confirmation. A resistance level of 130.85 may be considered for sell deals, but only with short targets.

Alternative scenario: If the price fixes below 126.91, the uptrend will likely be broken.

USD/JPY
News feed for 2022.04.28:
  • – Japan Retail Sales (m/m) at 02:50 (GMT+2);
  • – Japan BoJ Monetary Policy Statement at 06:00 (GMT+2);
  • – Japan BoJ Interest Rate Decision at 06:00 (GMT+2);
  • – Japan BoJ Outlook Report at 06:00 (GMT+2);
  • – Japan BoJ Press Conference (tentative).

The USD/CAD currency pair

Technical indicators of the currency pair:
  • Prev Open: 1.2818
  • Prev Close: 1.2816
  • % chg. over the last day: -0.02%

The Canadian dollar is a commodity currency and is highly dependent on the oil price movements and the dollar index. The dollar index is growing along with oil quotes. As a result, the USD/CAD currency pair is trading without significant changes. Currently, the USD/CAD currency pair has no fundamental prerequisites for a medium-term trend as rising oil prices, together with the Bank of Canada’s plans to raise interest rates, will strengthen the Canadian dollar.

Trading recommendations
  • Support levels: 1.2745, 1.2644, 1.2607, 1.2521
  • Resistance levels: 1.2852

The USD/CAD currency pair is bullish in terms of technical analysis. The MACD indicator remained positive, but the divergence increased. Trade is worth it only with short targets. Under such market conditions, it is better to look for buy trades on the lower timeframes from the support level of 1.2745 or 1.2644, but it is better with additional confirmation. For sell deals, it is better to consider the resistance level of 1.2852, but it is also better with confirmation and short targets.

Alternative scenario: if the price breaks through and consolidates below 1.2607, the downtrend will likely be resumed.

USD/CAD
News feed for 2022.04.28:
  • – Canada BOC Gov Macklem Speaks at 01:30 (GMT+2).

by JustForex


This article reflects a personal opinion and should not be interpreted as an investment advice, and/or offer, and/or a persistent request for carrying out financial transactions, and/or a guarantee, and/or a forecast of future events.

Another One Bites the Dust – The Deflation of Netflix

By Elliott Wave International

Bubbles are popping, one by one.

The share price of Netflix plummeted last week, coinciding with news that it is losing subscribers, a big change after years of growth. The media and conventional analysts will, of course, link the cause of the share price decline to the news but the chart below disputes that. More on that later. In the meantime, there are two aspects to consider with what is happening here.

Firstly, the deflation of Netflix shares is the latest domino to fall in a chain of popping bubbles since last year. Electric vehicles, SPACS, meme stocks and crypto / NFTs have all seen spectacular crashes in many asset prices. Fueled by a manically positive social mood, assets such as these were pumped up on hot air only to deflate as the consequence of herding behavior took hold. Netflix, the doyen of subscription broadcasters, was not immune and is now reaping the same result. Herding behavior, ironically enough, is in the DNA of broadcast media such as Netflix. When a show such as the Netflix-produced “The Crown” starts to trend on social media, its popularity is driven by quintessential herding behavior. It’s the same dynamic across all popular culture of course.

The second aspect to consider about the Netflix news is that it is a clear signal of demand destruction taking hold in the economy. The best cure of rising prices is rising prices goes the old saw, meaning that as consumer prices rise, demand will fall, and prices will stabilize. With consumer price inflation running rampant, households are examining their budgets and cutting back on what is not necessary. The stagflation that is being talked about now (low economic growth with high consumer price inflation) is a precursor to outright deflation as the low economic growth turns to recession and contraction.

Coming back to the “cause” of the Netflix collapse, the chart below shows that this latest news about losing subscribers has come well after the 2021 peak in the share price. The quarterly Japanese candlestick chart shows that a clear (and appropriate for the entertainment industry) Shooting Star pattern occurred in the final quarter of 2021. This bearish signal also occurred after a five-wave advance since 2009. Thus, coming into 2022, the stage was already set for a decline in the fortunes of Netflix.

As economic and financial conditions continue to tighten, expect many more dominoes to fall.

A “smart” investor knows more than how to pick a stock. Truly smart investors look at stocks…and bonds…and cryptos…and commodities — to understand the BIG picture.

Only then a certain wisdom emerges that helps you make truly informed, truly smart decisions.

Our friends at Elliott Wave International are helping you gain just that, FREE, with a new global market overview video recorded for MoneyShow by their Head of Global Research, Murray Gunn.

U.S., China, Russia, Bitcoin, bonds, commodities… The global economy is changing fast — and Murray’s view from 30,000 feet highlights new risks and opportunities ahead.

And at the end, Murray gives you the 3 big takeaways:

  1. Are bonds in a bull or bear market?
  2. Will U.S. stocks outperform or underperform Europe and China?
  3. What’s next for commodities, short- and long-term?

FREE, watch now: “Around the World’s Risks & Opportunities with Elliott Waves in 28 Minutes” >>

This article was syndicated by Elliott Wave International and was originally published under the headline Netflix (NFLX): See How Candlesticks Foresaw the Sell-Off. EWI is the world’s largest market forecasting firm. Its staff of full-time analysts led by Chartered Market Technician Robert Prechter provides 24-hour-a-day market analysis to institutional and private investors around the world.

Changes in sub-Saharan maize trade spells potential trouble for Kenya

By Wandile Sihlobo, Stellenbosch University 

Maize production in some of the sub-Saharan African countries that dominated maize supplies during the 2021/22 marketing year is expected to be lower this coming season. This will bring about some changes in the sub continent’s maize trade in the 2022/23 marketing year, in particular creating complications for Kenya. In the 2021/22 season, Kenya was the largest maize importer in the region.

But Kenya has a longstanding policy against genetically engineered maize. This limits the role of South Africa, the sub-continent’s biggest maize producer and exporter, in meeting Kenya’s needs.

The expected lower production comes in a season when demand for maize from countries in sub-Saharan Africa that rely heavily on imports is expected to remain strong. It’s estimated that Kenya, for example, will need to import 700,000 tonnes of maize for 2022/23. Kenya’s maize production is expected to be marginally higher, but not enough to meet the country’s needs.

Kenya is typically one of the major maize importing countries in sub-Saharan Africa. The country’s expected 700,000 tonnes of maize imports account for 21% of the region’s expected maize imports of 3.4 million tonnes in 2021/22 season, according to data from the International Grains Council. Other typical maize importing countries include Zimbabwe, Botswana, Mozambique and Namibia.

However, in the 2021/22 marketing year, several sub-Saharan African countries such as Zambia, Tanzania, Zimbabwe (an exceptional year from the usual importing position) and South Africa had ample maize harvest. This made it easy for them to meet Kenya’s import needs. Tanzania and Zambia were the leading maize suppliers to Kenya.

Tanzania, the biggest exporter in the region in the 2020/2021 season and Kenya’s traditional major maize supplier, is unlikely to play that role this season because its maize production is forecast to fall by 16% year-on-year to 5.9 million tonnes. This is due to drought at the start of the season, combined with armyworm infestations and reduced fertiliser usage in some regions because of prohibitively higher prices. The consequence of the fall in production and firmer domestic consumption means that the country could have less maize for export markets.

Preliminary estimates by the United States Department of Agriculture are that Tanzania’s maize exports could decline from 800,000 tonnes in the 2021/22 marketing year to 100,000 tonnes in the 2022/23 marketing year.

Such a drop would leave very little for Kenya’s maize needs, leaving Zambia and South Africa as major suppliers in the region.

Zambia’s expected maize production in the current season is still tentative, and it is unclear how much maize the country could have for exports. Zimbabwe, which had a large harvest in 2020/21 season, is also in an uncertain position about its 2021/22 maize harvest and ability to export. The incoming evidence suggest that some regions in the country have suffered crop failures.

South Africa could help and has the maize production capacity to do so. Given current output projections of 14.7 million tonnes, South Africa could have 3.2 million tons of maize for exports in the 2022/23 season – about 78% being yellow maize, and 22% white maize. But it plays a limited role in the Kenyan maize market.

The barriers

South Africa’s limited participation in the Kenyan maize market is arguably affected by regulations rather than just price and consumer preferences. Kenya continues to maintain an import ban on genetically engineered products.. This limits imports from South Africa where over 80% of maize production is genetically engineered.

There are indications that Kenya is changing its longstanding policy. Regulatory agencies have recently completed all trials for the approval of biotechnology maize. But any decision would still have to be approved by Kenya’s cabinet.

Even if Kenya were to adjust its policy, South Africa would not necessarily be the only maize supplier looking at expanding its market share in the country. The likes of the US and Brazil would also be at Kenya’s doorstep. The advantage of South Africa would be its substantial white maize production, which is the preferred staple grain of Kenyan consumers.

Outside the African continent, Mexico, the US and Argentina could be among the potential maize suppliers, as there are generally few white maize producing countries in the world.

Imbalances

The sub-Saharan Africa maize trade generally has some imbalances. South Africa, Tanzania and Zambia are the major maize producers and exporters in the region. For their part Kenya, Zimbabwe, Botswana, and Mozambique are often the importers.

At the regional level, sub-Saharan Africa’s aggregate maize imports amount to an average of 3.4 million tonnes a year, according to data from the International Grains Council. This is both white and yellow maize, with most being white maize for human consumption.

Although intra-regional trade accounts for most of the consumption needs of import-reliant countries in the region, this is also supplemented by imports from countries outside of the continent such as Argentina, Canada and Mexico.

Overall, these maize market dynamics are worth monitoring, specifically from South Africa’s perspective, as they signal that the sub-Saharan maize demand in the 2022/23 marketing year could be much larger than the previous season. This could be the case especially if Zambia’s maize production comes out lower than the 2021/22 season, which is likely if we use the South African maize production conditions as a barometer for the region. Such a potential increase in the region’s maize imports would have implication for prices.The Conversation

About the Author:

Wandile Sihlobo, Senior Fellow, Department of Agricultural Economics, Stellenbosch University

This article is republished from The Conversation under a Creative Commons license. Read the original article.


Murrey Math Lines 27.04.2022 (USDJPY, USDCAD)

Article By RoboForex.com

USDJPY, “US Dollar vs. Japanese Yen”

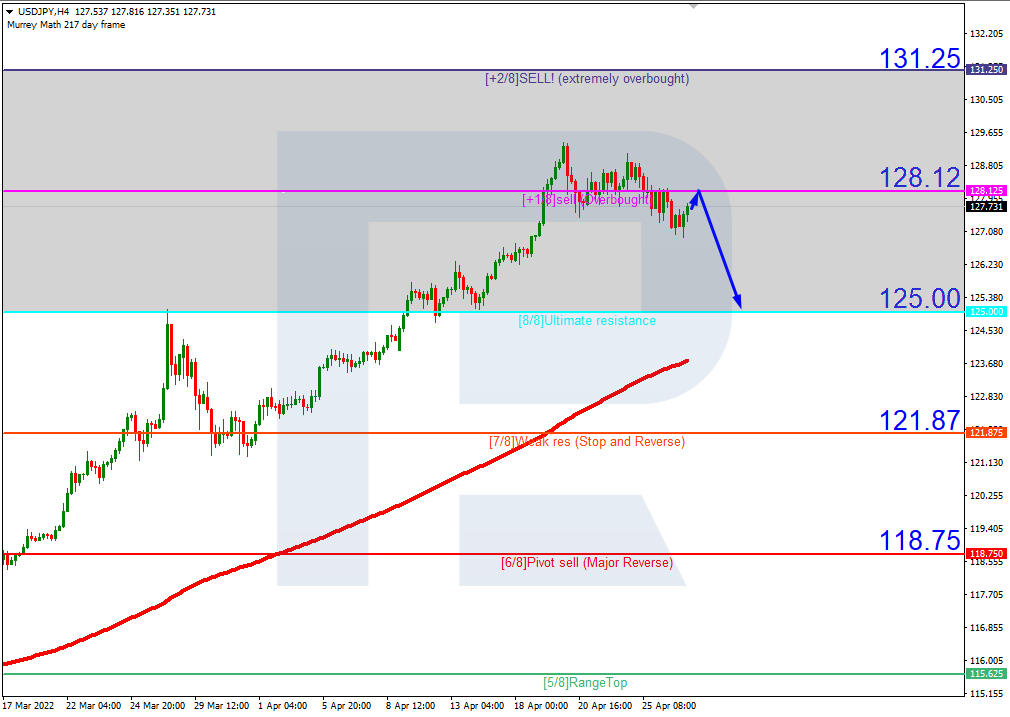
In the H4 chart, USDJPY is trading within the “overbought area”. In this case, the price is expected to test +1/8, rebound from it, and then resume falling to reach the support at 8/8. However, this scenario may no longer be valid if the price breaks the resistance at +1/8 to the upside. After that, the instrument may continue moving towards +2/8.

USDJPYH4
Risk Warning: the result of previous trading operations do not guarantee the same results in the future

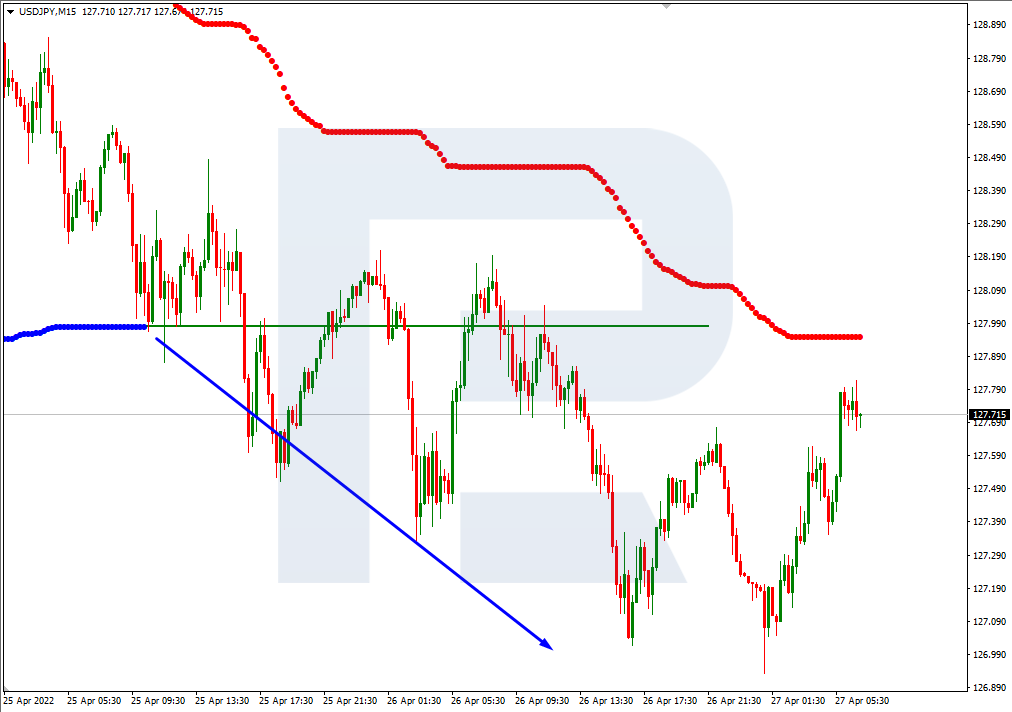
As we can see in the M15 chart, the pair has broken the downside line of the VoltyChannel indicator and, as a result, may continue trading downwards.

USDJPY_M15
Risk Warning: the result of previous trading operations do not guarantee the same results in the future

USDCAD, “US Dollar vs Canadian Dollar”

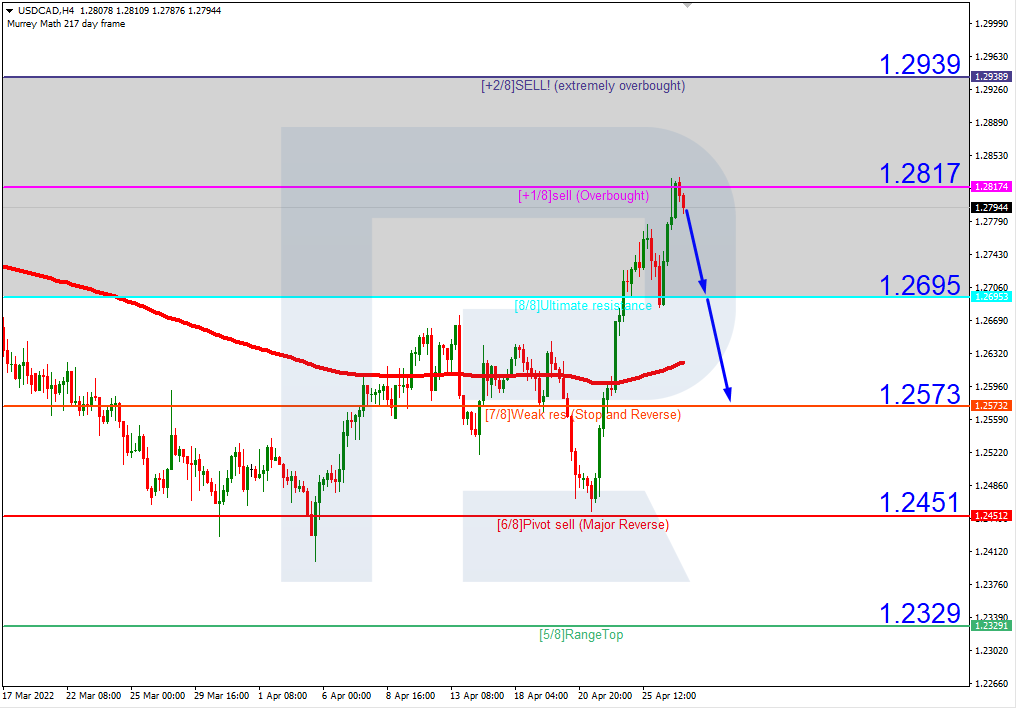
As we can see in the H4 chart, USDCAD is also moving inside the “overbought area”; it has already rebounded from the resistance at +1/8. In this case, the price may break 8/8 and then continue falling towards the support at 7/8. On the other hand, this scenario may no longer be valid if the pair breaks the resistance at +1/8 to the upside. After that, the instrument may reverse and move upwards to reach +2/8.

USDCAD_H4
Risk Warning: the result of previous trading operations do not guarantee the same results in the future

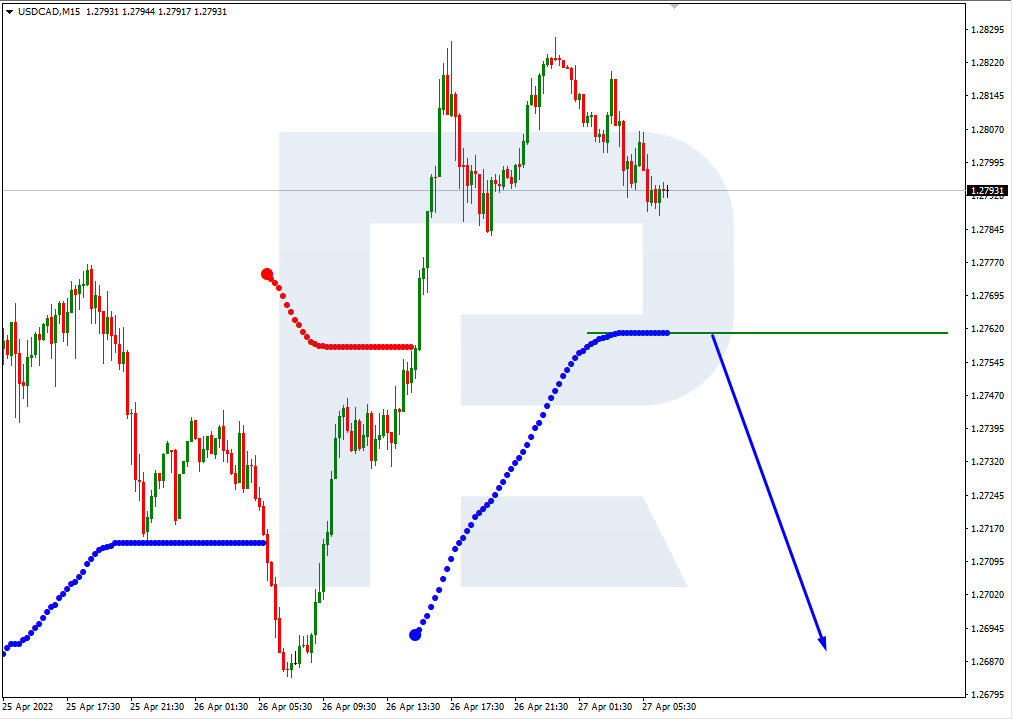
In the M15 chart, the pair may break the downside line of the VoltyChannel indicator and, as a result, continue its decline.

USDCAD_M15
Risk Warning: the result of previous trading operations do not guarantee the same results in the future

Article By RoboForex.com

Attention!
Forecasts presented in this section only reflect the author’s private opinion and should not be considered as guidance for trading. RoboForex LP bears no responsibility for trading results based on trading recommendations described in these analytical reviews.

New lows in EURUSD. Overview for 27.04.2022

Article By RoboForex.com

EURUSD continues falling and reaching new lows.

The major currency pair hit another bottom. The current quote for the instrument is 1.0619.

The Durable Goods Orders report from the US was below expectations but still quite positive – the indicator added 0.8% mm in March against the expected reading of 1.0% m/m. In February, it lost 1.7% m/m. The Core Durable Goods Orders gained 1.1% m/m, while it was expected to add 0.6% m/m.

So, the numbers were quite good and supported the “greenback”. Everything is simple – the positive statistics improve the GDP Q1 expectations and give reasons to count on a more aggressive monetary policy tightening by the US Fed.

Another factor supporting the USD is concerns about the lockdown in China, where they haven’t been able to handle the COVID-19 outbreak so far. Moreover, global capital markets continue escaping risks, and that’s another signal in favour of the American currency.

Today’s economic calendar is not very replete with the statistics – the US will report on the Trade Balance for March. Investors are looking forward to the US GDP Q1 report to be published on Thursday.

Article By RoboForex.com

Attention!
Forecasts presented in this section only reflect the author’s private opinion and should not be considered as guidance for trading. RoboForex LP bears no responsibility for trading results based on trading recommendations described in these analytical reviews.

The Analytical Overview of the Main Currency Pairs on 2022.04.27

by JustForex

The EUR/USD currency pair

Technical indicators of the currency pair:
  • Prev Open: 1.0713
  • Prev Close: 1.0637
  • % chg. over the last day: -0.71%

The European currency has been hit hard by the economic consequences of the war in Ukraine and expectations that the European Central Bank will move slower than the Fed in raising interest rates. Yesterday, the euro declined further after reports of the cessation of Russian gas supplies under the Yamal contract to Poland.

Trading recommendations
  • Support levels: 1.0632
  • Resistance levels: 1.0699, 1.0770, 1.0796, 1.0870, 1.0908, 1.0936

From the technical point of view, the trend of the EUR/USD currency pair on the hourly time frame is bearish. Growth in the dollar index led to the fall of the European currency. The MACD indicator is in the negative zone, selling pressure remains, but divergence has appeared. The price has reached the daily support level. Under such market conditions, it is possible to look for buy trades on intraday timeframes from the support level of 1.0632, but only with short targets and confirmation. Sell trades should be considered from the resistance level of 1.0699, but only after the additional confirmation.

Alternative scenario: if the price breaks out through the 1.0870 resistance level and fixes above, the uptrend will likely resume.

EUR/USD
News feed for 2022.04.26:
  • – Eurozone ECB President Lagarde Speaks at 14:30 (GMT+2);
  • – US Pending Home Sales (m/m) at 17:00 (GMT+2).

The GBP/USD currency pair

Technical indicators of the currency pair:
  • Prev Open: 1.2740
  • Prev Close: 1.2574
  • % chg. over the last day: -1.32%

Weak retail sales and consumer confidence figures showed that higher inflation takes a toll on ordinary citizens. The pound fell on Tuesday as the Bank of England was not in the mood for an aggressive rate hike in the background, despite growing concerns about a UK economic slowdown due to high inflation.

Trading recommendations
  • Support levels: 1.2585
  • Resistance levels: 1.2670, 1.2791, 1.2862, 1.2917, 1.2981, 1.3010, 1.3083, 1.3115

On the hourly time frame, the GBP/USD currency pair trend is still bearish. Growth in the dollar index led to the fall of the British pound. The MACD indicator is in the negative zone, selling pressure remains, but divergence has appeared. The price has reached the daily support level. Under such market conditions, sell trades should be looked for from the resistance level 1.2670, but with confirmation. For buy deals, traders may consider the level of 1.2585, but only after the appearance of a bullish initiative and with short targets.

Alternative scenario: if the price breaks down through the 1.2981 resistance level and fixes above, the mid-term uptrend will likely be resumed.

GBP/USD
There is no news feed for today.

The USD/JPY currency pair

Technical indicators of the currency pair:
  • Prev Open: 128.12
  • Prev Close: 127.19
  • % chg. over the last day: -0.73%

The Japanese yen rebounded slightly as investors expected the Bank of Japan to take steps to stabilize the currency, which hit a 20-year low against the dollar last week. Meanwhile, on Tuesday, Japanese Prime Minister Fumio Kishida called on the central bank to maintain an ultra-soft monetary policy, rejecting the idea of using higher interest rates to prevent the yen from falling further.

Trading recommendations
  • Support levels: 127.24, 126.69, 125.48, 124.66, 122.97
  • Resistance levels: 129.36

The medium-term trend on the USD/JPY currency pair is bullish. The MACD indicator has become negative. The price has taken a more flat structure. Under such market conditions, it is best to look for buy deals, expecting the continuation of the uptrend, but after the price makes a pullback to the nearest support levels. First of all, it is worth considering the support level of 127.24 or 126.69, but with additional confirmation. A resistance level of 129.36 may be considered for sell deals, but only with short targets.

Alternative scenario: If the price fixes below 125.55, the uptrend will likely be broken.

USD/JPY
There is no news feed for today.

The USD/CAD currency pair

Technical indicators of the currency pair:
  • Prev Open: 1.2731
  • Prev Close: 1.2825
  • % chg. over the last day: +0.74%

The Canadian dollar is a commodity currency and is highly dependent on the oil price movements and the dollar index. The dollar index continued to rise yesterday, but oil prices jumped by more than 3%. As a result, the USD/CAD currency pair is trading slightly higher. Currently, the USD/CAD currency pair has no preconditions for a medium-term trend as growth in oil prices, together with the Bank of Canada’s plans to raise interest rates, will contribute to strengthening the Canadian dollar.

Trading recommendations
  • Support levels: 1.2745, 1.2644, 1.2607, 1.2521
  • Resistance levels: 1.2817

In terms of technical analysis, the USD/CAD currency pair is bullish. The MACD indicator remained positive, but divergence appeared. Trade is worth it only with short targets. Under such market conditions, it is better to look for buy trades on the lower timeframes from the support level of 1.2745 or 1.2644, but it is better with additional confirmation. For sell deals, it is better to consider the resistance level of 1.2817, but it is also better with confirmation and short targets.

Alternative scenario: if the price breaks through and consolidates below 1.2607, the downtrend will likely be resumed.

USD/CAD
There is no news feed for today.

by JustForex


This article reflects a personal opinion and should not be interpreted as an investment advice, and/or offer, and/or a persistent request for carrying out financial transactions, and/or a guarantee, and/or a forecast of future events.

Reports from Google and Microsoft failed to keep major indices from falling.

by JustForex

On Tuesday, Google missed Wall Street estimates for quarterly sales, the first drop since the pandemic began, as advertisers cut spending amid growing fears of a global economic slowdown. The company’s stock fell more than 8% in the late session. Microsoft has exceeded Wall Street’s expectations for quarterly revenue, driven by high demand for the software giant’s cloud services because of the pandemic-induced shift to hybrid operating models. But despite such positivity, the company’s stock fell more than 3.5% after closing. Amid fears that Elon Musk will have to pledge or sell most of Tesla’s shares to buy the social network Twitter, the electric car maker’s shares fell by 12% yesterday. In addition to the drop in the tech sector, other companies’ financial performance also exacerbated the sell-off caused by the downturn in regional banks amid weaker quarterly results and falling Treasury bond yields. After the stock market closed yesterday, the Dow Jones index (US30) decreased by 2.38%, the S&P 500 index (US500) lost 2.81%, and the NASDAQ Technology Index (US100) fell by 3.95%.

The US consumer confidence index fell to 107.3 points in April from a revised 107.6 points in March. US new homes sales in March fell by 8.6% from the previous month to an annualized rate of 763,000. The index declined for the third month in a row.

Major European indices traded lower yesterday. Germany’s DAX (DE30) decreased by 1.20%, France’s CAC 40 (FR 40) lost 0.57%, Spain’s IBEX 35 (ES35) fell by 1.58%, and Britain’s FTSE 100 (UK100) added 0.08%. Investors expect European stock markets to open lower on Wednesday as economists digest escalating geopolitical tensions and unfavorable global growth prospects. Russia begins gas blackmailing Europe over countries’ unwillingness to pay for gas in rubles. Russia’s Gazprom has informed Bulgarian gas company Bulgargaz and Poland’s PGNiG about the suspension of gas supplies starting on April 27 due to a refusal to pay in Russian rubles. At the same time, Germany can afford to give up Russian oil, said German Economy Minister Robert Habeck. The share of Russian oil in supplies to Germany fell to 12% from 35%, and it is intended only for a refinery in Schwedt. Habeck suggested that it would take only a few days to find an alternative to these supplies.

Russian Foreign Minister Sergei Lavrov has said that if the US and its allies continue to supply weapons to Ukraine, there is a risk that the war could escalate into a wider conflict with NATO countries.

The escalation of Russia’s quarrel with the West caused oil prices to rise yesterday. Black gold prices rose by 3%, recovering from three days of declines.

Asian markets traded yesterday without a single trend. Japan’s Nikkei 225 (JP225) gained 0.41%, Hong Kong’s Hang Seng (HK50) jumped by 0.33%, and Australia’s S&P/ASX 200 (AU200) ended the day with a 2.08% drop. Traders are under pressure from factors such as the coronavirus outbreak in China, rising inflation rates, and prospects of central banks’ rates increasing. All of them contribute to growing concerns about further economic growth and cause volatility in the market. Beijing is undergoing mass testing after increasing Covid-19 cases, raising fears that the Chinese capital could face a lockdown. Chinese President Xi Jinping is demanding that officials ensure that China’s GDP growth rate this year surpasses that of the United States, despite the adverse effects of another COVID-19 outbreak in the country.

Main market quotes:

S&P 500 (F) (US500) 4,175.20 −120.92 (−2.81%)

Dow Jones (US30) 33,240.18 −809.28 (−2.38%)

DAX (DE40) 13,756.40 −167.77 (−1.20%)

FTSE 100 (UK100) 7,386.19 +5.65 (+0.077%)

USD Index 102.34 +0.59 (+0.57%)

Important events for today:
  • – Australia Consumer Price Index (q/q) at 04:30 (GMT+2);
  • – Eurozone ECB President Lagarde Speaks at 14:30 (GMT+2);
  • – US Pending Home Sales (m/m) at 17:00 (GMT+2);
  • – US Crude Oil Reserves (w/w) at 17:30 (GMT+2).

by JustForex


This article reflects a personal opinion and should not be interpreted as an investment advice, and/or offer, and/or a persistent request for carrying out financial transactions, and/or a guarantee, and/or a forecast of future events.

Navigating Volatility – Risk-Controlled Portfolio

By Ino.com

Controlling portfolio beta, which measures overall systemic risk of a portfolio compared to the market, on the whole, is essential as these markets continue to display bouts of extreme volatility. Containing volatility while generating superior returns relative to the market is the goal with an options-based portfolio. Mitigating risk within a portfolio can be achieved via a blended options-based approach where cash is held in conjunction with stock positions and an options component. Options alone cannot be the sole driver of portfolio appreciation; however, options can play a critical component in the overall portfolio construction to control risk and volatility.

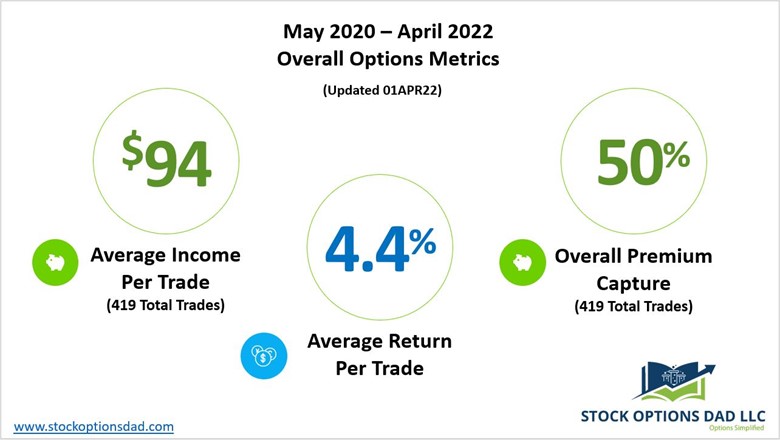
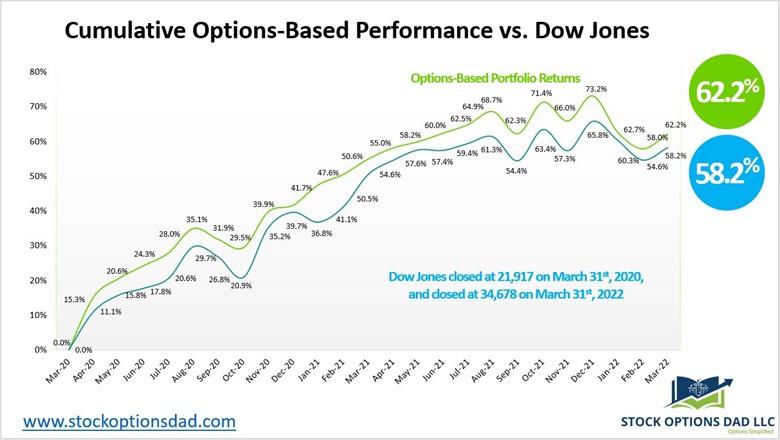
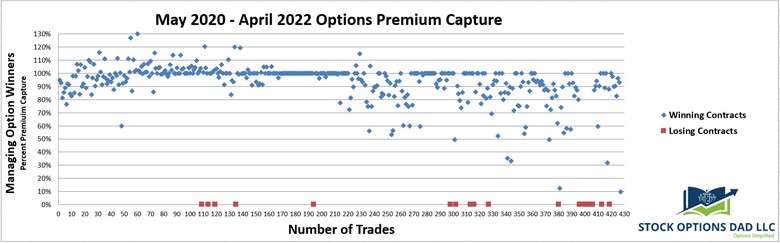
Generating consistent monthly income while defining risk, leveraging a minimal amount of capital, and maximizing returns is the core of the options-based portfolio strategy. Options can enable smooth and consistent portfolio appreciation without guessing which way the market will move. Options allow one to generate consistent monthly income in a high probability manner in various market scenarios. Over the past 24 months (April 2020 – March 2022), 419 trades were placed and closed. An options win rate of 97% was achieved with an average ROI per trade of 4.4% and an overall option premium capture of 50% while outperforming the Dow Jones throughout these two years. The performance of an options-based portfolio demonstrates the durability and resiliency of options trading to drive portfolio results with substantially less risk. The options-based approach attempts to circumvent market drawdowns and generated a return of 62.2% relative to the Dow Jones’ 58.2% (Figures 1, 2, and 3).

Controlling Volatility
Figure 1 – Overall option metrics from May 2020 to March 2022 available via a Trade notification service

Controlling Volatility
Figure 2 – Overall options-based performance compared to the Dow Jones from April 2020 to March 2022

Controlling Volatility
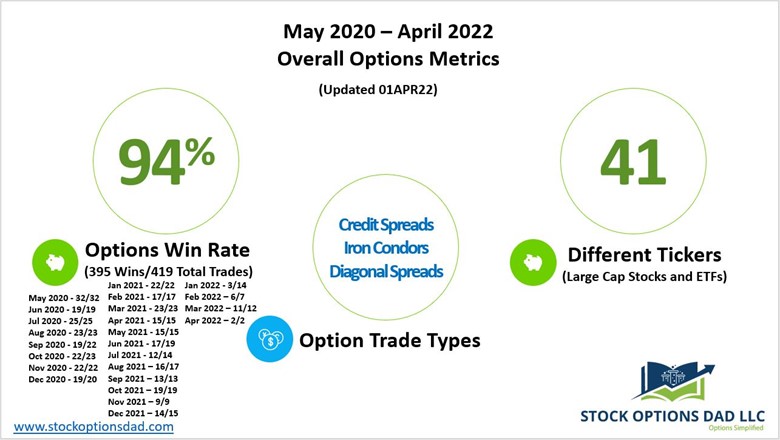
Figure 3 – Overall option metrics from May 2020 to March 2022

Results

Compared to the broader Dow Jones index, the blended options, long equity, and cash portfolio have outperformed this index overall and outperformed during negative return months. In even the most bullish scenario, post-pandemic lows where the markets erased all the declines and blew past previous highs via V-shaped recovery, this approach has outperformed the Dow Jones returns through March 2022 with substantially less risk (Figure 2).

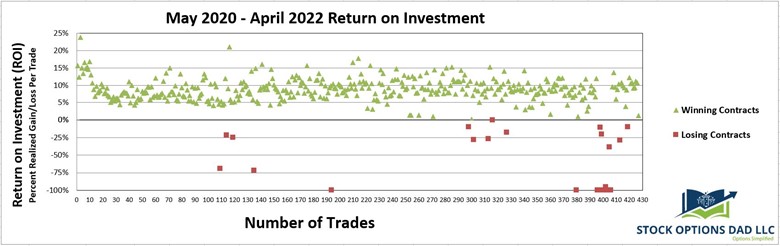
Overall, from May 2020 through March 2022, 419 trades were placed and closed. As a result, an options win rate of 97% was achieved with an average ROI per trade of 4.4% and an overall option premium capture of 50% while outperforming the broader market (Figures 4 and 5).

Return On Investment May 2020 - April 2022
Figure 4 – ROI per trade over the past 419 trades

Options Premium Capture May 2020 - April 2022
Figure 5 – Percent premium capture per trade over the last 419 trades

Consistent Income Despite Market Declines

September 2020, October 2020, January 2021, September 2021, and February 2022 declines provide a great opportunity to demonstrate the durability and resiliency of an options-based portfolio. Positive returns for the options portion of the portfolio were achieved in all of these negative months.

The positive options returns were in sharp contrast to the negative returns for the overall market during these negative months. Generating consistent income without guessing which way the market will move with the probability of success in your favor is the key to options trading. However, the January 2022 market declines did result in option losses.

10 Rules for an Agile Options Strategy

Throughout the past 24 months of the post-pandemic rebound, a disciplined approach to an agile options-based portfolio has been essential to navigate pockets of volatility and circumvent market declines. A slew of protective measures should be deployed if options are used to drive portfolio results. When selling options and managing an options-based portfolio, the following guidelines are essential:

    • 1. Trade across a wide array of uncorrelated tickers


    • 2. Maximize sector diversity


    • 3. Spread option contracts over various expiration dates


    • 4. Sell options in high implied volatility environments


    • 5. Manage winning trades


    • 6. Use defined-risk trades


    • 7. Maintains a ~50% cash level


    • 8. Maximize the number of trades so the probabilities play out to the expected outcomes


    • 9. Place probability of success in your favor (delta)


    10. Appropriate position sizing/trade allocation

Conclusion

Controlling portfolio beta to reduce systemic risk in relation to the broader market while generating superior returns can be achieved via a blended options-based approach via cash held in conjunction with long equity and an options component.

An option-based strategy has been key in circumventing market declines and reinforce why appropriate risk management is essential. An options-based approach provides a margin of safety while mitigating the impacts of drastic market moves and containing portfolio volatility. In the face of volatility, consistent monthly income has been generated while outpacing the Dow Jones. Moreover, a cash, long equity, and options hybrid portfolio demonstrates its durability even when compared to the most bullish conditions post-pandemic bull market.

Following the 10 rules in options trading has generated positive returns in all market conditions for the options segment of the portfolio over the past 24 months, with the exception of January 2022. Moreover, the positive options returns were in sharp contrast to the negative returns for the overall market in down months. This demonstrates the durability and resiliency of an options-based portfolio to outperform during pockets of market turbulence. To this end, portfolio agility is required to mitigate uncertainty and volatility.

Noah Kiedrowski
INO.com Contributor

Disclosure: Stock Options Dad LLC is a Registered Investment Adviser (RIA) firm specializing in options-based services and education. There are no business relationships with any companies mentioned in this article. This article reflects the opinions of the RIA. Any recommendation contained in this article is subject to change at any time. No recommendation is intended to constitute an entire portfolio. The author encourages all investors to conduct their own research and due diligence prior to investing or taking any actions in options trading. Please feel free to comment and provide feedback; the author values all responses. The author is the founder and Managing Member of Stock Options Dad LLC – A Registered Investment Adviser (RIA) firm www.stockoptionsdad.com defining risk, leveraging a minimal amount of capital, and maximizing return on investment. For more engaging, short-duration options-based content, visit Stock Options Dad LLC’s YouTube channel. Please direct all inquires to [email protected]. The author holds shares of AAPL, ADBE, AMD, AMZN, ARKK, AXP, BA, BBY, C, CMG, CRM, DIA, DIS, FB, FDX, FXI, GOOGL, GS, HD, HON, INTC, IWM, JPM, MA, MS, MSFT, NKE, NVDA, PYPL, QQQ, SBUX, SPY, SQ, TMO, TWTR, UNH, V and WMT.

By Ino.com – See our Trader Blog, INO TV Free & Market Analysis Alerts

Source: Navigating Volatility – Risk-Controlled Portfolio

Three priorities Africa’s newbie on the World Bank board should focus on

By Danny Bradlow, University of Pretoria and Magalie Masamba, University of Pretoria 

President Cyril Ramaphosa recently appointed a senior South African politician, Ayanda Dlodlo, to serve a two-year term as a member of the World Bank’s 25-person Board of executive directors. She will represent a constituency consisting of Angola, Nigeria and South Africa.

Dlodlo has previously held two cabinet positions – as minister of public service and administration and state security.

The appointment of such a senior politician to executive director position offers South Africa an opportunity to influence the World Bank’s relations with Africa.

The 25 executive directors of the bank fulfil a dual function. Firstly, they operate as the governing board of the World Bank. Their second function is to represent the interests of their countries at the bank.

Given these two remits we propose three issues that Dlodlo should prioritise in her term as executive director.

The role

Executive directors must approve all World Bank loans and guarantees, country assistance strategies, the administrative budget of the Bank, and the Bank’s key operational policies and procedures. They also monitor the management and staff of the Bank compliance with these policies.

In all these activities, the board has a fiduciary responsibility to act in the best interests of the World Bank.

Their second function is to represent the interests of the countries in their constituency. This inevitably means that the Board is a more political board than the board of most banks.

In an effort to mitigate its politicisation, the board has developed the custom of operating largely by consensus. Formal votes by the board are unusual. This is significant for two reasons.

First, World Bank member states have weighted votes, with their votes being weighted according to a formula based on their economic size and role in the global economy. Each executive director has a vote equal to the sum of the votes of the states in their constituency. Thus, a minority of powerful executive directors, with large weighted votes, can outvote the majority of the board.

China, France, Germany, Japan, Saudi Arabia, the UK and the US are each represented by their own executive director. These seven executive directors have over 50% of the total vote in the Bank. The remaining 182 World Bank member states belong to constituencies each of which is represented by one executive director.

Second, the practice of consensus means that any executive director that earns the respect of their colleagues can become an influential voice in the board’s decision-making process regardless of their constituency’s vote.

The constituency that Dlodlo will represent is particularly small. It was created in 2010 when the World Bank approved a resolution increasing the number of elected executive directors from 24 to 25. This decision followed a concerted campaign by African states and their allies, in which South Africa played a leading role, to improve the voice of African states in the governance of the Bank.

This reform demonstrates the role that South Africa can play in advancing the interests of African countries at the bank.

Priorities

Dlodlo’s first priority should be to advocate for improved support for Africa. World Bank support is a matter of both the quantity of funds and its quality.

Dlodlo and her fellow African executive directors therefore need to take a pronged approach.

Firstly, they should argue, that the Bank should increase the level of financial support that it provides to Africa so that it can deal with the adverse economic effects of the war in Ukraine. The war is leading to increased prices in goods like food and fertiliser for which certain African countries are heavily dependent on Russia and Ukraine.

Second, they should advocate that the financing should be provided in a form that allows African countries the maximum possible flexibility in how they can use the funds. In particular, the terms of the financing should help countries promote their own agenda for dealing with the challenges that they face in promoting sustainable and inclusive development.

This means that the support should be focused on helping governments and communities use the funds consistently with the international norms and standards they’ve signed up to. These include the sustainable development goals, the declaration on the right to development and the core human rights treaties.

Secondly, Africa’s representatives on the World Bank board should advocate for a more creative and sustainable approach to Africa’s looming debt crisis.

Currently, 22 low-income African countries are either in debt distress or at high risk of debt distress. The international community’s response has been tepid. The Debt Service Suspension Initiative which provided temporary debt repayment standstills has ended. While many eligible African countries took advantage of it, they received limited support. It is also becoming evident – as acknowledged by the World Bank President – that the Common Framework for Debt Treatments beyond the initiative has serious shortcomings.

This suggests that there is a need for new approaches. The World Bank is one forum in which to organise more creative and sustainable avenues to dealing with African debtors in distress. For example, Africa’s executive directors could advocate that the World Bank support efforts to hold all Africa’s creditors, including its bondholders, to the applicable international norms and standards.

The third area in which Africa’s executive directors can play a role is in promoting a more accountable and responsive bank.

Over the last three decades the World Bank has been a leader in promoting more transparent and accountable development finance. But there are still shortcomings in its approach to it’s own accountability for compliance with its operational policies.

A substantial cause of these problems is the failure of the Bank management and staff to treat accountability as part of the learning process at the Bank rather than as a means for assigning blame. This is unfortunate because development projects are inherently complex and uncertain. Even the best and most committed development practitioners are likely to make mistakes. They therefore need to have a means of identifying and learning from these mistakes. They also need to learn about these mistakes expeditiously so that they can take action before their unintended mistakes have irreversible adverse social and environmental impacts.

Communities are both an important source of information on these problems and the unfortunate victims of their effects. Consequently, an independent mechanism that allows these actors to raise their concerns and get them addressed in a timely and effective manner is a necessary element in the development process. It also offers the World Bank a unique and essential perspective on the impacts of its operations.

The Bank created the Inspection Panel, its own independent accountability mechanism in 1993. In 2020 the executive directors created an expanded mechanism, the Accountability Mechanism to investigate complaints from external stakeholders that they have been harmed by the management and staff’s failure to comply with these policies.

Dlodlo should use her position to help change the Bank’s general approach to accountability so that it is more open to admitting its mistakes, correcting them and learning from them.The Conversation

About the Author:

Danny Bradlow, SARCHI Professor of International Development Law and African Economic Relations, University of Pretoria and Magalie Masamba, Post-doctoral Fellow, Centre for Human Rights, University of Pretoria

This article is republished from The Conversation under a Creative Commons license. Read the original article.