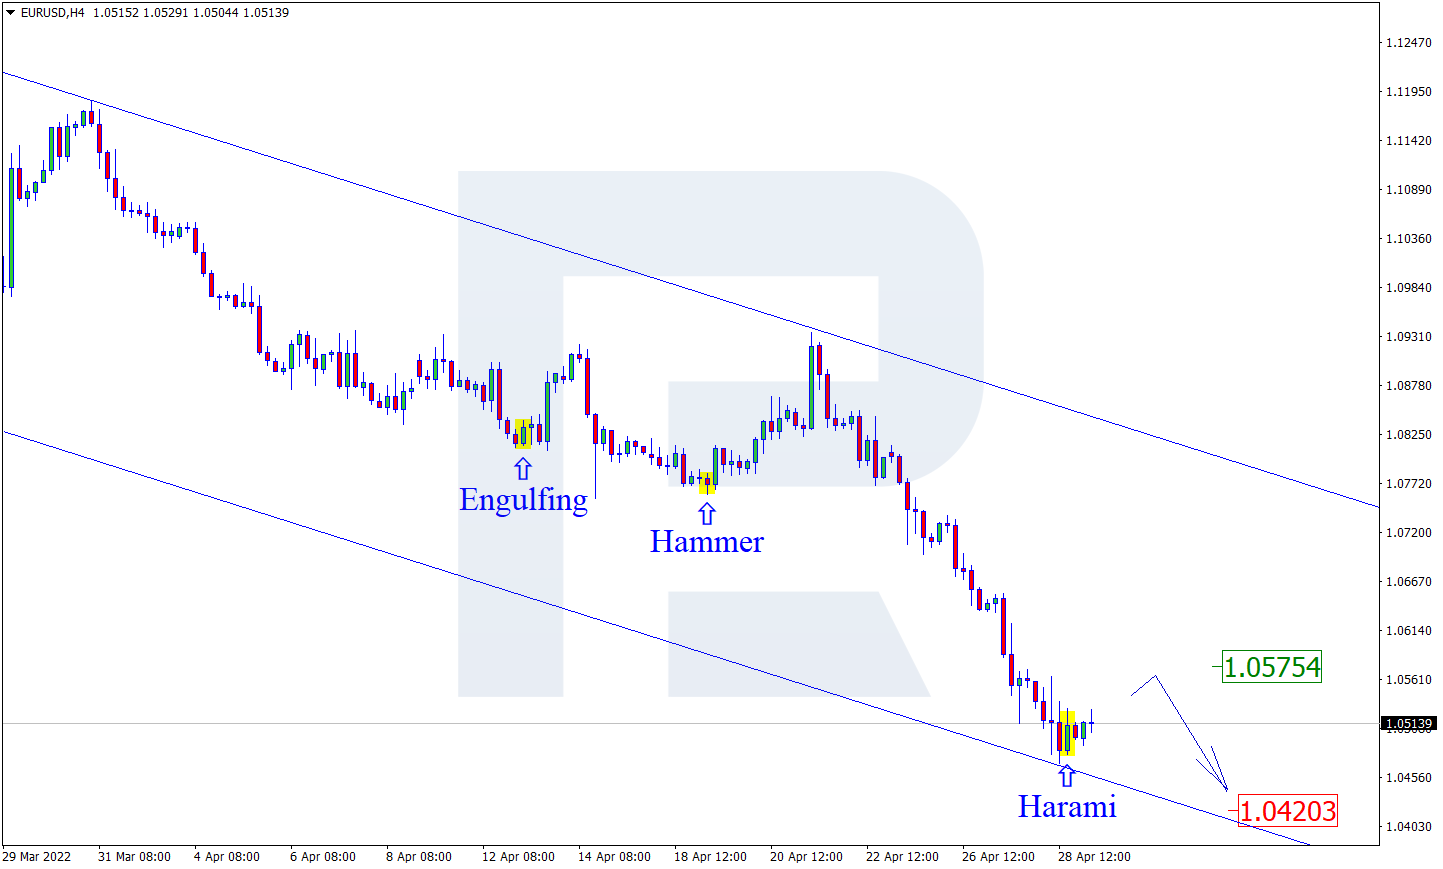
As we can see in the H4 chart, the asset has formed a Harami reversal pattern close to the support area. At the moment, EURUSD is reversing in the form of a new correctional impulse. In this case, the upside correctional target may be at 1.0575. However, an alternative scenario implies that the price may fall to reach 1.0420 and continue the descending tendency without any corrections towards the resistance level.
USDJPY, “US Dollar vs Japanese Yen”
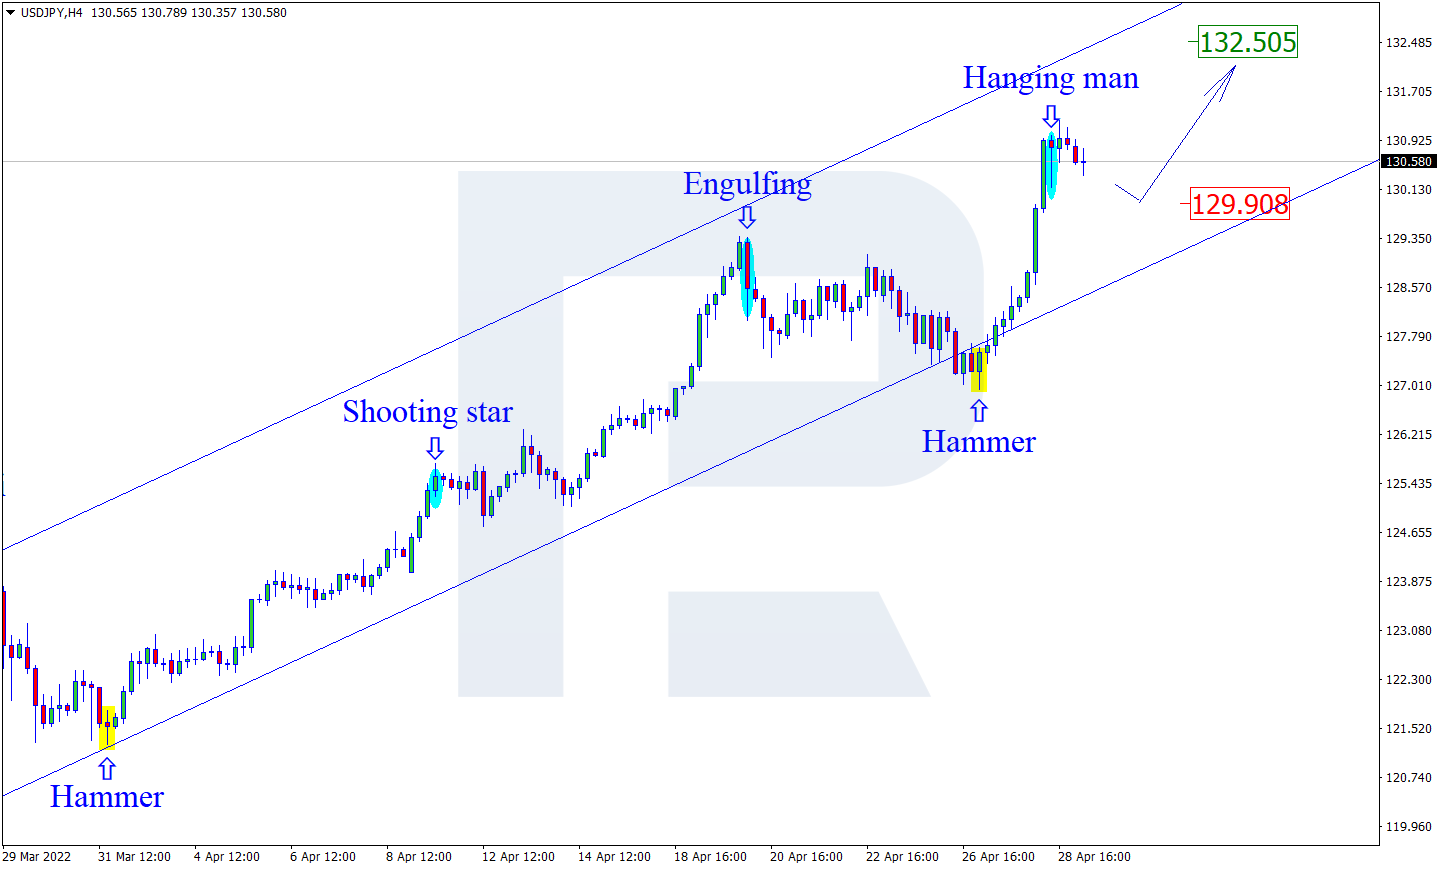
As we can see in the H4 chart, USDJPY has formed a Hanging Man pattern not far from the resistance level. At the moment, the asset is reversing in the form of a new descending impulse. In this case, the downside correctional target may be at 129.90. At the same time, an opposite scenario implies that the price may grow to reach 132.50 and continue the uptrend without any pullbacks.
EURGBP, “Euro vs Great Britain Pound”
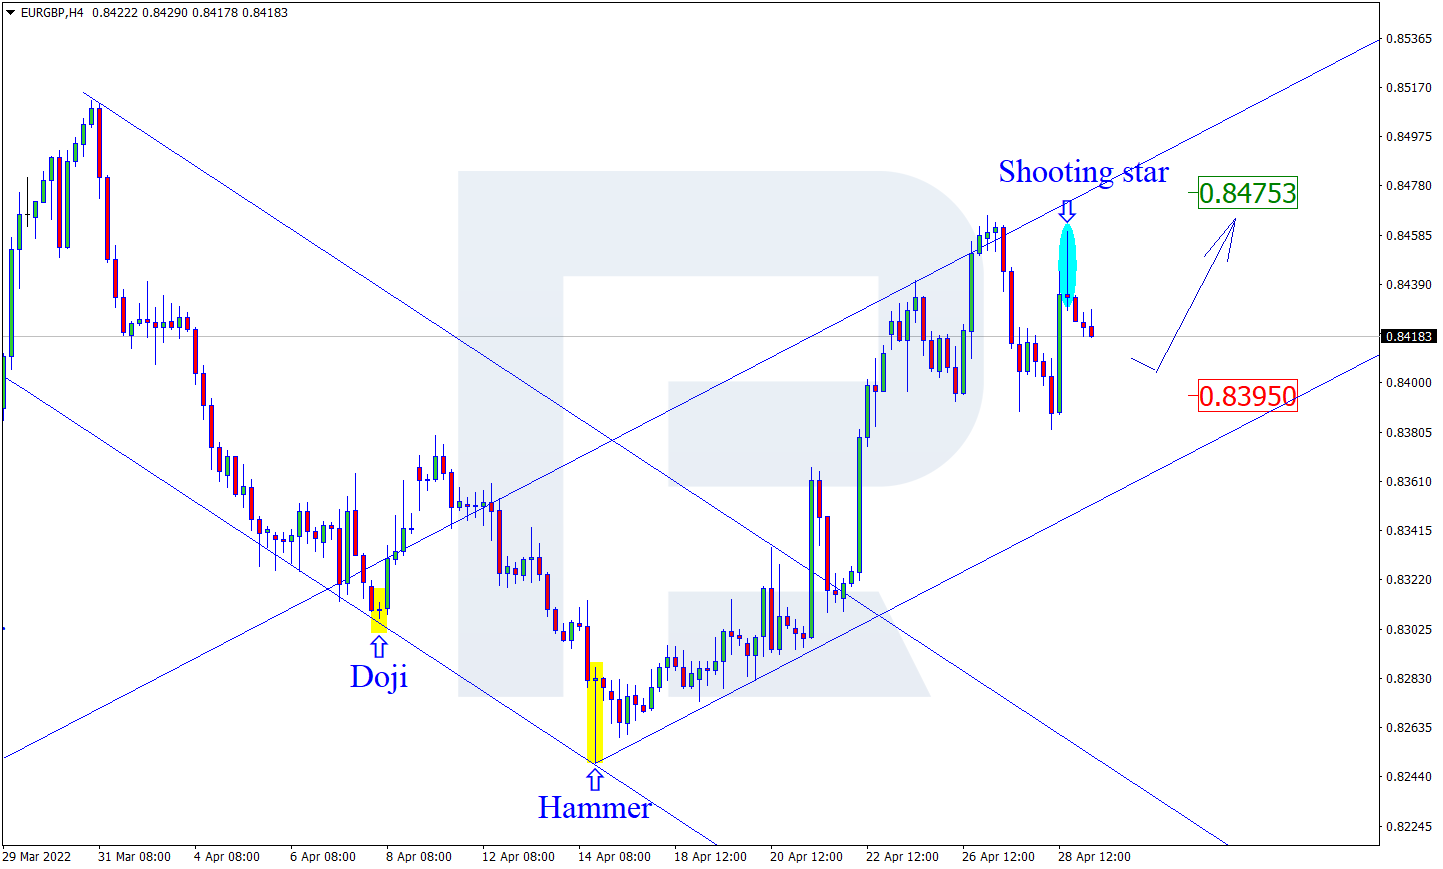
As we can see in the H4 chart, after forming a Shooting Star reversal pattern near the resistance area, EURGBP is reversing and correcting. In this case, the downside correctional target may be at 0.8395. Later, the market may test the support level, rebound from it, and resume the ascending impulse. Still, there might be an alternative scenario, according to which the asset may grow to reach 0.8475 and continue the uptrend without testing the support level.
Attention! Forecasts presented in this section only reflect the author’s private opinion and should not be considered as guidance for trading. RoboForex LP bears no responsibility for trading results based on trading recommendations described in these analytical reviews.
The U.S. economy unexpectedly shrank in the first quarter, according to gross domestic product data released on April 28, 2022. While the reasons were technical and weren’t seen as signs of weakness, they add to worries that the U.S. might be headed for another recession as the Federal Reserve seeks to fight inflation by raising interest rates.
But before we fret too much about what 2022 will bring, I believe, as a financial economist who studies the decisions people and companies make with money and the resulting impacts, it’s worth reflecting on 2021, which saw the strongest economic growth in almost four decades.
GDP, which provides a snapshot of the economy by measuring the total value of all goods and services consumers produce and exchange, surged 5.7% in 2021 after accounting for inflation, the fastest pace since 1984.
So who benefited from all this growth?
Record gains in American net worth
A useful way to assess how economic growth affects individuals is by looking at personal financial wealth. This is measured by net worth, or the difference between what someone owns and owes.
In 2021, the wealthiest 1% of Americans saw their net worth grow $6.7 trillion to about $46 trillion, making up well over a third of the overall gains. Another $6.2 trillion went to the next 9%. Meanwhile, just $1.5 trillion went to the bottom 50%.
But those in the bottom half grew the fastest
The richest may have gotten the most, but the net wealth of the bottom half jumped at the fastest pace.
The bottom 50% saw their wealth grow 64% in 2021. That’s the biggest calendar-year growth of any of these groups since at least 1988, dwarfing the percentage gains of the richest.
While these changes are positive for Americans, both on average and in general, this has not changed the overall distribution of wealth that much.
The bottom half of Americans accounted for 5.5% of the country’s assets before the pandemic and at the end of 2021 owned 5.9%. Though this is the highest level since 2013, it still lags behind levels it saw during the 1990s, when the share rose to nearly 9%.
White people gained most, but still saw share fall
Similar to the income-level story, most of the gains went to white Americans, who saw their net wealth soar $14.5 trillion in 2021 to $119 trillion. Black Americans gained $1.3 trillion, and Hispanics saw growth of $683 billion.
But the percentage gains were highest for people of color – 26% for African Americans and 24% for Hispanics. That compares with 14% for white Americans.
As a result, the overall share held by white people fell to 83.6%, the lowest since at least 1988 and very likely the lowest ever. Black net wealth increased to 4.4% of the pie, the most since 1992. Hispanics held 2.5% of total U.S. net wealth.
For context, non-Hispanic white Americans make up about 60% of the population, versus 13.4% for Black Americans and 18.5% for Hispanic or Latino Americans.
Count me as one economist hoping Americans continue benefiting from improving job prospects to build wealth – even as the economic picture gets a bit cloudier.
The BTC has been successfully recovering for a couple of days but bears struck back. The major cryptocurrency is mostly trading at $39,573.
The key intrigue is the US Fed’s May meeting. Market expectations imply a 50-point rate hike and they are already included in prices. However, after yesterday’s GDP Q1 2022 report, which showed -1.4% q/q after being +6.9% q/q the quarter before, expectations are now less optimistic. The report showed a decline in spending, which is the consequence of the stimulus package closure. People are spending money but there is no guarantee that they could continue doing it for a long time if the economic growth slows down. It means that the Fed might raise the benchmark interest rate but the regulator’s comments are expected to be cautious – it is not certain that the country’s economy is really stable.
NASDAQ and S&P 500 corelate with the BTC, that’s why this data is important for the major cryptocurrency either.
The current technical picture in the BTC shows the sideways channel between $33,500 and $48,500, which was formed early in the year. The closest target for bears remains at $37,000. To start stable growth, bulls must fix above $40,500.
ETH: flat and negative
The ETH is also consolidating – on Friday, the asset is balancing at $2,928. At the same time, the mid-term channel remains valid, and the downside target may be at $2,618 if the market continues to be bearish.
Otherside: prove your identity
The Otherside metaverse is ready to sell the virtual land property “under the hammer” but only to those, who pass the KYS verification. It’s rather unusual: it is believed that in virtual reality it’s possible to avoid revealing one’s true identity. Otherside is a metaverse project that was earlier focused on NFTs. To create its metaverse, Otherside raised $450 million of investments.
Goldman Sachs will study NFTs
Goldman Sachs said it didn’t exclude the possibility of tokenization of real assets. To do this, the company is planning to study the aspects of NFTs in the context of financial instruments. The bank is already working with cryptos: in 2021, Goldman Sachs started offering derivatives on the BTC to its clients, and this March it launched a crypto-based OTC instrument in cooperation with Galaxy Digital.
Attention! Forecasts presented in this section only reflect the author’s private opinion and should not be considered as guidance for trading. RoboForex LP bears no responsibility for trading results based on trading recommendations described in these analytical reviews.
In April, the annual inflation rate in Germany reached a record high of 7.8%. In contrast, Spain’s annual inflation rate fell from 9.8% to 8.4%, indicating that the Spanish economy is not as tied to Russia’s energy resources as the German economy. Several other European countries will report inflation today, and the overall figure for the Eurozone will be published. Analysts expect annual inflation in the Eurozone to be 7.5% (currently 7.4%). If the CPI turns out worse than expected, the euro could rise sharply amid expectations of faster monetary policy tightening by the ECB.
From the technical point of view, the trend on the EUR/USD currency pair on the hourly time frame is bearish. Growth in the dollar index led to the fall of the European currency. The MACD indicator is in the negative zone, selling pressure remains, but the divergence is increasing. Under such market conditions, traders can look for sell deals from the resistance levels of 1.0580 or 1.0633, but only after the additional confirmation. Buy trades can be considered on intraday timeframes from the support level of 1.0453, but only with short targets and confirmation.
Alternative scenario: if the price breaks out through the 1.0770 resistance level and fixes above, the uptrend will likely resume.
News feed for 2022.04.29:
– Eurozone French Consumer Price Index (m/m) at 09:45 (GMT+2);
– Eurozone German GDP (q/q) at 11:00 (GMT+2);
– Eurozone Italian Consumer Price Index (m/m) at 12:0 (GMT+2);
– Eurozone Consumer Price Index (m/m) at 12:00 (GMT+2);
– Eurozone GDP (q/q) at 12:00 (GMT+2);
– US PCE price index (m/m) at 15:30 (GMT+2);
– US Michigan Consumer Sentiment (m/m) at 17:00 (GMT+2).
The GBP/USD currency pair
Technical indicators of the currency pair:
Prev Open: 1.2543
Prev Close: 1.2453
% chg. over the last day: -0.72%
The widening interest rate differential between the US and other countries, the risks of a global recession, and war in Ukraine are strengthening confidence in the dollar. In turn, the UK economy is going into “stagflation” (lower economic growth with high inflation). All of this leads to the fall of the British pound against the dollar.
On the hourly time frame, the GBP/USD currency pair trend is still bearish. The MACD indicator is in the negative zone, selling pressure remains, but the divergence is increasing. The price has reached the daily support level. Under such market conditions, sell trades should be looked for from the resistance level of 1.2670, but with confirmation. For buy deals, traders may consider the level of 1.2438, but only after the appearance of a bullish initiative and with short targets.
Alternative scenario: if the price breaks down through the 1.2863 resistance level and fixes above, the mid-term uptrend will likely be resumed.
There is no news feed for today.
The USD/JPY currency pair
Technical indicators of the currency pair:
Prev Open: 128.41
Prev Close: 130.83
% chg. over the last day: +1.88%
The Japanese yen fell below 130 per dollar for the first time in 20 years as the Bank of Japan doubled its bond-buying rate. On Thursday, the Bank of Japan decided to keep monetary policy unchanged despite a weaker yen and rising inflationary pressures due to higher import costs. This contributes to another round of weakening of the Japanese yen. It’s a bank holiday in Japan today.
Trading recommendations
Support levels: 129.10, 128.51, 127.24, 126.91, 125.48, 124.66, 122.97
Resistance levels: 130.85
The medium-term trend on the USD/JPY currency pair is bullish. The MACD indicator is positive again, and the buying pressure has increased. Under such market conditions, it is best to look for buy deals, expecting the continuation of the uptrend, but only after a pullback, as the price has strongly deviated from the average values. First of all, it is worth considering the support level of 129.10 or 128.51, but with additional confirmation. A resistance level of 130.85 may be considered for sell deals, but only with short targets.
Alternative scenario: If the price fixes below 126.91, the uptrend will likely be broken.
There is no news feed for today.
The USD/CAD currency pair
Technical indicators of the currency pair:
Prev Open: 1.2818
Prev Close: 1.2806
% chg. over the last day: -0.09%
On Thursday, Canada’s most populous province of Ontario projected a steady decline in the deficit in the medium term due to a strong economic recovery and predicted a return to surplus by 2027-2028. This is a good sign for the Canadian currency. But it should be noted that the Canadian dollar is a commodity currency and also strongly dependent on the dynamics of oil prices and the dollar index. The dollar index is rising along with oil prices. As a result, the USD/CAD currency pair is trading without significant changes. Currently, the USD/CAD has no fundamental prerequisites for a medium-term trend as rising oil prices, along with the Bank of Canada’s plans to raise interest rates, will strengthen the Canadian dollar.
Trading recommendations
Support levels: 1.2745, 1.2644, 1.2607, 1.2521
Resistance levels: 1.2852
The USD/CAD currency pair is bullish in terms of technical analysis. The MACD indicator became negative, and the price began to correct to the average values. Trade is worth it only with short targets. Under such market conditions, it is better to look for buy trades on the lower timeframes from the support level of 1.2745 or 1.2644, but it is better with additional confirmation. For sell deals, it is better to consider the resistance level of 1.2852, but it is also better with confirmation and short targets.
Alternative scenario: if the price breaks through and consolidates below 1.2607, the downtrend will likely be resumed.
This article reflects a personal opinion and should not be interpreted as an investment advice, and/or offer, and/or a persistent request for carrying out financial transactions, and/or a guarantee, and/or a forecast of future events.
US GDP in the first quarter fell unexpectedly by 1.4% in the first quarter, marking a sharp slowdown in economic growth. But despite the disappointing numbers, markets paid little attention to the report, with stock and bond yields mostly rising. PayPal stock increased more than 10% after its first-quarter results beat analysts’ forecasts, helped by strong growth in payments volume and net new active accounts. McDonald’s Q1 revenue rose 11%, but net income was down. The wave of positive quarterly corporate results helped offset an unexpected slowdown in US economic growth. At the stock market’s close, the Dow Jones index (US30) gained 1.85%, the S&P 500 index (US500) added 2.47%, and the NASDAQ Technology Index (US100) jumped by 3.06%.
Amazon shares fell 8% after closing due to an unexpected loss in the first quarter and a disappointing earnings outlook for the second quarter. Amazon’s fall was also reflected in declining indices after the stock market’s close.
It is expected that the unforeseen decline in US growth will not affect the Fed’s view, as high inflation will continue to drive policy.
The US House of Representatives finally voted in favor of the lend-lease for Ukraine. Biden must now sign the lend-lease legislation. Specifically, more than $20 billion could go to defense. More than $8 billion is planned for economic support. Another $3 billion will go to humanitarian aid. American analysts believe that the revival of the lend-lease is of great historical significance. In 1941, such an initiative was a decisive factor in allowing the Allies to defeat the Nazis in World War II.
Major European indices traded higher yesterday. German DAX (DE30) gained 1.35%, French CAC 40 (FR 40) added 0.98%, Spanish IBEX 35 (ES35) jumped by 0.41%, British FTSE 100 (UK100) increased by 1.13%. In April, the annual inflation rate in Germany reached a historical record of 7.8%. In Spain, by contrast, the annual inflation rate decreased from 9.8% to 8.4%, indicating that Spain’s economy is less dependent on Russian energy resources than Germany’s. Several other European countries will report on inflation today, and the general figure for the Eurozone will be published. Analysts believe that annual inflation in the Eurozone will reach 7.5% (currently 7.4%).
Germany may consider including Sberbank in the next package of EU sanctions. Lithuania and Spain favor an EU embargo on Russian oil and gas. German representatives are also ready to agree to a ban on oil imports from Russia if Berlin is given enough time to look for alternative suppliers. Against the background of this news, oil prices jumped by more than $2 per barrel. Now the answer is in OPEC+, which will meet on May 5. According to some analysts, prices may become volatile after the OPEC+ meeting. If representatives don’t increase production, oil prices may continue to rise. But on the other hand, the lockdown in China and the release of strategic reserves by the US and its allies are keeping oil prices from flying to the moon.
According to preliminary information, four European gas buyers have already paid for gas supplies in rubles. Ten companies have opened accounts with Gazprombank, enabling them to comply with the new settlement rules. Europe risks gained rationing if Putin cuts off Russian gas supplies. Hence, the EU must urgently look for an alternative and completely abandon Russia’s energy resources to not be dependent on the state that unleashed a full-scale war against Ukraine.
The Central Bank of Turkey has raised its inflation forecast for late 2022 to 42.8% from 23.2%.
Asian markets ended the day higher yesterday. Japan’s Nikkei 225 (JP225) gained 1.75%, Hong Kong’s Hang Seng (HK50) added 1.65%, and Australia’s S&P/ASX 200 (AU200) jumped by 1.32%. South Korea’s Samsung earned record revenue and increased its net profit by 59% in the first quarter. Prolonged blockages over COVID-19 further slow the Chinese economy, which has hit both the yuan and commodity currencies. The yuan fell to an 18-month low and is on track for a record monthly drop of 4.3%. It’s a bank holiday in Japan today.
Main market quotes:
S&P 500 (F) (US500) 4,287.50 +103.54 (+2.47%)
Dow Jones (US30) 33,916.39 +614.46 (+1.85%)
DAX (DE40) 13,979.84 +185.90 (+1.35%)
FTSE 100 (UK100) 7,509.19 +83.58 (+1.13%)
USD Index 103.62 +0.67 (+0.65%)
Important events for today:
– Australia Producer Price Index (m/m) at 04:30 (GMT+2);
– China Caixin Manufacturing PMI (m/m) at 04:45 (GMT+2);
– Switzerland Retail Sales (m/m) at 09:30 (GMT+2);
– Eurozone French Consumer Price Index (m/m) at 09:45 (GMT+2);
– Switzerland SNB Chairman Jordan Speaks at 11:00 (GMT+2);
– Eurozone German GDP (q/q) at 11:00 (GMT+2);
– Eurozone Italian Consumer Price Index (m/m) at 12:00 (GMT+2);
– Eurozone Consumer Price Index (m/m) at 12:00 (GMT+2);
– Eurozone GDP (q/q) at 12:00 (GMT+2);
– Canada GDP (m/m) at 15:30 (GMT+2);
– US PCE price index (m/m) at 15:30 (GMT+2);
– US Michigan Consumer Sentiment (m/m) at 17:00 (GMT+2).
This article reflects a personal opinion and should not be interpreted as an investment advice, and/or offer, and/or a persistent request for carrying out financial transactions, and/or a guarantee, and/or a forecast of future events.
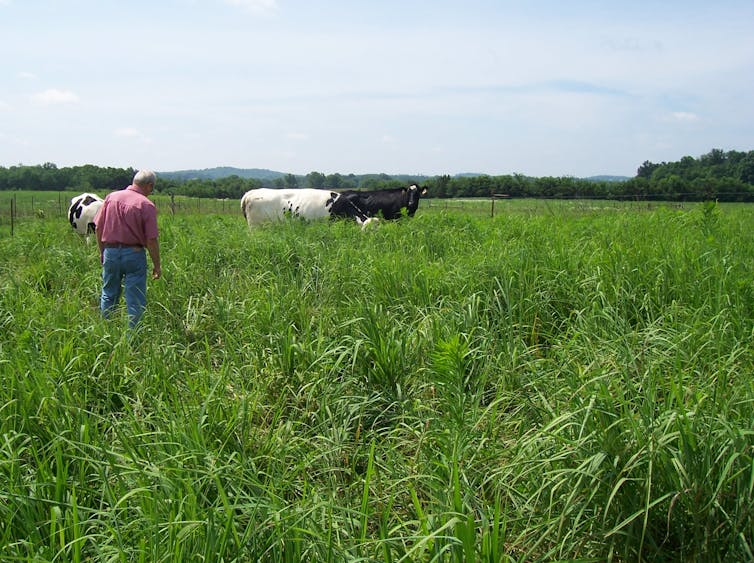
Native grasses, long overlooked, have been shown to benefit cattle and diverse native animals. Patrick Keyser, CC BY-ND
Early on a cool June morning, heavy dew lies on the grass of rolling farm country somewhere in Tennessee, or Missouri, or Pennsylvania. Small patches of fog hang in low lying pockets of these fields. In the distance, hardworking farmers are starting their day. Farm equipment clangs, tractors roar to life and voices lining out the day’s work drift on the air.
This pastoral scene is repeated thousands of times each morning across rural America. But something is missing: the exuberant “Bob bob white!” call of the bobwhite quail that for generations was the soundtrack to summer mornings. Once abundant across the eastern U.S., bobwhite populations have declined by 85%. Calculations suggest that the remaining population could be cut in half within the next decade.
Why is this happening? In a word, habitat. Native grasslands in the U.S., especially those east of the Great Plains, which once covered millions of acres, have almost completely disappeared. Some have been converted to croplands. Others have been allowed to grow back up into forests, where shade from the tree canopy prevents the growth of these grasses.
Still others have been planted with grasses that are native to Europe, Africa or Asia. These introduced grasses tend to be shorter than our tall, native species and grow in dense, solid mats that cover the ground. Native species, on the other hand, are bunchgrasses: They grow in clumps, with spaces between plants that benefit many of these nesting birds, especially the bobwhite.
A bobwhite quail nest nestles in a bunch of switchgrass, a native grass species also valuable for cattle forage. David Peters, CC BY-ND
Native grasses for birds, and cattle
One solution to these declines draws on the concept of working lands conservation – making agricultural lands productive not only for cattle, but also for declining species such as grassland birds. One compelling opportunity for such an approach is using some of the native grasses that have been lost from the eastern U.S. to provide pasture for cattle. Reintroducing these grasses to farms could benefit cattle farmers as well as birds. My new book, ““Native Grass Forages for the Eastern U.S.,” explains why and how these grasses can fit into working farms.
I have combined my research on native grasses over the past 15 years at the University of Tennessee Institute of Agriculture with the work of many other scientists that has accumulated over the past 100 years. Collectively, this research suggests that native grasses can not only be brought back but can play a strategic role on our farms today.
In the face of these stresses, I see native grasses like big bluestem as a promising solution. These grasses, which have grown in North America for millennia, are naturally well adapted to the eastern U.S., and I believe they can once again benefit family farms.
Patrick Keyser interviews Brad Black of Color Wheel Farm in Monroe County, Tennessee, on his experience planting a native grass, switchgrass.
As I show in my book, these grasses have roots that can extend as much as 8 to 10 feet deep into the soil. They are remarkably drought tolerant and can grow and thrive in soils with low fertility and high acidity.
Their large root systems also help to increase the organic matter in soils, which makes the soil healthier and more productive. Building up organic matter, which consists mostly of carbon, stores carbon in the soil rather than the atmosphere.
But what about the cattle? Numerous studies show that forage yields are high for these species. Cattle readily consume them, and this diet produces strong gains on the growing animals. This combination of high yields, strong gains and low input requirements means that these forages can be produced profitably.
In that same study, we monitored the nesting success of two at-risk species associated with eastern pastures: grasshopper sparrows and field sparrows. We found that compared to pastures growing a nonnative grass species called tall fescue, the native grass pastures produced between two and six times more fledgling birds per acre. This is the outcome that working lands conservation seeks to deliver: more beef and more birds, all at a fair price.
Scientists track the movements of this male bobwhite quail, here about to be released into the wild, through a radio transmitter covered by a tuft of feathers beneath the bird’s chin. Ross Ketron, CC BY-ND
Making the switch
The biggest challenge of cultivating native grasses is getting the grasses established. Converting existing pastures to native grasses requires completely renovating the fields, and lots of patience as the native grass seedlings develop. These species are slow starters.
Once they get a good root system under them, they can grow quite rapidly, but until then they are vulnerable to weed pressure. And converting fields is not cheap, due particularly to seed costs. However, farmers can receive financial support for planting native grasses from the U.S. Department of Agriculture’s Natural Resources Conservation Service.
As the world’s population grows, it will be a struggle to produce enough nutrient-dense proteins to feed everyone. Grasslands can produce high-quality dietary protein cost-effectively, while also reducing atmospheric carbon and supporting North American grassland birds and other wild species.
As King Solomon said long ago, there is nothing new under the sun. Native grasses are not new, but today I see them as a modern solution to some of our planet’s most pressing challenges.
Here’s what happened after the S&P 500 had its first negative earnings quarter ever
By Elliott Wave International
Financial journalists almost always mention “reasons” for a given day’s market action.
For example, on April 22, an intraday Marketwatch headline gave two reasons for that day’s plummeting prices:
Why is the stock market falling? Dow drops over 500 points as investors weigh Fed’s policy path, earnings
Prices fell considerably further on April 22 after that headline published, however, the question is: Are the Fed and earnings the real reasons the stock market cratered?
Elliott Wave International’s extensive research reveals that the answer is likely “no.” The evidence is overwhelming that news — whether positive or negative — does not determine the market’s trend. (Besides, on any given day, the news is usually a mixed bag anyway. You can always find a bullish or bearish “reason” for stocks to go up or down. Mainstream market observers simply pick from that bag what fits the day’s price action.)
As cases in point, let’s review the Fed and earnings as supposed “causes” of stock market action, given these two factors were mentioned in that headline.
Let’s start with the Fed and a bit of history. The chart is from the March 2019 Elliott Wave Financial Forecast, a monthly publication which provides analysis of major U.S. financial markets. It shows the lack of correlation between Fed behavior and the stock market:
The Fed cut interest rates 13 times from 2000-2003, yet the S&P 500 still declined 51%. Again in 2007-2008, the Fed cut rates 10 times, but the S&P declined 58% from August 2007 to March 2009. Subsequent to that, 9 Fed rate increases starting in 2015 didn’t stop the stock market from rallying. Simply put: The Fed does not control the trend of the stock market.
Regarding earnings, this chart is from the Dec. 2009 Elliott Wave Financial Forecast:
You’ll notice on the chart that in Q4 2008, the S&P 500 had its first negative earnings quarter ever. According to conventional logic, stocks should have crashed afterwards. Instead, a rally started in March 2009, which stretched all the way into early 2022.
So, you see why Elliott Wave International’s analysts do not look to the Fed, earnings — or any other factor outside of the market when formulating a stock market forecast.
Instead, they look to the market itself — which unfolds in repetitive price patterns, in accordance with the Elliott wave model.
Indeed, the April Elliott Wave Financial Forecast provided this warning to subscribers:
Patterns in the indexes are at junctures where they should resume the decline from the November and January highs.
The Elliott wave model does not promise perfect forecasts, yet, in our view, it does reflect how financial markets really work.
Here’s a quote from Frost & Prechter’s Wall Street classic, Elliott Wave Principle: Key to Market Behavior:
In the 1930s, Ralph Nelson Elliott discovered that stock market prices trend and reverse in recognizable patterns. The patterns he discerned are repetitive in form but not necessarily in time or amplitude. Elliott isolated five such patterns, or “waves,” that recur in market price data. He named, defined and illustrated these patterns and their variations. He then described how they link together to form larger versions of themselves, how they in turn link to form the same patterns of the next larger size, and so on, producing a structured progression. He called this phenomenon The Wave Principle.
You can learn the details of The Wave Principle by reading the online version of the book for free.
All that’s required for free access is a Club EWI membership. Club EWI is the world’s largest Elliott wave educational community and is free to join. Plus, members enjoy complimentary access to a wealth of Elliott wave resources on investing and trading without any obligation.
This article was syndicated by Elliott Wave International and was originally published under the headline “Why Is the Stock Market Falling?” — (Not Because of These Reasons). EWI is the world’s largest market forecasting firm. Its staff of full-time analysts led by Chartered Market Technician Robert Prechter provides 24-hour-a-day market analysis to institutional and private investors around the world.
EURUSD hit another bottom – and it didn’t surprise anybody.
The major currency pair reached new lows – the last time the asset was moving there was in March 2017. The current quote for the instrument is 1.0541.
The USD rally doesn’t stop. The nearer the date of the Fed’s May meeting and the GDP release, the more dramatic the situation.
The Trade Balance report published by the US yesterday showed $-125.32B in March after being $ 106.35B the month before. Goods cover 75% of the total Trade Balance, so the deficit is not a good signal.
However, market players do not pay much attention to the statistics and continue choosing the USD. They tend to escape risks due to the Chinese lockdown and the overall geopolitical escalation. Moreover, investors are looking forward to the US Fed’s meeting that is scheduled for the next week. The American regulator announced a quick and aggressive rate hike to take control over inflation on several occasions, and it’s a good signal in favour of the “greenback”.
Later today, market players will turn their attention to the GDP Q1 2022 report, which is expected to show 1.1% q/q/ which is much worse than the quarter before, when the indicator gained 6.9% q/q. The better the numbers, the stronger the rally in the USD.
Attention! Forecasts presented in this section only reflect the author’s private opinion and should not be considered as guidance for trading. RoboForex LP bears no responsibility for trading results based on trading recommendations described in these analytical reviews.
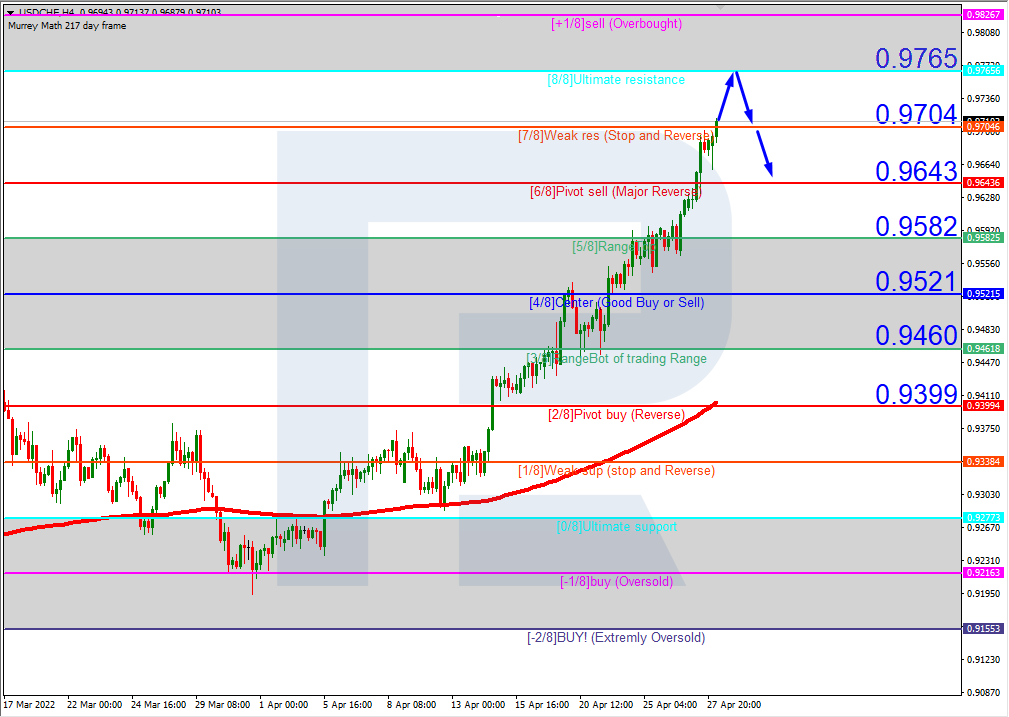
As we can see in the H4 chart, USDCHF is approaching the “overbought area”. In this case, the price is expected to test 8/8, rebound from it, and then resume falling to reach the support at 6/8. However, this scenario may be cancelled if the price breaks the resistance at 8/8 to the upside. After that, the instrument may reverse and grow towards +1/8.
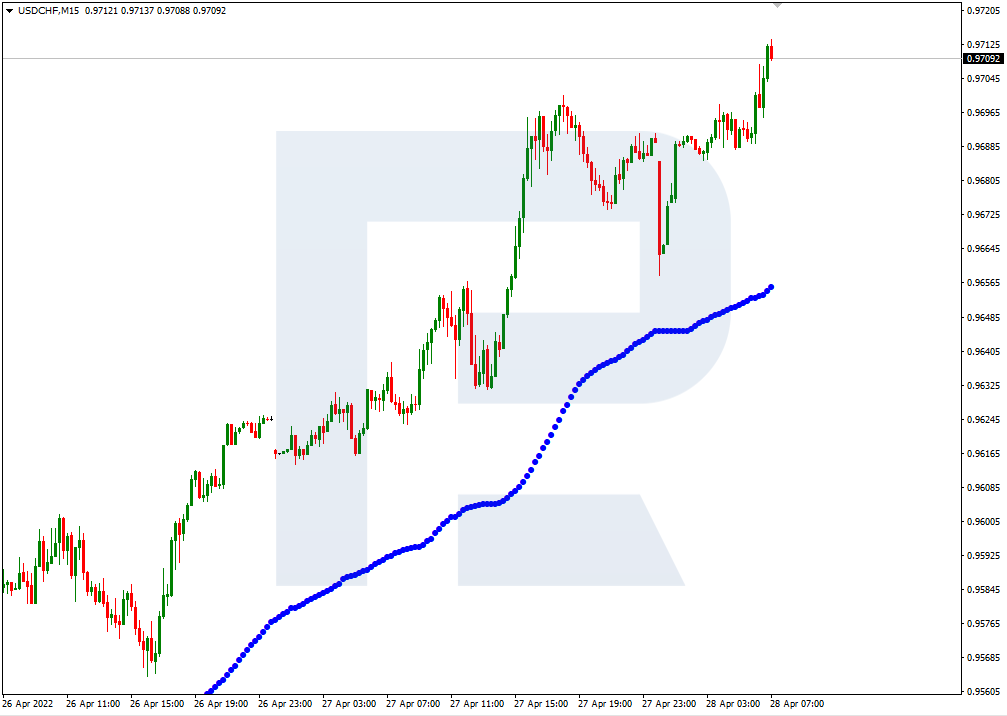
In the M15 chart, the pair may break the downside line of the VoltyChannel indicator and, as a result, continue its decline to reach 8/8 from the H4 chart.
XAUUSD, “Gold vs US Dollar”
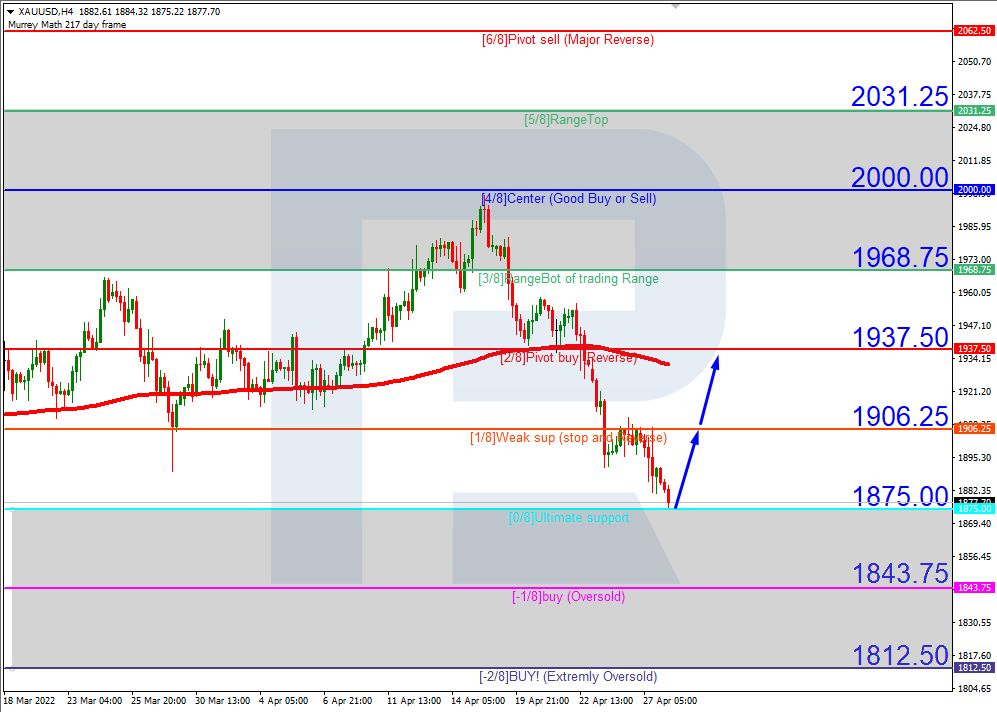
In the H4 chart, XAUUSD has reached the “oversold area”. In this case, the price is expected to rebound from 0/8 and resume moving upwards to reach the resistance at 2/8. However, this scenario may no longer be valid if the price breaks the support at 0/8 to the downside. After that, the instrument may reverse and correct down to -1/8.
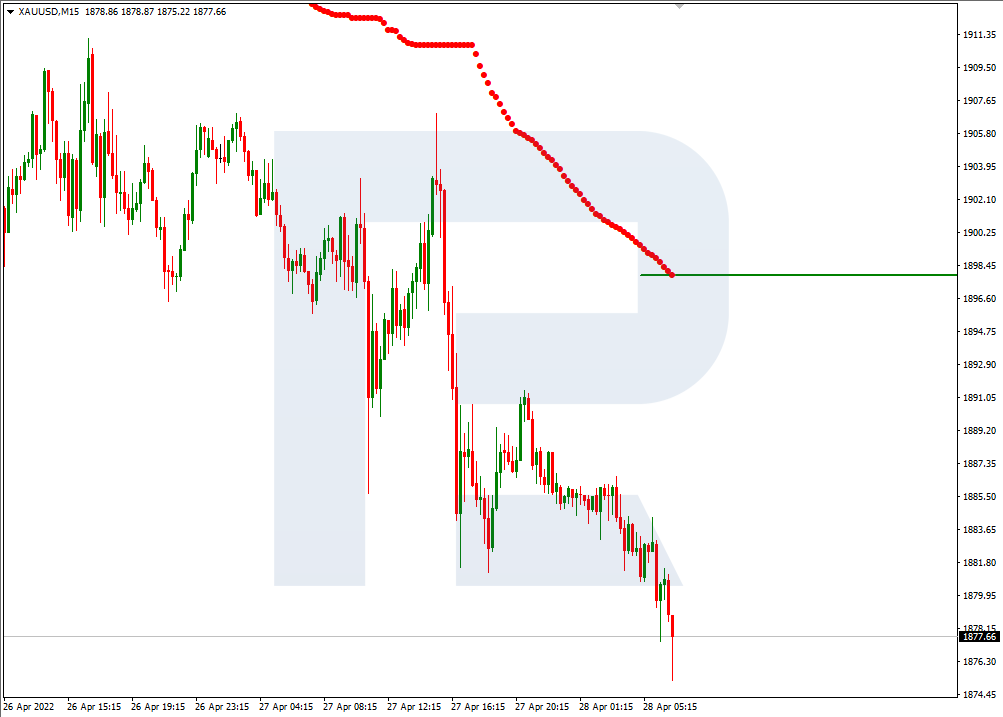
As we can see in the M15 chart, the upside line of the VoltyChannel indicator is pretty far away from the price, that’s why the pair may resume trading upwards only after rebounding from 0/8 in the H4 chart.
Attention! Forecasts presented in this section only reflect the author’s private opinion and should not be considered as guidance for trading. RoboForex LP bears no responsibility for trading results based on trading recommendations described in these analytical reviews.
– Bitcoin will be adopted as legal tender in at least one more African and one Central or Latin American country in 2022, predicts the CEO and founder of one of the world’s largest independent financial advisory, asset management and fintech organisations.
The prediction from Nigel Green of deVere Group comes as the Central African Republic (CAR) on Wednesday adopted Bitcoin as an official currency, becoming the first country in Africa and only the second in the world to do so.
A bill governing the use of cryptocurrency was adopted unanimously by parliament last week, said a statement signed by Obed Namsio, chief of staff of President Faustin-Archange Touadera.
Speaking to Reuters, he said: “The president supports this bill because it will improve the conditions of Central African citizens. He added: “It’s a decisive step toward opening up new opportunities for our country.”
The CAR is one of six central African countries that share the CFA franc – a regional currency that is backed by France and pegged to the euro.
Last year, El Salvador became the first country in the world to adopt Bitcoin as legal tender, alongside the U.S. dollar.
Nigel Green comments: “We can expect an increasing number of countries to follow the example of El Salvador and now the Central African Republic and adopt Bitcoin as legal tender.
“In January I predicted that at least another three nations, besides El Salvador, would declare the world’s largest cryptocurrency legal tender in 2022. One now already has done so.
“I’m doubling down on this prediction. There’s a real sense that momentum is picking up.
“I expect Bitcoin will be adopted as legal tender in at least one more African and one Central or Latin American country before the end of the year.”
He continues: “In Africa, we believe Tanzania could be one of those countries. Its central bank said last year it was working on a presidential directive to prepare for cryptocurrencies.
“In Latin and Central America, it could potentially be Paraguay or Mexico next.
“A Paraguayan bill moving to regulate the trading and mining of Bitcoin and cryptocurrencies in the country passed the Senate in December, which is widely being regarded as the first step to making Bitcoin legal tender.
“Meanwhile I’m confident that a Bitcoin bill will be introduced to Mexico’s Congress this year. Indira Kempis – a high-profile Mexican senator – amongst others, are going on record as saying they want their country to follow El Salvador’s example.”
Low-income countries have long suffered because their currencies are weak and extremely vulnerable to market changes and that triggers rampant inflation.
This is why most developing countries become reliant upon major ‘first-world’ currencies, such as the U.S. dollar, to complete transactions.
However, reliance on another country’s currency also comes with its own set of, often very costly, problems. A stronger U.S. dollar or euro, for example, will weigh on emerging-market economic prospects, since developing countries have taken on so much dollar and euro-denominated debt in the past decades.”
The deVere boss goes on to add: “Adopting cryptocurrency currently is more attractive to those countries with a track record of financial instability. By adopting cryptocurrency as legal tender these countries then immediately have a currency that isn’t influenced by market conditions within their own economy, nor directly from just one other country’s economy.”
The deVere CEO concludes: “In nations where the current national currencies don’t work as well as they should as a means of exchange, store of value and as a unit of account; where there is unpredictable inflation and an inefficient, out-dated and costly financial system; and where GDP is reliant upon remittances from overseas, Bitcoin is increasingly seen as the answer.
“First, El Salvador, now the Central African Republic – and this is just the beginning. The pace of national adoption is now going to pick up on a global level.”
About:
deVere Group is one of the world’s largest independent advisors of specialist global financial solutions to international, local mass affluent, and high-net-worth clients. It has a network of more than 70 offices across the world, over 80,000 clients and $12bn under advisement.









 Native grasses, long overlooked, have been shown to benefit cattle and diverse native animals.