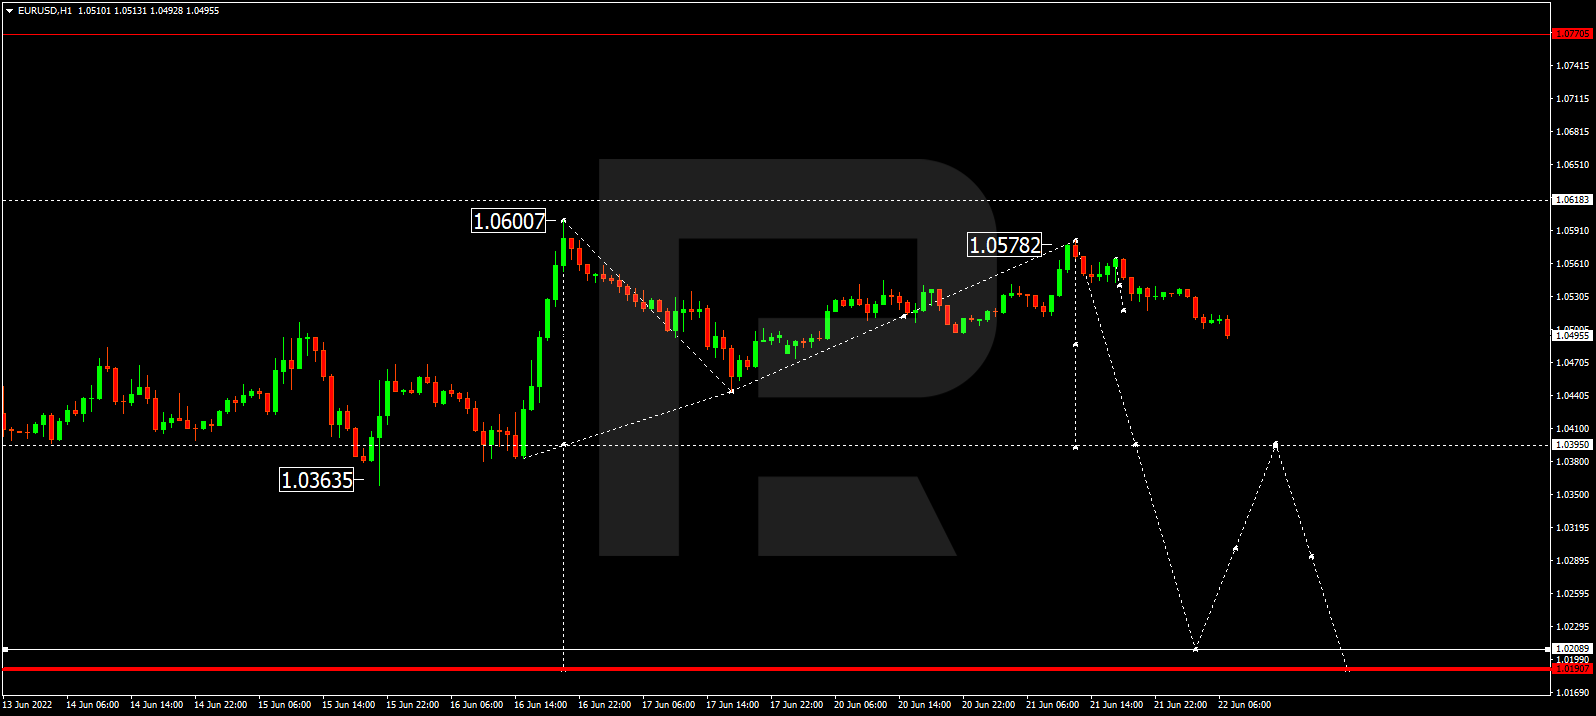
After completing the correction at 1.0577, EURUSD is forming a new descending structure to break 1.0395 and may later continue falling with the target at 1.0210.
GBPUSD, “Great Britain Pound vs US Dollar”
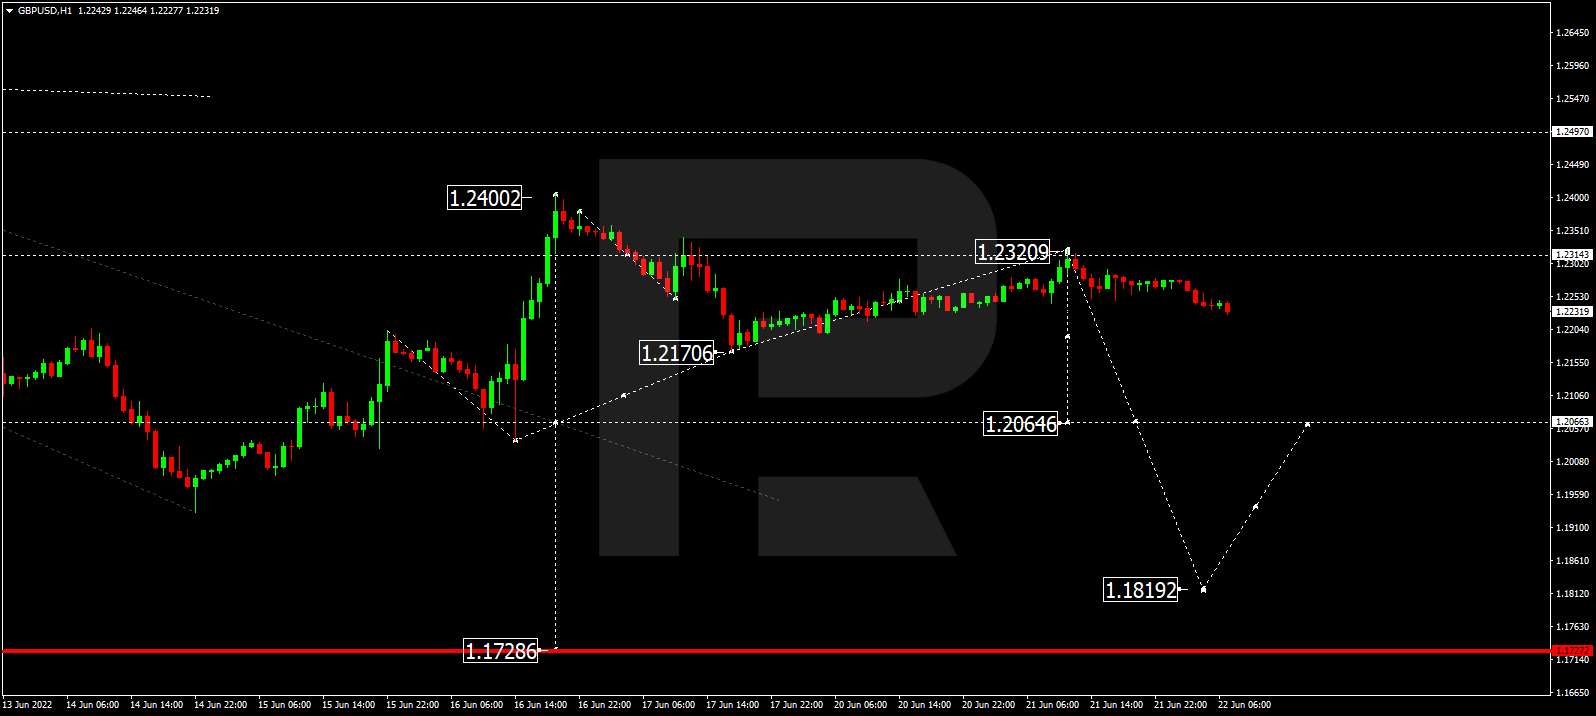
GBPUSD has finished the correctional wave at 1.2320; right now, it is trading downwards to break 1.2065 and may later continue falling with the target at 1.1819.
USDJPY, “US Dollar vs Japanese Yen”
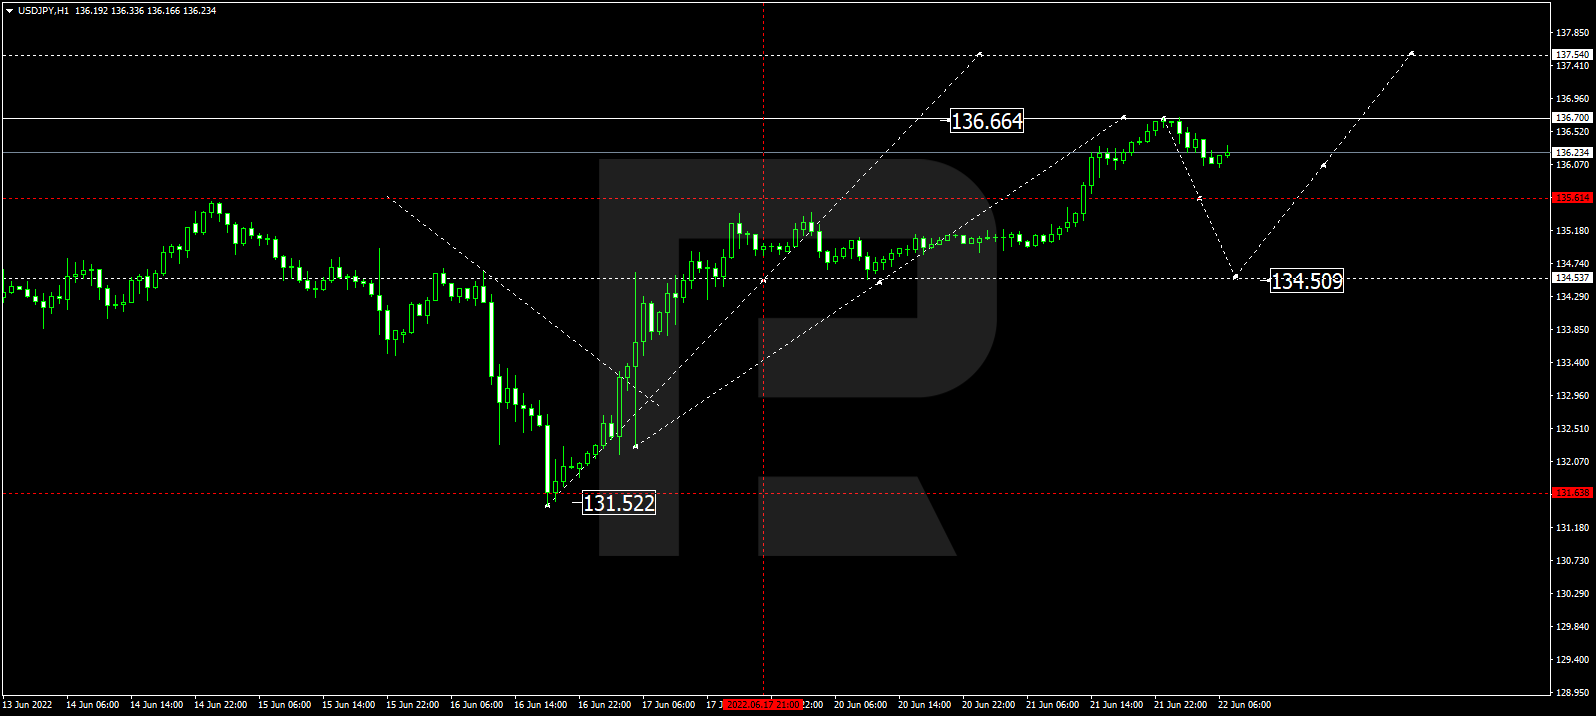
USDJPY has completed the ascending wave at 136.66; right now, it is forming a new descending structure towards 134.50. After that, the instrument may resume trading upwards with the target at 137.50.
USDCHF, “US Dollar vs Swiss Franc”
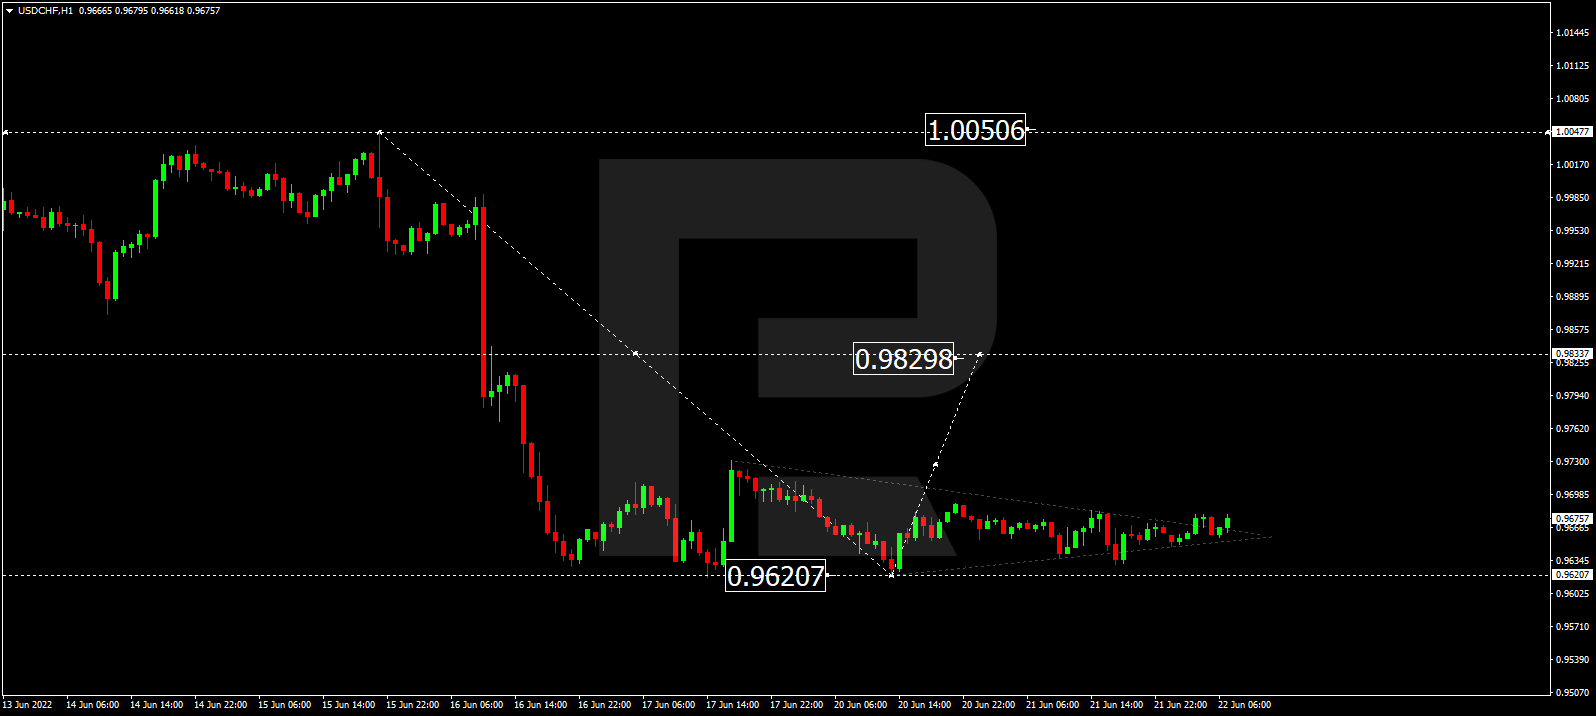
USDCHF is still consolidating around 0.9666 without any specific direction. Possibly, today the pair may break the range to the upside and resume trading upwards to break 0.9833. After that, the instrument may continue growing with the target at 1.0045.
AUDUSD, “Australian Dollar vs US Dollar”
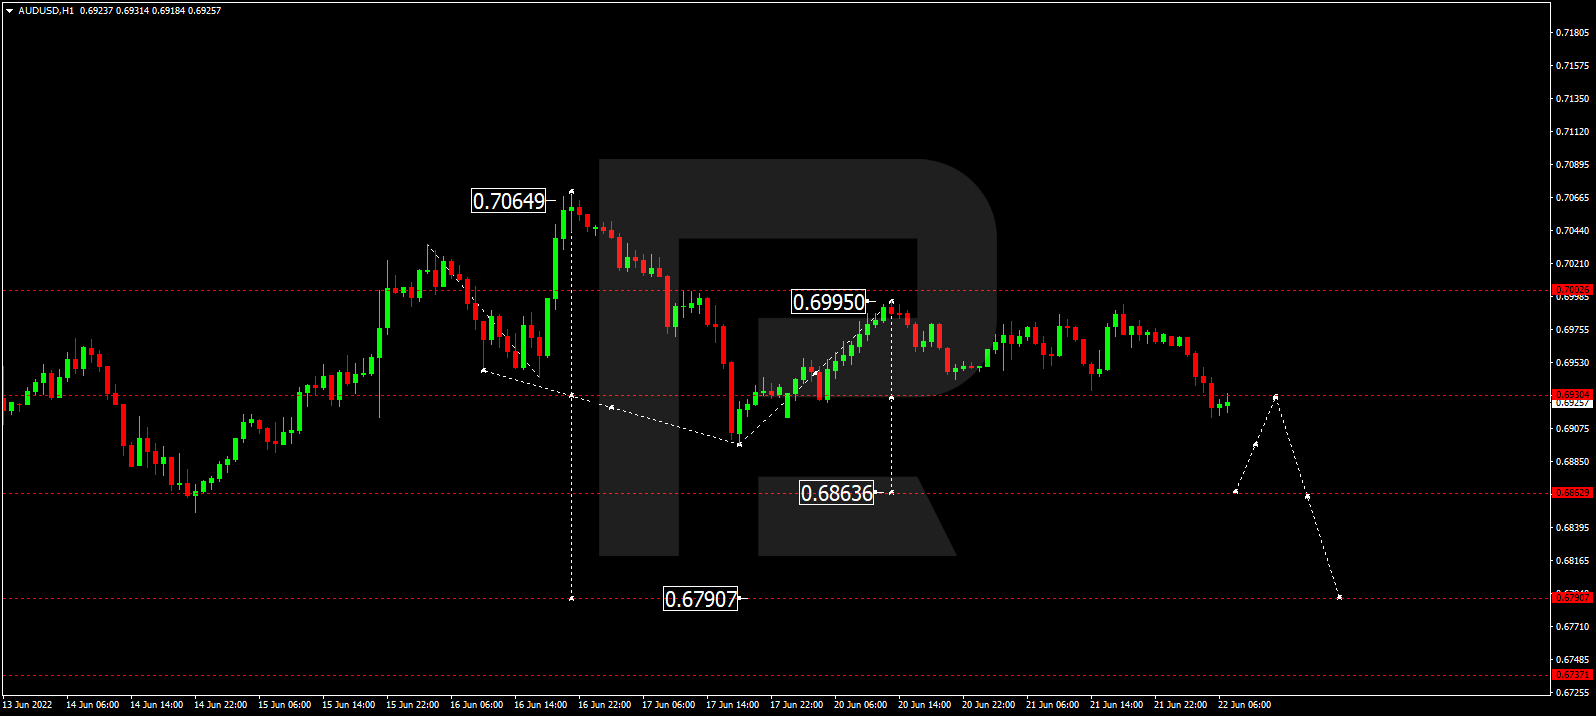
After completing the correction at 0.6996, AUDUSD is forming a new descending structure to break 0.6862. Later, the market may continue trading downwards with the target at 0.6790.
BRENT
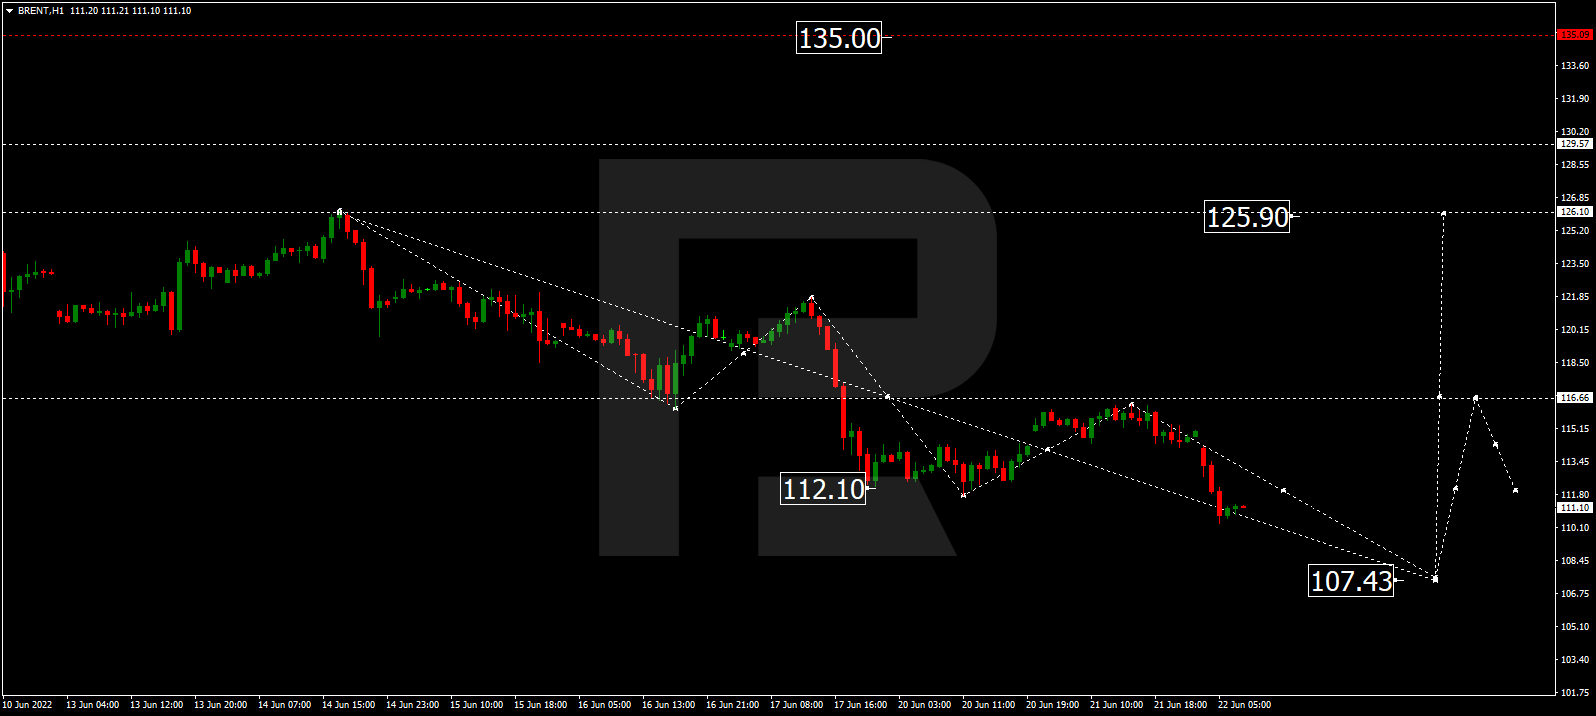
Having broken 112.00 to the downside, Brent is expected to continue the correction down to 107.44 and may later start another growth break 116.66. After that, the instrument may continue trading upwards with the target at 126.00.
XAUUSD, “Gold vs US Dollar”
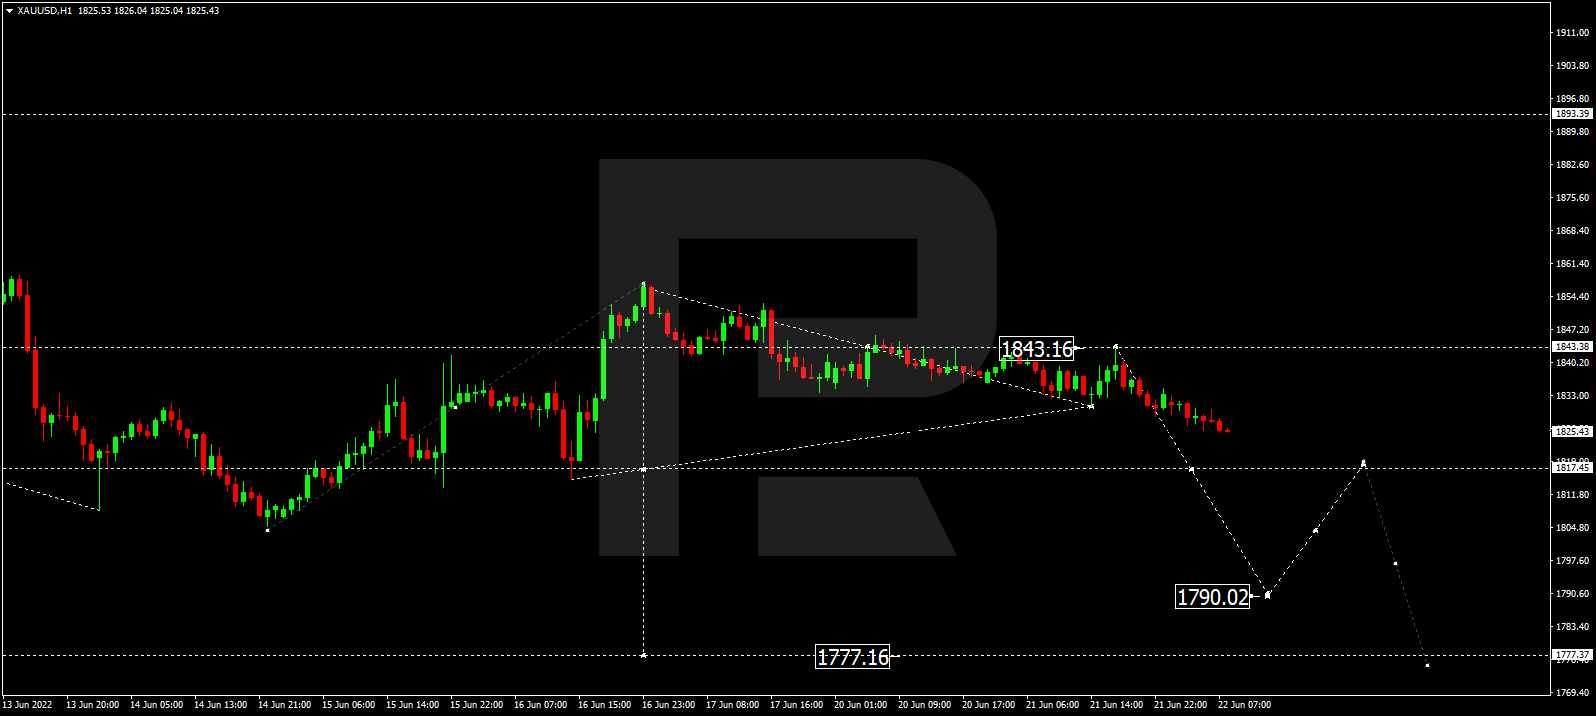
Gold has finished the correction at 1843.15; right now, it is forming a new descending structure towards 1817.50. After that, the instrument may break the latter level and continue falling with the target at 1790.00.
S&P 500
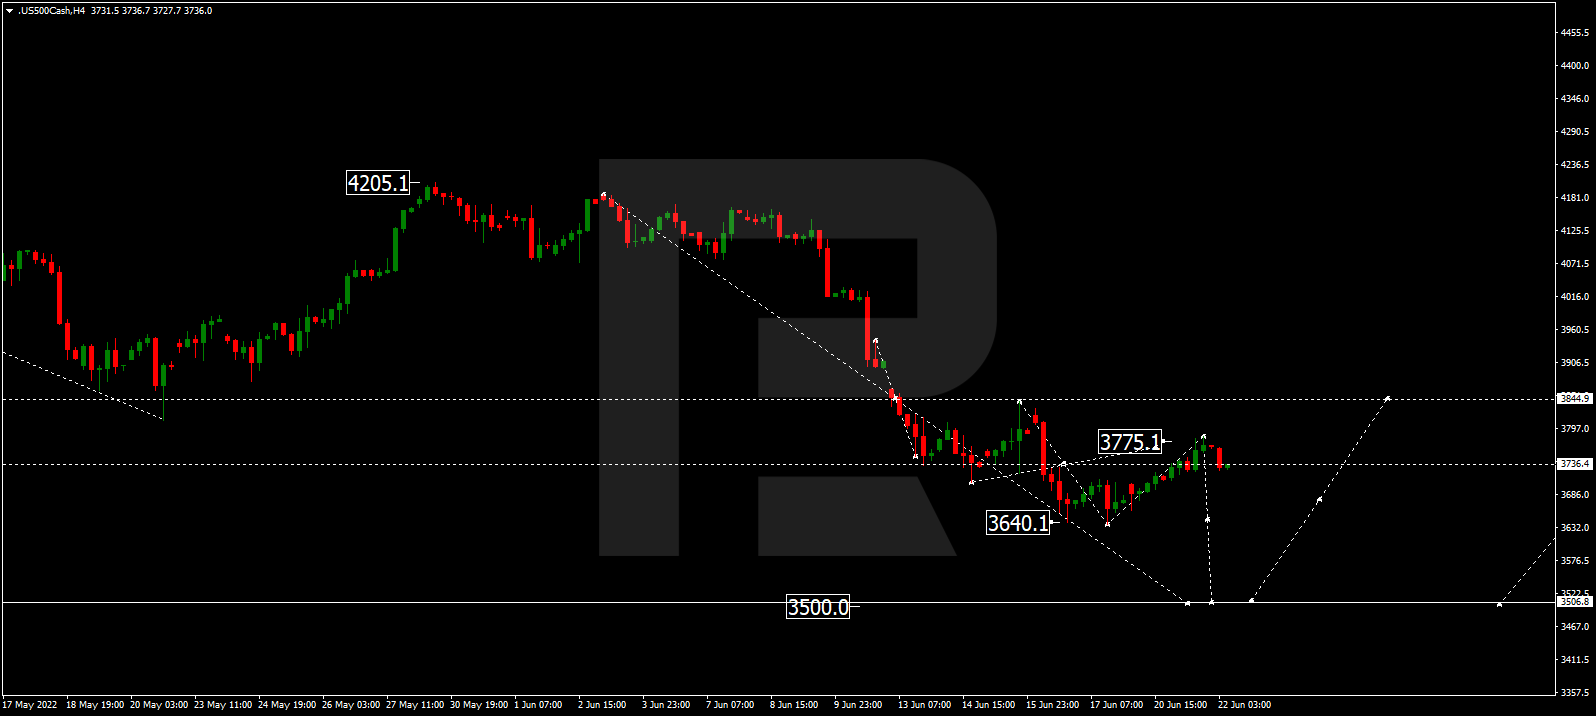
The S&P index has completed the correction at 3775.0; right now, it is falling to break 3640.0 and may later continue trading downwards with the target at 3500.0.
Attention! Forecasts presented in this section only reflect the author’s private opinion and should not be considered as guidance for trading. RoboForex LP bears no responsibility for trading results based on trading recommendations described in these analytical reviews.
The European currency increased yesterday after European Central Bank Chief Economist Philip Lane confirmed that the ECB would raise interest rates by 25 basis points at its July meeting. Still, the size of its September hike has yet to be determined, suggesting that a larger increase of 50 basis points is also a realistic option.
Trading recommendations
Support levels: 1.0499, 1.0408, 1.0379
Resistance levels: 1.0611, 1.0680, 1.0723
From the technical point of view, the trend on the EUR/USD currency pair on the hourly time frame is bearish. The price has corrected to the average values, the MACD indicator has become inactive, and a sideways trend is forming. Under such market conditions, sell deals can be considered from the resistance level of 1.0611, but only after the additional confirmation. A price move above 1.0611 will change the priority. Buy trades are best to look for on intraday time frames from the support level of 1.0499, but only with confirmation and short targets.
Alternative scenario: if the price breaks out through the 1.0611 resistance level and fixes above, the uptrend will likely resume.
News feed for 2022.06.22:
– US Fed Chair Powell Testifies at 16:30 (GMT+3).
The GBP/USD currency pair
Technical indicators of the currency pair:
Prev Open: 1.2245
Prev Close: 1.2279
% chg. over the last day: +0.28%
On Tuesday, Bank of England Chief Economist Hugh Pill said that the central bank would soon need to raise interest rates to deal with rising inflation.New inflation data will be released in the UK today. Economists forecast that the consumer price index will reach an annualized rate of 9.1% (the current value is 9.0%). If the data is worse than expected, the British pound may gain further momentum amid expectations of more aggressive action by the Bank of England to suppress inflation.
Trading recommendations
Support levels: 1.2176, 1.2093, 1.1974
Resistance levels: 1.2422, 1.2470, 1.2523, 1.2629
From the technical point of view, the trend on the GBP/USD currency pair on the hourly time frame is bearish. The price has corrected to the average values, the MACD indicator has become inactive, and a sideways trend is forming. Under such market conditions, sell deals can be considered from the resistance level of 1.2422, but only after the additional confirmation. Buy trades are best to look for on intraday time frames from the support level of 1.2176, but only with confirmation and short targets.
Alternative scenario: if the price breaks out through the 1.2422 resistance level and fixes above, the uptrend will likely resume.
News feed for 2022.06.22:
– UK Consumer Price Index (m/m) at 09:00 (GMT+3);
– UK Producer Price Index (m/m) at 09:00 (GMT+3).
The USD/JPY currency pair
Technical indicators of the currency pair:
Prev Open: 135.00
Prev Close: 136.65
% chg. over the last day: +1.22%
On Tuesday, the Japanese yen fell against the US dollar to its lowest level since October 1998, as the ultra-soft monetary policy of the Bank of Japan stands in stark contrast to the aggressive Federal Reserve. The meeting between Japan’s central bank governor Kuroda and Prime Minister Kishida did not result in any action to strengthen the yen.
Trading recommendations
Support levels: 135.54, 133.35, 131.67, 131.00, 130.12, 129.48, 128.76
Resistance levels: 136.66
The medium-term trend on the USD/JPY currency pair is bullish. The price continues to rise steadily. It is best to wait for a slight pullback to join the trend. Under such market conditions, buy trades can be considered from the support level of 135.54, but with confirmation. A resistance level of 136.66 is good for sell deals, but only with additional confirmation in the form of a reverse initiative and short targets.
Alternative scenario: If the price fixes below 133.35, the downtrend will likely resume.
There is no news feed for today.
The USD/CAD currency pair
Technical indicators of the currency pair:
Prev Open: 1.2980
Prev Close: 1.2917
% chg. over the last day: +0.49%
Retail sales rose 0.9% to $60.7 billion in April. Sales increased in 6 of 11 subsectors. This is a sign that the Canadian economy is in good shape and shows no signs of slowing down, unlike the US figures. Canada will also release consumer price data today. Economists are predicting inflation to rise another 1%, to 7.78% in annual terms. The current inflation rate is 6.78%. It should be noted that Canada’s central bank is on its way to tightening interest rates. Therefore, a sharp rise in inflation figures may give confidence to the Canadian dollar on the back of more aggressive monetary policy tightening.
Trading recommendations
Support levels: 1.2925, 1.2815, 1.2709, 1.2618, 1.2578, 1.2510
Resistance levels: 1.2974, 1.3068
In terms of technical analysis, the trend on the USD/CAD currency pair is bullish. The MACD indicator has become inactive,and the price has corrected to its average values but has broken through the downtrend line. Under such market conditions, it is better to look for buy deals in the lower time frames from the support level of 1.2925. For sell deals, it is better to consider the resistance level of 1.2974, but it is also better with confirmation and short targets.
Alternative scenario: if the price breaks through and consolidates below the 1.2815 support level, the downtrend will likely resume.
News feed for 2022.06.22:
– Canada Consumer Price Index (m/m) at 15:30 (GMT+3).
This article reflects a personal opinion and should not be interpreted as an investment advice, and/or offer, and/or a persistent request for carrying out financial transactions, and/or a guarantee, and/or a forecast of future events.
At the close of the stock market yesterday, the Dow Jones Index (US30) increased by 2.15% and the S&P 500 Index (US500) added 2.45%. The NASDAQ technology index (US100) jumped by 2.51% on Tuesday. All 3 indices closed the day in the plus.
US Fed member Barkin said yesterday he supported a 75bp interest rate hike at the June meeting. Barkin also pointed out that US inflation is broad-based, and it is important to get back to the 2% target as soon as possible. Barkin will likely support another 0.75% rate hike at the next meeting. The US Federal Reserve Chairman Jerome Powell will be addressing Congress tonight, where investors will be looking for additional clues as to whether another 75 basis point rate hike is expected at the Fed’s July meeting. If Powell is hawkish tonight, investors could see another jump in the US dollar as government bond yields rise again. This will push gold down.
According to the National Association of Realtors, sales of existing homes in the US fell by 3.4% in May to a seasonally adjusted annual rate of 5.41 million units. That’s the weakest reading since June 2020, which was in the early months of the Covid pandemic. “I expect home sales to decline further,” said Lawrence Yun, Chief Economist at the National Association of Realtors.
Since about 25% of Americans keep their savings in real estate, declining home sales point to signs of a recession. However, White House spokeswoman Karine Jean-Pierre pointed out yesterday: “We’re not seeing a recession right now. We’re not in a recession right now. We are now in a transition period where we are moving to the point of stable and sustainable growth.” According to the Deutsche Bank CEO, the probability of a recession in Europe and the US is quite high in 2023.
Removing tariffs on Chinese imports would eventually lower US inflation by 1% and restore confidence in the economy, which could help President Joe Biden in the election, according to former US Ambassador David Adelman.
Stock markets in Europe mostly traded higher yesterday. German DAX (DE30) gained 0.20%, French CAC 40 (FR40) added 0.75%, Spanish IBEX 35 (ES35) lost 0.61%, and British FTSE 100 (UK100) was up 0.42%.
Fitch Ratings notes that the ECB’s planned “anti-fragmentation” program may reduce the risk that sharp fluctuations in the cost of sovereign borrowing will adversely affect the debt dynamics of the Eurozone’s sovereign countries with high levels of debt. This will support the creditworthiness of these sovereigns. European Central Bank Chief Economist Philip Lane confirmed yesterday that the ECB would raise interest rates by 25 basis points at its July meeting. Still, the size of its September hike will depend on new economic data.
Oil continues to rise in price amid strong demand and tight supply. A preliminary Reuters poll showed that oil inventories are likely to show another decline. UBS analyst Giovanni Staunovo said that despite concerns about economic growth, the data still showed firm demand for oil. “We expect oil demand to improve further due to the China’s opening, summer travel, and warmer weather in the Middle East. As supply growth lags behind demand growth in the coming months, we still expect oil prices to rise,” he said.
Actual supply cuts from Russia are pushing up natural gas prices, as supplies through the key Nord Stream pipeline have fallen to about 40% capacity. Underlying European gas futures jumped by 4% from Friday.
Asian markets closed yesterday on the plus side. Japan’s Nikkei 225 (JP225) gained 1.84%, Hong Kong’s Hang Seng (HK50) added 1.87%, and Australia’s S&P/ASX 200 (AU200) closed 1.41% higher. The Japanese yen fell against the US dollar to its lowest level since October 1998 as the Bank of Japan’s ultra-soft monetary policy contrasted sharply with the aggressive Federal Reserve A meeting between central bank governor Kuroda and Prime Minister Kishida failed to result in any action to strengthen the yen.
Main market quotes:
S&P 500 (F) (US500) 3,764.79 +89.95 (+2.45%)
Dow Jones (US30) 30,530.25 +641.47 (+2.15%)
DAX (DE40) 13,292.40 +26.80 (+0.20%)
FTSE 100 (UK100) 7,152.05 +30.24 (+0.42%)
USD Index 104.47 -0.23 (-0.22%)
Important events for today:
– UK Consumer Price Index (m/m) at 09:00 (GMT+3);
– UK Producer Price Index (m/m) at 09:00 (GMT+3);
– Canada Consumer Price Index (m/m) at 15:30 (GMT+3);
– Switzerland SNB Chairman Thomas Jordan speaks at 16:00 (GMT+3);
This article reflects a personal opinion and should not be interpreted as an investment advice, and/or offer, and/or a persistent request for carrying out financial transactions, and/or a guarantee, and/or a forecast of future events.
– Investors need to protect their investments and long-term wealth against soaring inflation and rising interest rates by revising which assets make up their portfolios.
This is the stark warning from Nigel Green, the chief executive and founder of deVere Group, a game-changing global financial advisory organisation.
It comes as retail and institutional investors the world over are battling the economic fallout of soaring consumer prices.
He notes: “Long term and short duration assets respond differently to rising inflation and interest rates.
“Short duration assets include value stocks, such as agriculture, financials, mining and energy sectors. These are the stocks that offer ‘jam today’ for investors, which are popular during periods of volatility as we’re experiencing now.
“Long duration assets, such as long-dated bonds and tech stocks, are particularly vulnerable to rising inflation and interest rate hikes from major western central banks.
“As such, in this volatile environment, investors might need to adjust their portfolios accordingly in order to mitigate risks to their investments and, therefore, their long-term wealth.”
Central banks face a dilemma, says the deVere CEO. Their current aim is to make money more expensive in order to weaken demand and bring down wage growth – “but without causing mass unemployment and triggering a recession.”
When it comes to inflation protection, he says that investors seeking both capital appreciation and capital preservation in this current landscape, should also consider diversifying into less traditional asset classes.
“Rising interest rates, amid weakening business and household demand, is bad news for both bond and stock markets.
“Meanwhile inflation will eat into company profit margins for many companies, particularly those selling discretionary products that businesses and consumers can delay purchasing.
“All this creates market volatility. Investors should consider less familiar, return-enhancing asset classes which could include venture capital, structured products, high dividend stocks, hedge funds and managed futures, and real estate, amongst others. They are also likely to increase diversification and reduce volatility, due to their low correlations to the more traditional investments; and they can hedge some portfolio exposures.
Nigel Green goes on to add: “It is impossible to know how much of the inflation and interest rate story is already baked-in to stock and bond market prices, but investors are anticipating further market volatility.”
The VIX ‘fear gauge’ index of implied future volatility on the S&P500 ended last week at a historically high level of 31.
But investors do appear to have confidence in the U.S. Federal Reserve’s – the world’s most powerful central bank – ability to bring down inflation in the medium term, with the 5yr/5yr forward inflation expectation rate -which measures the average annual inflation rate that is expected over a five year period, commencing in five years- falling over the last fortnight to 2.36% (only a little above the Fed’s 2% target rate).
Portfolio diversification is key, asserts the deVere Group chief executive.
“It’s true that equities have tended to outperform bonds and other assets over the long term. But a broadly diversified portfolio of equities, bonds, commodities and alternatives has performed better on a risk-adjusted basis, meaning after taking into account volatility.”
He concludes: “As ever, bouts of market volatility are the times when most opportunities are presented for investors looking to build long-term wealth.
“That said, investors should consider if they need to revise their portfolios in the current environment.”
About:
deVere Group is one of the world’s largest independent advisors of specialist global financial solutions to international, local mass affluent, and high-net-worth clients. It has a network of more than 70 offices across the world, over 80,000 clients and $12bn under advisement.
“The tidal wave of risk assumption … may be turning”
By Elliott Wave International
On June 14, the yield on the 10-year U.S. Treasury note surpassed 3.45% — its highest level in more than 11 years.
Keep in mind that the lowest intraday reading for the yield on the 10-year note was 0.31% — and that was as recently as 2020. So the rise has been remarkable.
The Elliott Wave Financial Forecast, a monthly publication which provides analysis of major U.S. financial markets, was ahead of this trend reversal. Back in March 2020, the publication showed this graph of yields on global bonds, 10-year U.S. Treasury notes and general obligation municipal bonds. Here’s the commentary:
According to 150 years’ worth of data … this is the first time that 10-year Treasury note yields have dropped below 1%. Grand Supercycle-degree tops set Grand Supercycle records. Investor ebullience is the only thing that allows for an embrace of no-yield debt. The tidal wave of risk assumption, however, may be turning.
In other words: Expect the downward trend in yields to turn upward.
Shortly after that March 2020 analysis in the Elliott Wave Financial Forecast published, yields began to climb.
As you might imagine, bond portfolios have taken a substantial hit (bond prices sink as yields climb).
Shifting to corporate bond portfolios, Bloomberg had this headline on March 14 of this year:
Corporate Bond Rout Is So Severe History Books Need a Revision
The article goes on to say:
[U.S. corporate bond] losses have piled so high that they now belong in history books. A Bloomberg index of investment-grade returns is down 10.5% so far this year … There is little precedent for drops of that magnitude.
Mind you, this was back in March and yields have risen since.
As a May 12 headline from the Associated Press said:
Bonds, haven for elderly and cautious, are getting torched
The question is: What does the Wave Principle say about this rising trend in bond yields?
If you need to brush up on your knowledge of the Wave Principle, an ideal book to read is Frost & Prechter’s Elliott Wave Principle: Key to Market. Here’s a quote from this Wall Street classic:
All waves may be categorized by relative size, or degree. The degree of a wave is determined by its size and position relative to component, adjacent and encompassing waves. Elliott named nine degrees of waves, from the smallest discernible on an hourly chart to the largest wave he could assume existed from the data then available. He chose the following terms for these degrees, from largest to smallest: Grand Supercycle, Supercycle, Cycle, Primary, Intermediate, Minor, Minute, Minuette, Subminuette. Cycle waves subdivide into Primary waves that subdivide into Intermediate waves that in turn subdivide into Minor waves, and so on. The specific terminology is not critical to the identification of degrees, although out of habit, today’s practitioners have become comfortable with Elliott’s nomenclature.
When labeling waves on a graph, some scheme is necessary to differentiate the degrees of waves in the market’s progression. We have standardized a sequence of labels involving numbers and letters … .
If you’re interested in reading the entire book, know that you can gain free access to the online version once you become a member of Club EWI, the world’s largest Elliott wave educational community.
Club EWI is free to join, and members enjoy free access to a wealth of Elliott wave resources on investing and trading.
This article was syndicated by Elliott Wave International and was originally published under the headline 10-Year U.S. Treasury Yield: Anticipating the Rising Trend. EWI is the world’s largest market forecasting firm. Its staff of full-time analysts led by Chartered Market Technician Robert Prechter provides 24-hour-a-day market analysis to institutional and private investors around the world.
We are in a double bind right now. Prices are going through the roof but all the signs suggest that the economy is weakening. The answer to higher prices is normally to raise interest rates, but this also induces people and firms to spend less money. The challenge for central banks is to try and deal with both problems at the same time.
We asked three economists whether they saw a way of bringing down inflation without causing a severe recession. Here’s what they said:
Jonathan Perraton, Senior Lecturer in Economics, University of Sheffield
The Bank of England’s decision to raise interest rates by a relatively modest 0.25 percentage points to 1.25% contrasts with the US Federal Reserve’s 0.75 points hike the day before to a range of 1.5% to 1.75%. This reflects concerns in the UK that economic growth will be weaker than previously forecast.
It follows the unexpected news that the UK economy shrank by 0.3% in April, plus sobering forecasts from the Organisation for Economic Co-operation and Development (OECD) that the UK will be the worst performing major economy in 2023 apart from Russia. GDP is now only fractionally above its pre-COVID level and all major sectors are shrinking.
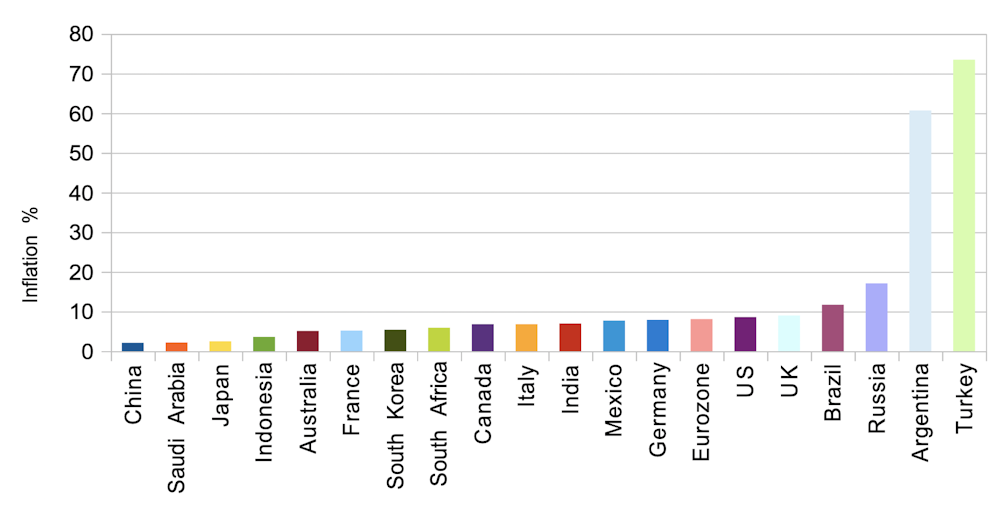
The Bank of England’s caution is despite inflation currently being at 9% and now expected to reach 11% in the coming months. These are levels not seen since the 1980s. Forecasts have the UK experiencing one of the highest inflation rates of the leading economies.
Inflation rates in the G20
Various sources
Inflation is a worldwide problem thanks to pressures on supply chains after COVID and higher energy and other commodity prices following Russia’s invasion of Ukraine. However, US economist Adam Posen has pointed to Brexit as a key factor in explaining Britain’s relatively high inflation. This has meant higher trading costs, weak sterling and labour shortages.
Unemployment has fallen to only 3.8%, although employment rates are still below pre-COVID levels, pointing to more people being inactive – particularly older workers. Staff shortages have become a key feature of the British economy.
You might expect this combination of low unemployment and unfilled vacancies to drive up wages. Instead regular pay, excluding bonuses, fell by 2.2% in real terms in June, the largest fall for over 20 years. So at least this does not yet appear to be a classic wage-price inflationary spiral, where firms give way to demands from workers for higher pay, pass on the costs to consumers in the form of higher prices, and workers demand even higher wages to cope. Having said that, bargaining rounds are yet to be completed and we are seeing more wage disputes in some sectors.
Until now, consumer demand has helped to stimulate economic activity in the UK, but this has partly been sustained by household savings. Some of this reflects households now spending more as COVID restrictions have been lifted but there are clear limits to how far households can dip into their savings as living standards are squeezed. Not surprisingly, consumer confidence is falling.
Longer term problems also remain. UK productivity has been very weak since the 2008 global financial crisis. There are many possible explanations, including weaknesses in capital investment and training – the latter reflected in current difficulties in filling vacancies.
In sum, the Bank of England is facing unprecedented challenges. Interest rate rises are a blunt tool to deal with supply-side problems in a British economy where growth is grinding to a halt. As long as inflation outstrips wages and the economy stagnates, it is likely to fall on the government rather than the Bank of England to provide people with support.
Brigitte Granville, Professor of International Economics and Economic Policy, Queen Mary University of London
Stagflation is upon us, so a natural focus for any “where next?” discussion must be whether we are on course for an episode as bad as the 1970s or even worse. My answer would be that recession is likely, but the 1970s experience of high inflation persisting despite repeated recessions should be avoidable. That said, even a relatively milder dose of stagflation will be painful for living standards.
The mildest way out of the present situation would be inflation promptly curing itself: by making people poorer in real terms so they can’t afford to buy so much. In this scenario, inflation would ease and central banks could help with the downturn in the economy by reversing their present interest-rate hikes.
There are several obstacles to such a fast turnaround, however: the context of the post-COVID recovery and the labour market.
The main inflationary impulse has come from two factors on the global supply side. First, supply chains have struggled to cope with demand collapsing and resurging during and after COVID, made worse by China’s zero-COVID policy. Second, energy and other natural resource supplies have been constrained by Russia’s war in Ukraine and the west’s sanctions.
The inflationary effects of these issues are being prolonged by pent-up demand from western firms and consumers due to COVID stimulus packages in the UK and especially the US, as well as unspent income accumulated during lockdowns. In the UK, for example, household deposit balances were still well above pre-COVID levels as recently as April.
It doesn’t help that the financial markets have been driven to such heights by loose monetary policy. Although the bubbles have been popping recently, valuations will have to fall some way further before people feel poorer and less willing to go out and buy things.
The wealth effect from the long bull market in stocks and other assets won’t peter out overnight.
Turning to the second obstacle to a rapid reversal of the inflation surge, namely the labour market, the main problem again comes from the supply side. Labour demand from firms has normalised post-COVID, but there are too few workers. This is partly to do with more people over 50 choosing not to go back to work, but the UK has the additional problem of Brexit interrupting the flow of good quality labour from central and eastern Europe.
With too few workers, companies are being forced to pay people more – UK wages are rising at about 4% a year – and to pass on the cost to customers in the prices of goods and services. Alert to the threat of a 1970s-style wage-price spiral, the Bank of England has been raising interest rates.
But leading indicators suggest that the wage-price spiral threat is not that serious. The closely watched Purchasing Managers’ Index, which gauges UK companies’ optimism about the economy, shows that those in services are becoming gloomier about the coming months. You don’t keep increasing prices if you think people are going to stop buying. And while we may have seen faint echoes of 1970s-style labour militancy in transport, for instance, pessimistic companies are generally more likely to cut hiring plans and output rather than give way to hefty wage demands – if not shut up shop altogether.
It seems to me that this will be more decisive in determining the course of inflation since it is a long-term structural issue, whereas the post-COVID issues should eventually straighten out. So overall, I expect that the UK economy’s present stagnation, quite likely dipping into mild recession, will bring inflation back down towards the 2% target. In the US, where underlying demand and credit is stronger, sharper interest hikes may be needed to achieve the same goal.
The main danger in my view is central banks becoming too dogmatic about their 2% inflation targets. In my book Remembering Inflation, I reviewed convincing research findings that inflation levels up to 5% cause little or no long-term damage to growth – especially if the inflation rate is steady rather than volatile. So once inflation eases a little, central banks should stop hiking interest rates to avoid doing more harm than good.
Chris Martin, Professor of Economics, University of Bath
The UK labour market is going to be key to how the UK economy performs in the coming months, and its prospects are finely balanced. On one hand, it proved resilient during the pandemic. The furlough schemes were a success, protecting the labour market from the worst effects of the crisis. The fall in employment was around three times lower than in the 1970s, even though the economic contraction was much greater.
Employment also recovered more quickly than in previous recessions. Vacancies are over 50% higher than before the pandemic. Average wages excluding bonuses are rising by about 4% a year, with even higher growth for drivers and workers in construction, software development and warehousing.
On the other hand, employment is still lower than before the pandemic by close to 250,000 workers. Real wages are still no higher than in 2008. And the macroeconomic context is gloomy: it is hard to see how the labour market will thrive if growth is weak or non-existent.
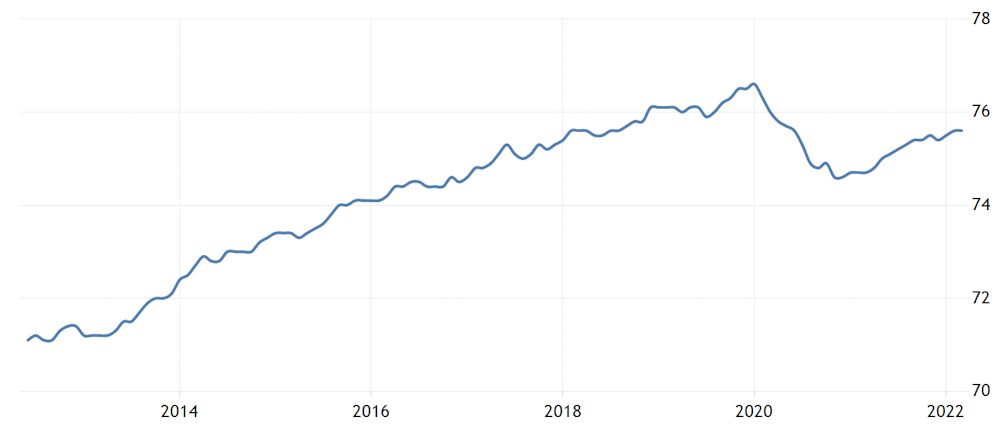
Several factors make the next few months hard to assess. First, unemployment is no longer a useful labour market indicator. Workers are nowadays categorised as employed, unemployed or inactive. Unemployed workers are actively seeking work but the inactive are not. Of the circa 250,000 drop in employed workers since 2019, 80% are inactive; only 20% are now unemployed.
Economists have a much weaker understanding of the inactive than the unemployed. This matters because most people getting hired are from the inactive rather than the unemployed category.
Second, perhaps surprisingly, Brexit has not reduced migration, but it has changed it. There are fewer EU citizens employed in the UK, but more workers from Nigeria, India and similar countries. They tend to be more highly skilled and to work in health and social care, rather than in hospitality.
More skilled workers should be good for productivity and fill vital roles in health and social care, but hospitality is struggling at the same time. However, it is not yet clear if these changes are permanent, and this too makes the labour market more difficult to forecast.
In addition, the behaviour of vacancies and their relationship to hiring seems to have changed. The most recent data shows 1.3 million vacancies, around 40% higher than pre-pandemic. But this has not resulted in record numbers of workers being hired. Whatever the cause, we can no longer rely on high vacancy posting to generate rising employment.
Finally, a striking divide is opening between the public and private sectors. Private sector employment is back to pre-COVID levels, but public sector employment lags behind. Private sector wages are currently increasing by 8%, compared to just 1.5% for the public sector. Forecasting public sector employment is difficult, since it is immune to some of the market forces that drive the private sector, although there seems little prospect of noticeable growth over the next few months.
These negative forces will be offset by the large number of vacancies currently being offered by firms and by relatively large wage rises in some parts of the private sector. This may induce some of those workers back into the labour market who have withdrawn following the pandemic.
On balance, I would expect a fall in employment of up to 100,000 workers in the coming few months. That’s less than 0.1%, so it’s not going to greatly exacerbate all the other problems in the economy.
That’s one of the stories used to explain why, in modern times, Wall Street types call someone who sells a stock expecting its price to drop a “bear.” It follows that a market in which securities or commodities are persistently declining in value is known as a “bear market,” like the one U.S. stocks are experiencing now.
The opposite, when assets are steadily rising over a period of time, is a “bull market.”
In my money and banking classes, I teach students about the efficient market hypothesis, which states that stock prices are rational, in that they are always fairly priced based on available information. But when there are big swings in the stock market, it’s hard for my students and others to resist using more emotive terms like “bulls” and “bears,” which call to mind the “animal spirits” of investing.
So how do you know when you’re in a bear market?
The Securities and Exchange Control Commission defines a bear market as a period of at least two months when a broad market – measured by an index such as the S&P 500 – falls by 20% or more. When it rises by 20% or more over two months or more, it is a bull market.
The Standard & Poor’s 500 index, which includes most of the most well-known U.S. companies, has declined about 24% since its its peak on Jan. 3, 2022.
Not everyone strictly follows this two-month rule. For example, in March 2020, when the S&P 500 plunged 34% in a matter of weeks due to the onset of the COVID-19 pandemic, many analysts still called it a “bear market.”
A milder form of a bear market is “correction.” During a correction, prices drop by 10% to 20% from the previous peak.
Some analysts estimate there have been 26 bear markets in the S&P 500 since 1928, excluding the one that began in 2022. The average length was 289 days, with a decline of about 36%. The longest was in 1973-74 and lasted 630 days.
There have been fewer distinct bull markets, with 24 in that period. They tend to last a lot longer, though, often for multiple years.
Why a bear market matters
A bear market may signal a recession is coming, though it’s not a perfect correlation. Since World War II, there have been three bear markets – out of a total of 12 – that didn’t precede a recession.
A bear market is bad news for anyone with a stock investment, whether it’s a direct stake in Apple or Walmart or a 401(k). The impact is particularly hard on recent retirees, who are seeing their nest eggs shrink just as they need to start withdrawing income from them.
In addition, entering a bear market can have a psychological impact on investors, creating a self-fulfilling cycle. Perceiving a bear market tends to prompt investors to sell even more, thus pushing prices down further and prolonging the pain.
Read other short, accessible explanations of newsworthy subjects written by academics in their areas of expertise for The Conversation U.S. here.
There wasn’t much dramatic tension as markets waited for the Bank of England’s latest decision on interest rates. The fifth monthly quarter-point hike in a row was largely expected, taking the base rate to 1.25% in June 2022. All the announcement really revealed, in fact, was what a mess UK economic policy is in.
Neither the Bank of England, nor the government, is now helping to deal with Britain’s economic problems. A more rational approach to monetary and fiscal policy is needed.
The Bank’s aim is to curb inflation. But the interest rate rise is unlikely to affect inflation at all. There may be a small impact on import prices, if higher rates prevent a further deterioration in the value of the pound. But raising the rate at which citizens and businesses in the UK can borrow money will not ease the global rise in oil, gas and food prices that is the main source of inflation now.
The Bank of England’s members know this, of course. Their justification for raising rates is that they want to keep inflationary expectations under control, to prevent an uncontrollable “wage-price spiral”. This can happen when expectations of future inflation lead workers to bargain for higher earnings to compensate, which only adds to inflation. The Bank of England’s fear is a return to the 1970s. Such a wage-price spiral pushed inflation to 22.6% in 1975.
But the problem with this argument is that inflation has been more than 4% since October 2021 and real earnings are not rising. Strip out bonuses being paid in a small number of sectors, and wages rose only 4.2% between February and April 2022, which in real terms (once inflation is included) is a fall of 2.2%. And the trend is downwards, not upwards.
In the 1970s, more than half the workforce were members of trade unions, giving them the muscle to bargain for higher wages. Average earnings in 1975 hit almost 30%. Today, fewer than a quarter of employees are union members, and most of these are in the public sector, where wages are currently rising by just 1.5% on average.
So there is little chance of a 1970s-style inflationary wage-price spiral. But these cuts in real wages are already starting to cause a contraction of the UK economy. Consumers have no choice but to spend more on the necessities of energy and food, much of which leaves the UK economy. So they are cutting back on discretionary spending on items such as entertainment and home goods, where more money tends to stay within the UK.
And in this situation, the Bank of England’s rate rise will actually make things worse. As interest rates rise, consumers and businesses will find it more costly to borrow to invest and spend, and aggregate demand will fall further.
Government policy
The government isn’t helping either. The emergency package of support to consumers announced by Chancellor Rishi Sunak in May represents a significant stimulus. But the government’s overall fiscal stance is still contractionary, with significant tax rises acting to withdraw demand from the economy. Sunak is still more intent on limiting public borrowing, in accordance with his self-imposed fiscal rules, than he is on keeping either taxes down or spending up.
So, on the one hand we have the Bank of England raising rates in a way that will not affect inflation, but will curb consumer spending. On the other, the government is simultaneously withdrawing demand from the economy via tax rises. And all while the UK economy is contracting.
It is hard not to see this as anything but an economic policy mess. What the UK needs is much stronger coordination between fiscal and monetary policy. If interest rates are to rise, this should only occur while the government stimulates the economy to ensure output and incomes are sustained.
And underneath all this are much deeper weaknesses in the UK economy, which date from well before COVID-19. The UK has close to the lowest rate of investment, and among the lowest productivity and weakest wage growth of any leading economy. Over the last year, business investment has been falling, deeply affected by Brexit and the overall weak outlook for growth. Productivity fell by 0.7% in the last six months. And the Office for Budget Responsibility forecasts that real wages will still be lower in 2026 than they were in 2008.
The government likes to boast about the UK’s very low unemployment rate, now just 3.8%. The labour market is currently as tight as it has ever been, with more vacancies than there are people officially unemployed. But this disguises the fact that employment has also fallen: half a million people have left the labour market since before the pandemic. Some of these have been EU citizens leaving the country; others have taken early retirement, declared themselves sick, or are unwilling to work on the wages they are being offered.
To return to growth, the UK needs to attract more people into the labour market. This requires higher wages, not lower. It also demands an improvement in labour conditions, particularly in the insecure gig economy of zero hours contracts and precarious self-employment. Making work more attractive would require firms to invest in better equipment and skills training, in turn raising productivity.
In a rational economic policy world, the government would now be brokering sectoral productivity deals with businesses and unions, promising government support in return for higher investment and higher earnings. This could indeed be at the heart of the government’s “levelling up” strategy. But unfortunately, we are not in such a world.
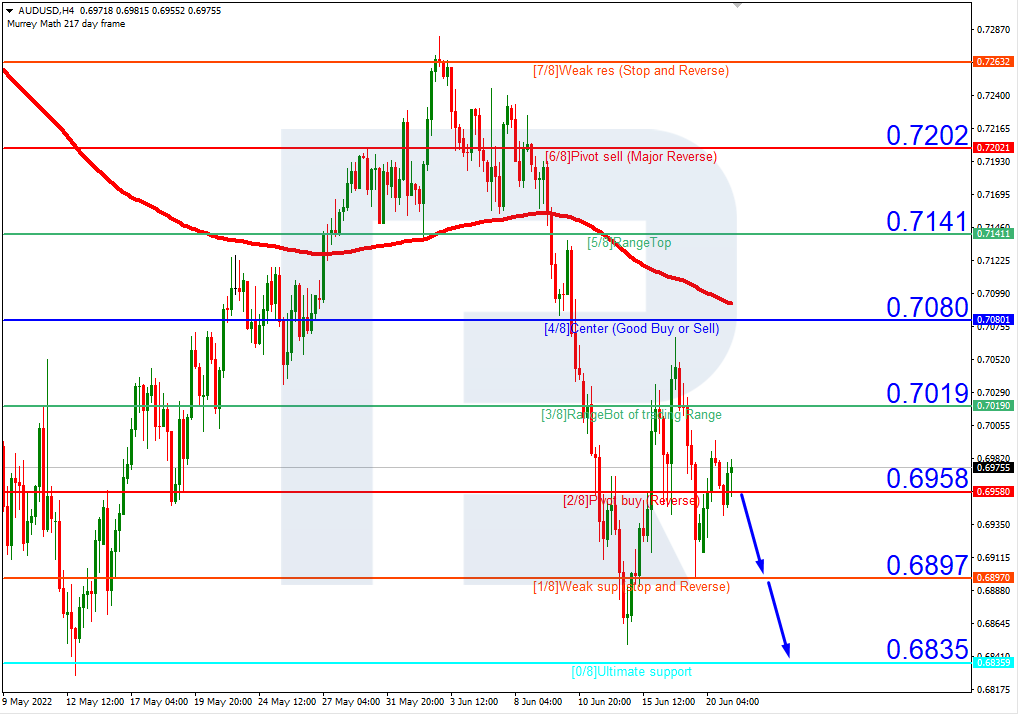
As we can see in the H4 chart, AUDUSD is trading below the 200-day Moving Average to indicate a descending tendency. In this case, the price is expected to test 2/8, break it, and then continue falling to reach the support at 0/8. However, this scenario may no longer be valid if the price breaks the resistance at 3/8 to the upside. After that, the instrument may reverse and resume growing towards 4/8.
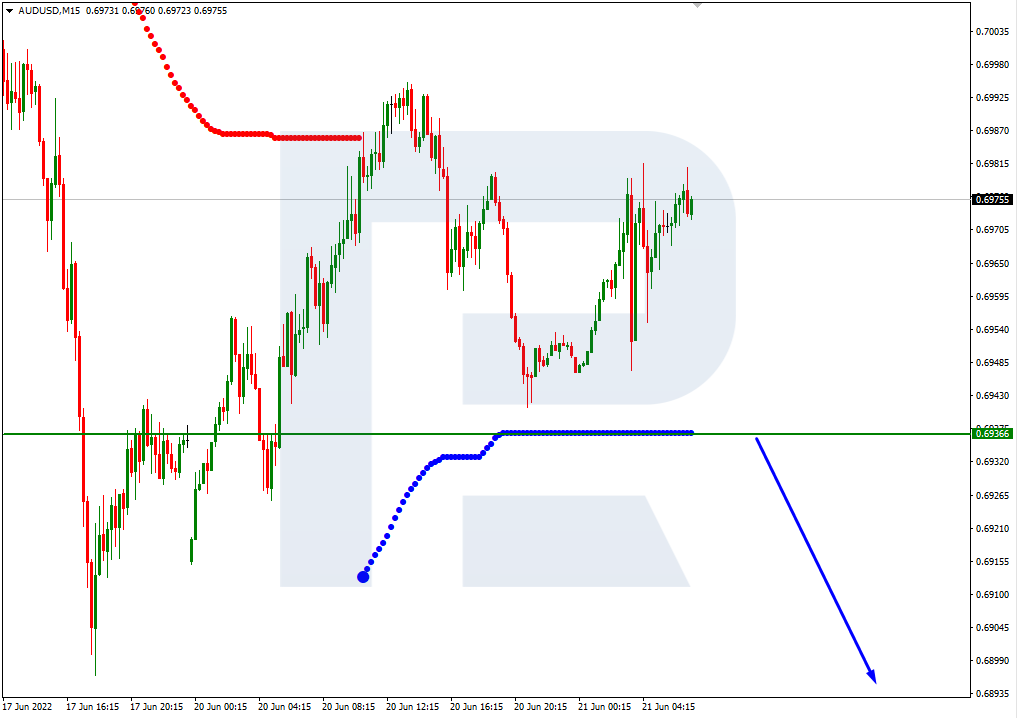
In the M15 chart, the pair may break the downside line of the VoltyChannel indicator and, as a result, continue moving downwards to reach 0/8 from the H4 chart.
NZDUSD, “New Zealand Dollar vs US Dollar”
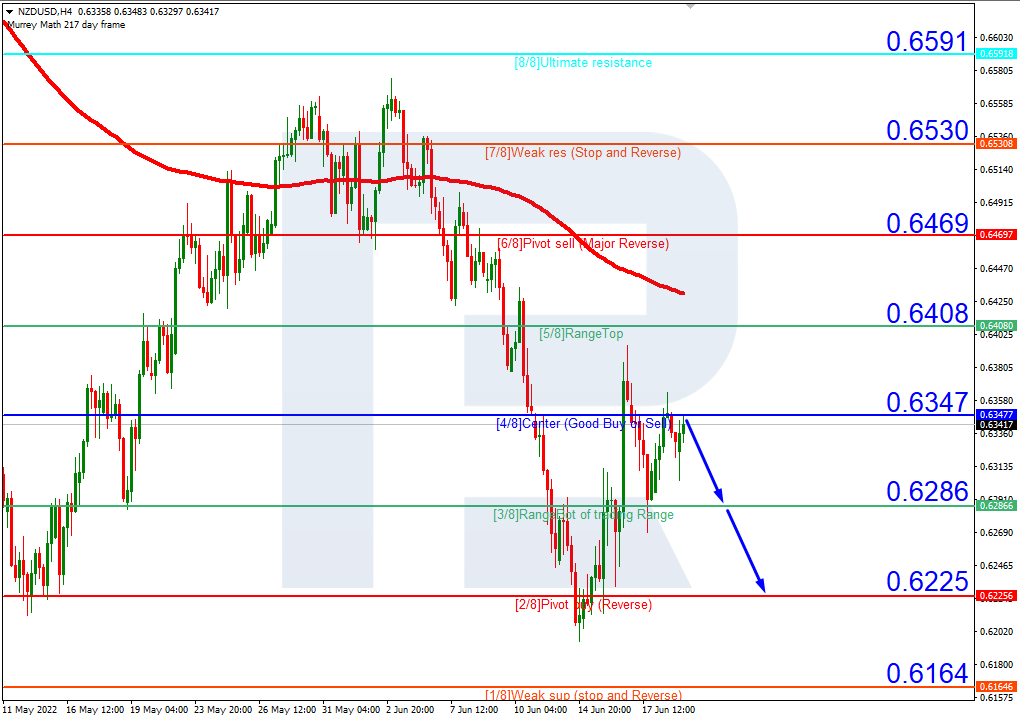
As we can see in the H4 chart, NZDUSD is also trading below the 200-day Moving Average, thus indicating a possible descending tendency. In this case, the price is expected to rebound from 3/8 and then resume moving downwards to reach the support at 2/8. However, this scenario may no longer be valid if the price breaks the resistance at 4/8 to the upside. After that, the instrument may reverse and grow towards 5/8.
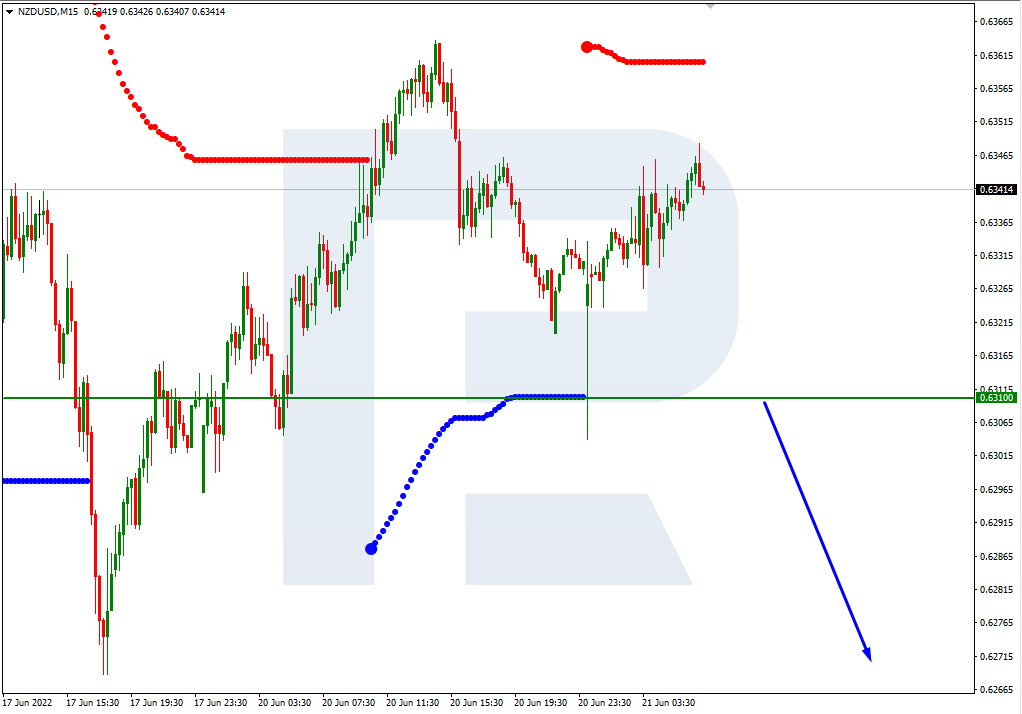
In the M15 chart, the pair may break the downside line of the VoltyChannel indicator and, as a result, continue its decline.
Attention! Forecasts presented in this section only reflect the author’s private opinion and should not be considered as guidance for trading. RoboForex LP bears no responsibility for trading results based on trading recommendations described in these analytical reviews.
– Some major crypto firms need to stop making obvious, avoidable mistakes that destabilize the industry, cause financial chaos for investors and job losses for workers, says the CEO of one of the world’s largest advisory, asset management and fintech organizations.
The comments from deVere Group’s Nigel Green, a game-changing digital asset advocate who launched pioneering cryptocurrency exchange deVere Crypto in early 2018, come as some of the biggest players in the market continue to struggle in a volatile environment.
Bitcoin, the world’s largest cryptocurrency, which has shed 57% so far this year, fell below $20,000 over the weekend for the first time since December 2020.
He says: “I’m not in the habit of throwing shade at other companies, but in recent times we’ve seen many of the biggest players make huge, unnecessary mistakes.
“They went for enormously expensive TV ads, jumped on highest-tier sponsorships, rolled-out lending models offering astronomical interest rates on crypto deposits, and launched unprecedented hiring sprees.
“Now, what do we have? Firms laying-off swathes of staff, freezing client withdrawals and cutting back on investment.”
He continues: “Unfortunately, these brands have made some classic, obvious and avoidable dot-com era errors.
“These mistakes destabilize the industry due to the contagion effect, exacerbate financial chaos for investors and the pain of job losses for so many who were hoping to have a rewarding career in the future of finance.
“Such crypto firms would be better off – for the sake of their clients and the wider industry – growing through investing in top talent, innovation and development, and lobbying for sensible regulation with financial watchdogs.”
Despite the crypto price drops, like many long-term crypto investors the deVere CEO is still accumulating Bitcoin.
“I’m using the volatility as a buying opportunity; I’m topping up my investment portfolio at a lower price point.
“The reason why I’m still buying Bitcoin is that I’m confident that digital, global, borderless, decentralized, tamper-proof, unconfiscatable money is, inevitably, the future.”
He adds: “I’m still accumulating Bitcoin as its unique fundamentals haven’t changed.
“Bitcoin continues to produce block by block, the ecosystem and infrastructure continue to develop, major corporations and institutions continue to adopt it, and miners continue to increase their operations.”
Nigel Green says that he believes the crypto sector will bounce back stronger. “I’m sure lessons will be learned and the industry – the future of finance – will become more robust as a result.”
About:
deVere Group is one of the world’s largest independent advisors of specialist global financial solutions to international, local mass affluent, and high-net-worth clients. It has a network of more than 70 offices across the world, over 80,000 clients and $12bn under advisement.