By RoboForex Analytical Department
The Japanese yen strengthened on Monday, approaching 155 per dollar to reach its highest level in over a week. This appreciation reflects heightened investor anticipation ahead of the Bank of Japan’s (BoJ) pivotal monetary policy meeting on Friday.
Markets widely expect the central bank to raise its benchmark interest rate by 25 basis points, bringing it to 0.75%. However, the primary focus will be on the forward guidance provided by Governor Kazuo Ueda in his post-meeting commentary. His remarks will be scrutinized for signals regarding the pace and extent of monetary tightening expected throughout 2025.
Analysts now project the BoJ’s policy rate could reach 1.0% by July 2026. This hawkish outlook is underpinned by resilient domestic economic data, particularly consumer inflation, which remains stubbornly above the BoJ’s historical targets.
Notably, political resistance to tightening appears to be fading. Prime Minister Sanae Takaichi’s administration is unlikely to oppose a rate hike, as the prolonged weakness of the yen – partly a consequence of delayed policy normalization – has exacerbated import costs and contributed to inflationary pressures.
Technical Analysis: USD/JPY
H4 Chart:
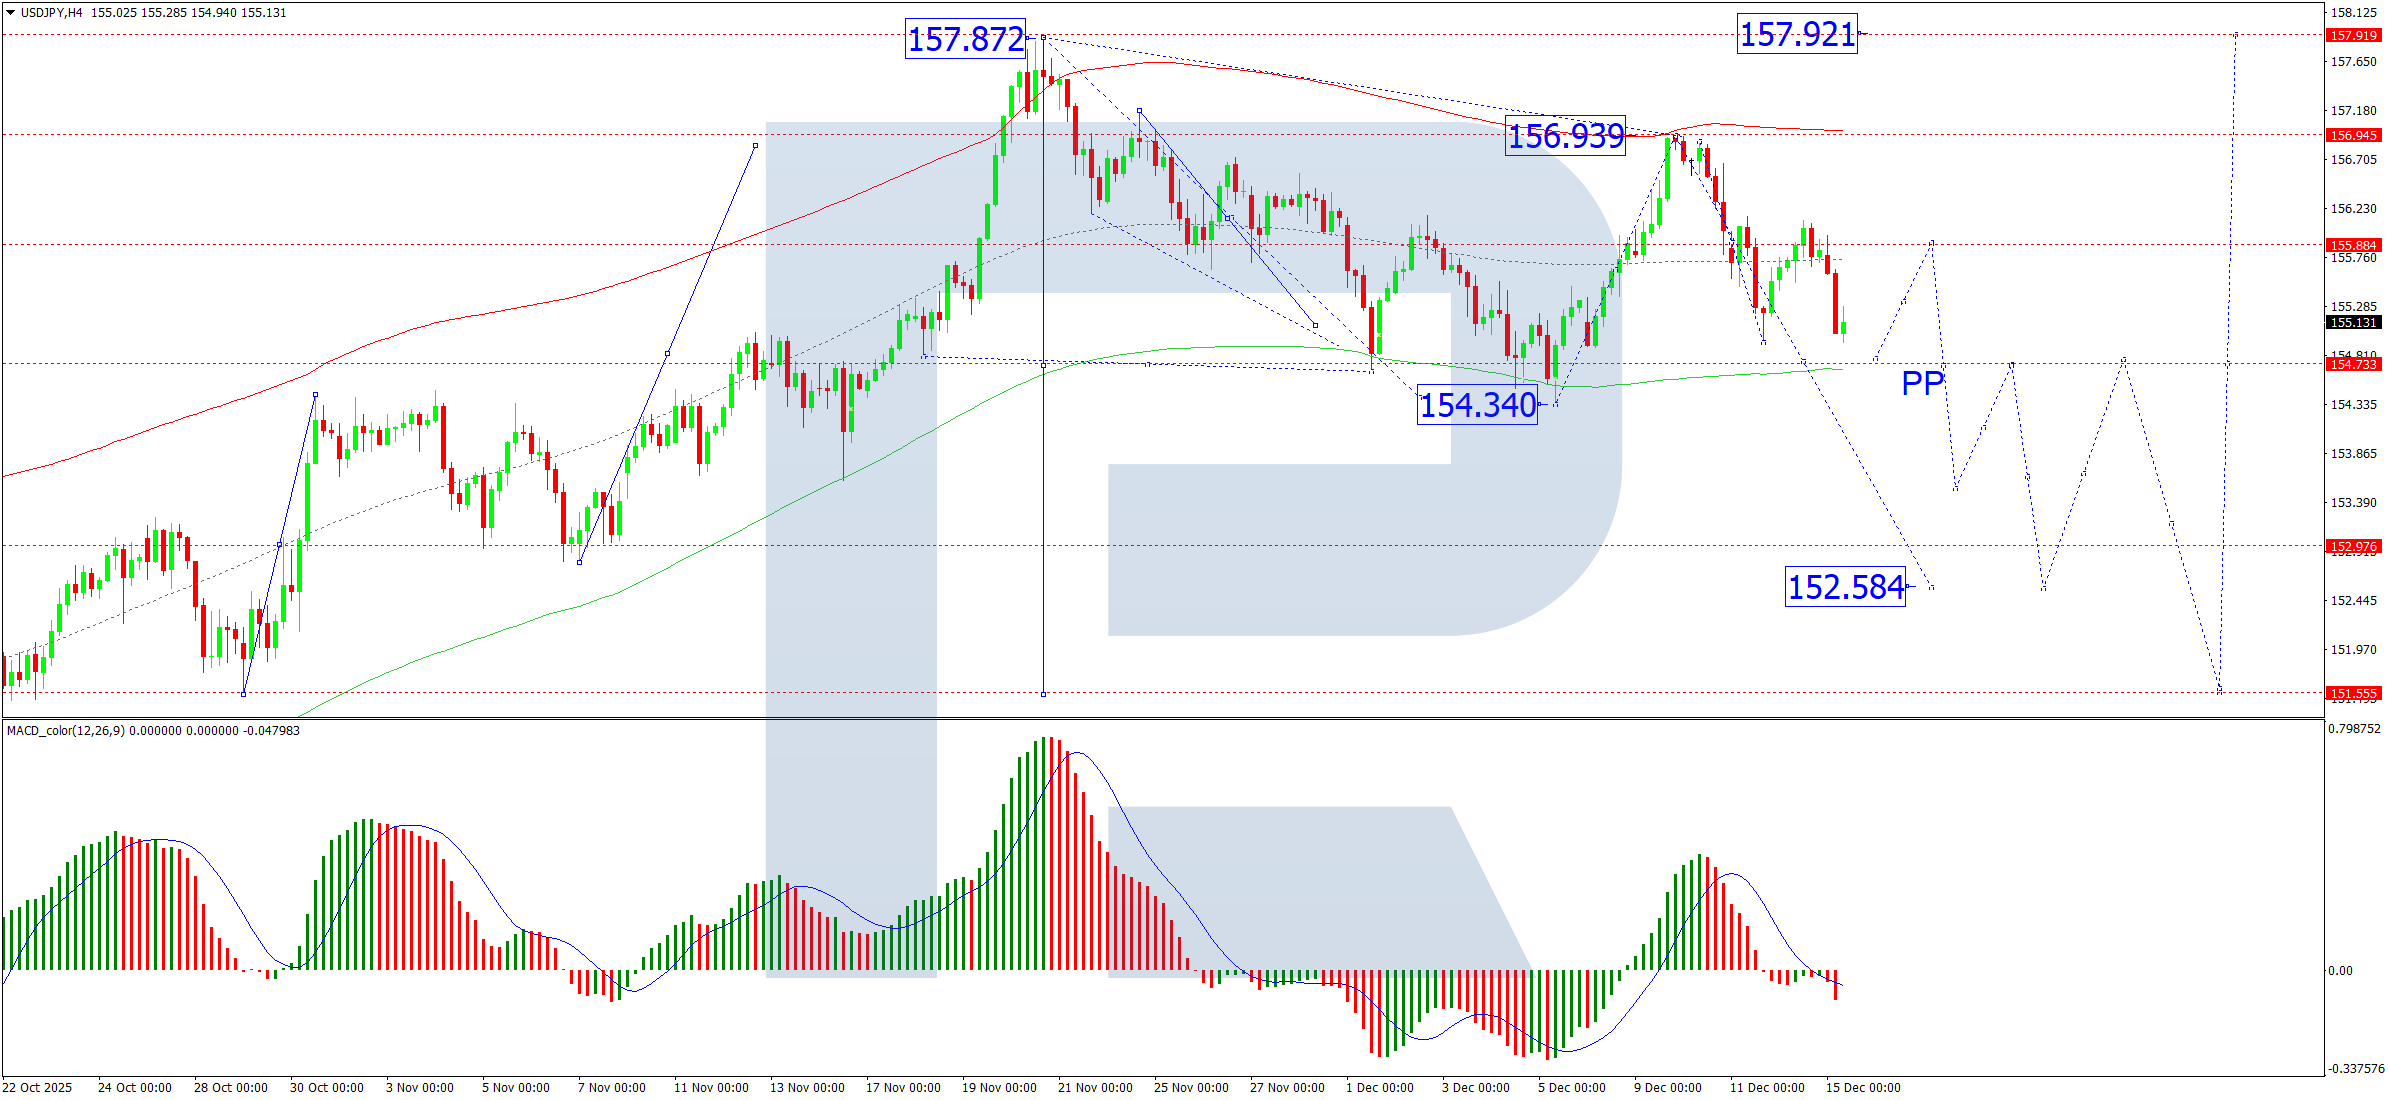
On the H4 chart, USD/JPY has completed the first leg of a decline to 154.34, followed by a corrective rebound to 156.93. We now anticipate the development of a new wave of decline targeting 154.73. Following this, the pair is likely to form a consolidation range around this level. A subsequent downward breakout from this range would signal a continuation of the broader downtrend, opening the path towards 152.58. This bearish view is supported by the MACD indicator, whose signal line is positioned below zero and pointing decisively downward.
H1 Chart:
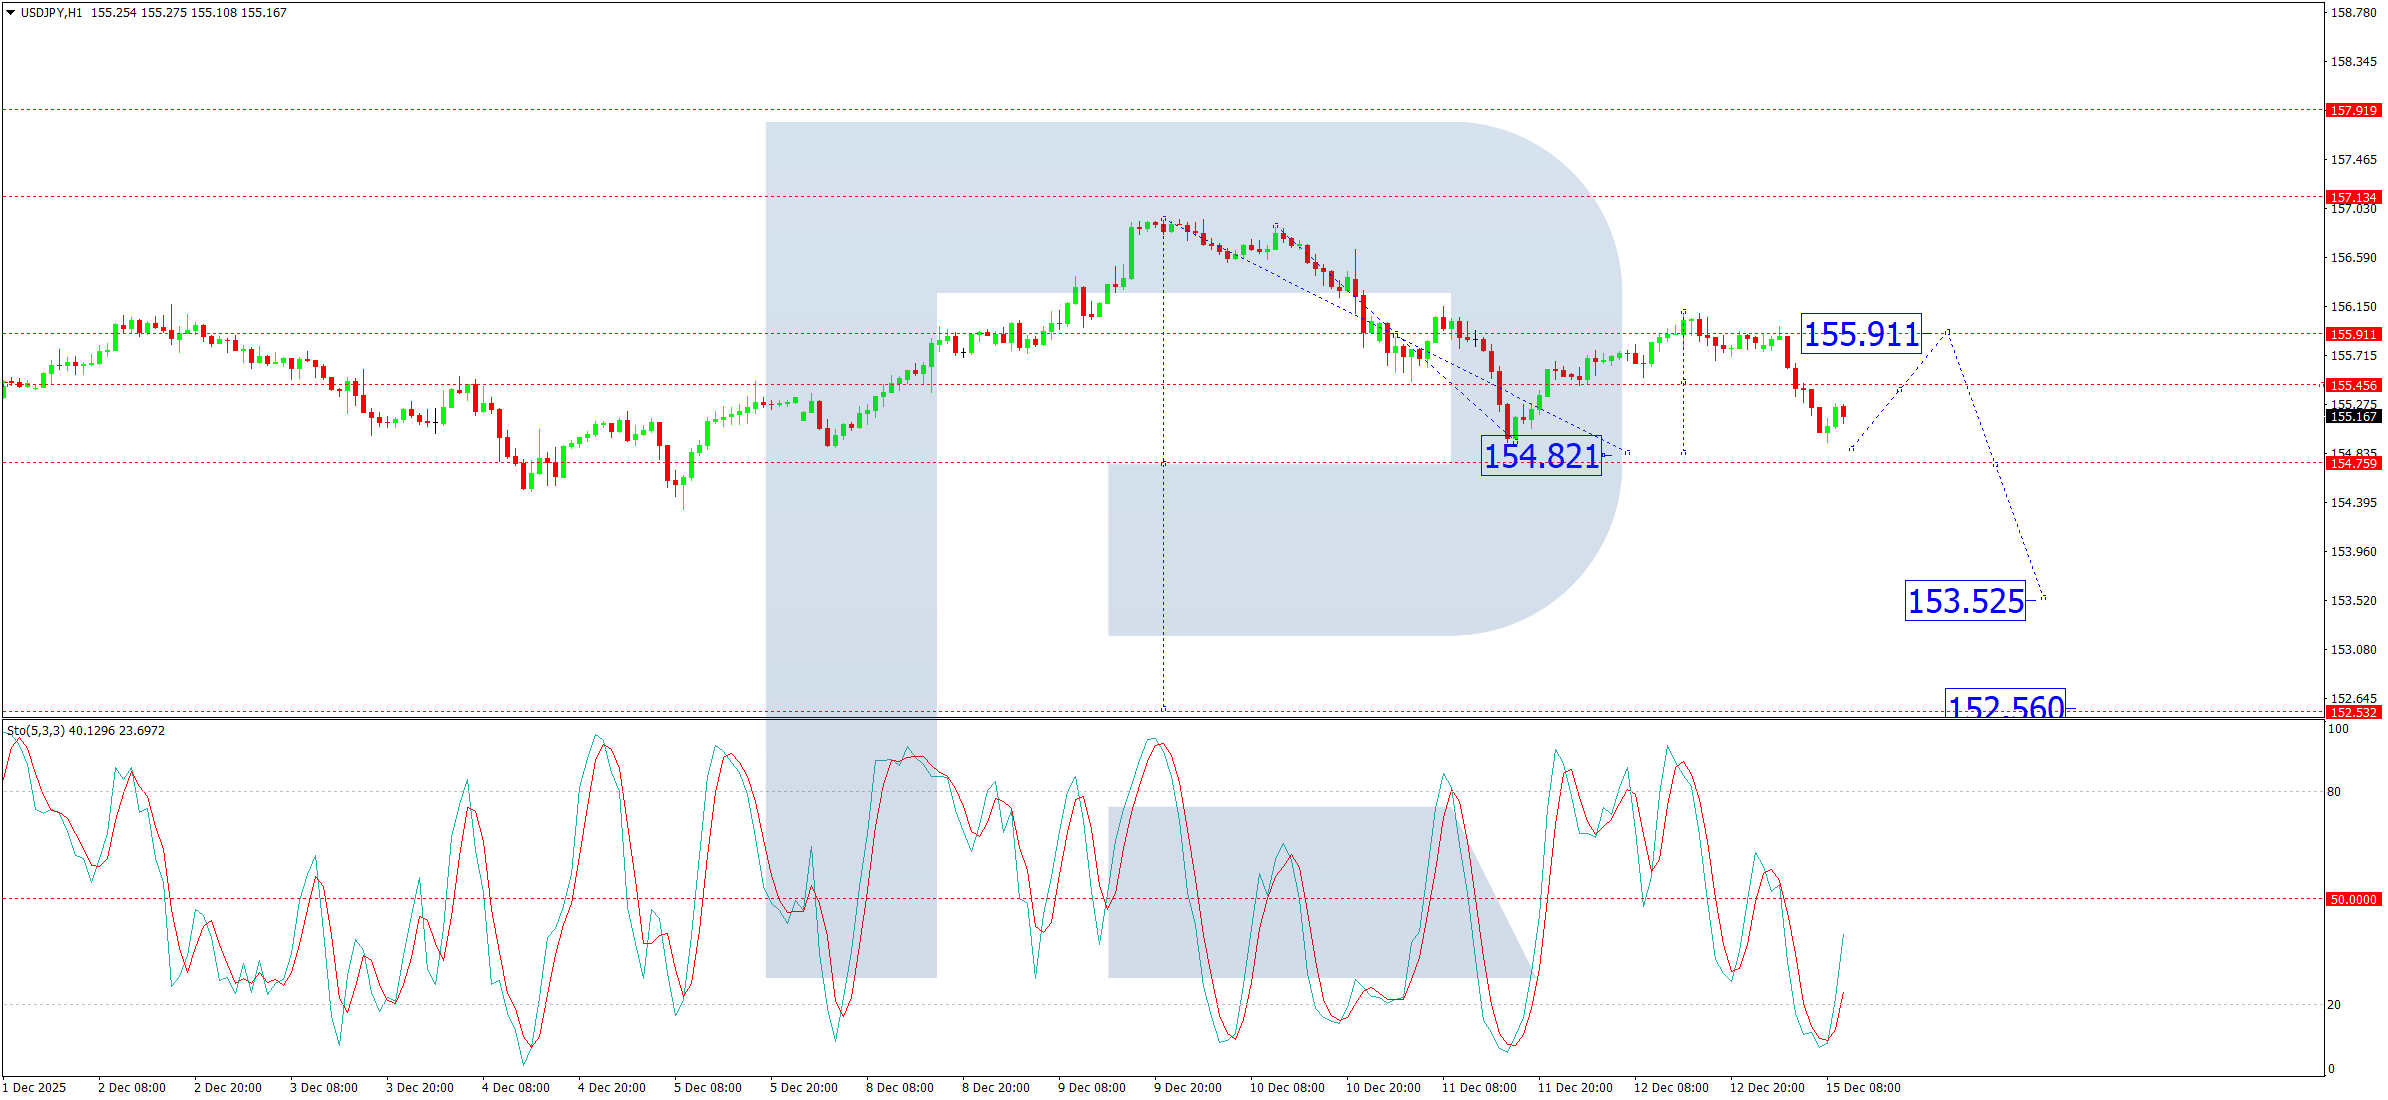
On the H1 chart, the pair is forming a declining wave with an immediate target at 154.82. Upon reaching this level, a corrective upward move towards 155.45 is anticipated. A further extension of this correction to 155.91 cannot be ruled out. However, following this relief rally, we expect the primary downtrend to resume, driving the pair lower towards 153.52. The Stochastic Oscillator aligns with this near-term corrective view, as its signal line has turned up from the 20 level and is rising towards 50, indicating that a temporary bounce is likely before selling pressure reasserts itself.
Conclusion
The yen is firming as markets position for a landmark BoJ rate hike and a shift away from its long-held ultra-loose policy stance. Technically, USD/JPY is exhibiting a clear bearish structure across multiple timeframes. While a short-term corrective bounce is possible, the overall trajectory points towards further weakness, with key downside targets at 154.73 on H4 and 153.52 on H1. Governor Ueda’s guidance on Friday will be the ultimate determinant of whether this technical correction evolves into a sustained trend reversal.
Disclaimer:
Any forecasts contained herein are based on the author’s particular opinion. This analysis may not be treated as trading advice. RoboForex bears no responsibility for trading results based on trading recommendations and reviews contained herein.