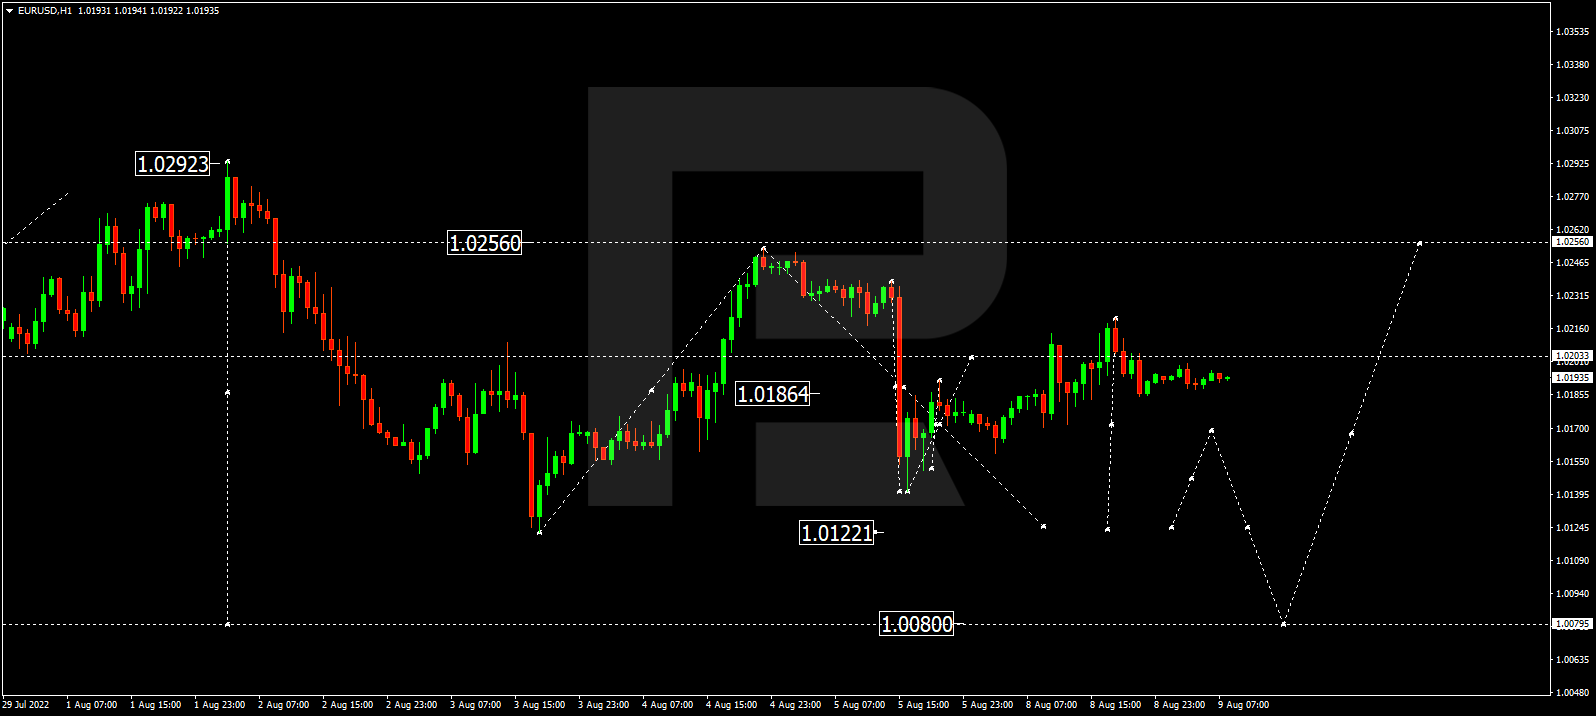
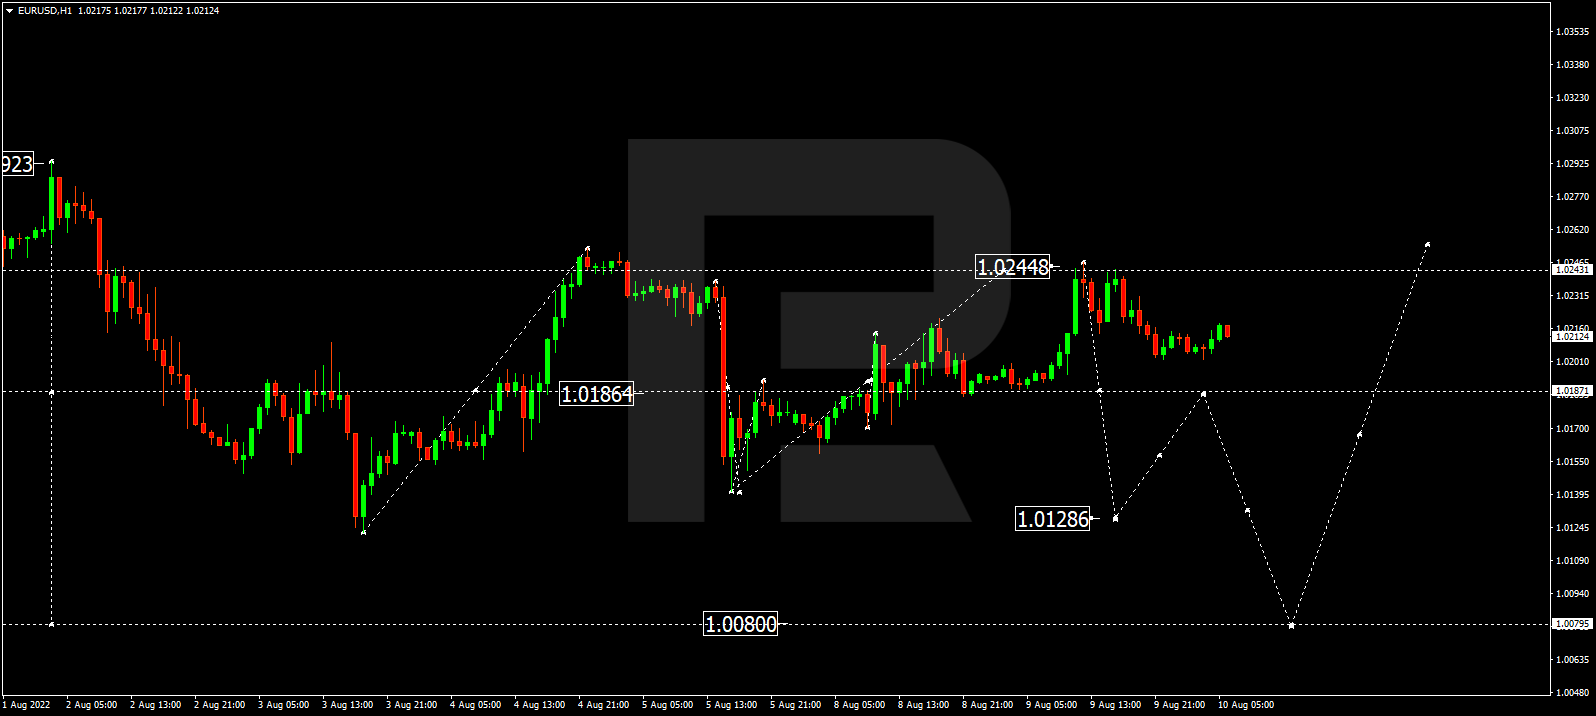
EURUSD is still falling towards 1.0187. After that, the instrument may grow to reach 1.0215 and then consolidate above 1.0187. If later the price breaks this range to the downside, the market may resume trading downwards with the target at 1.0128, or even extend this structure down to 1.0080.
GBPUSD, “Great Britain Pound vs US Dollar”
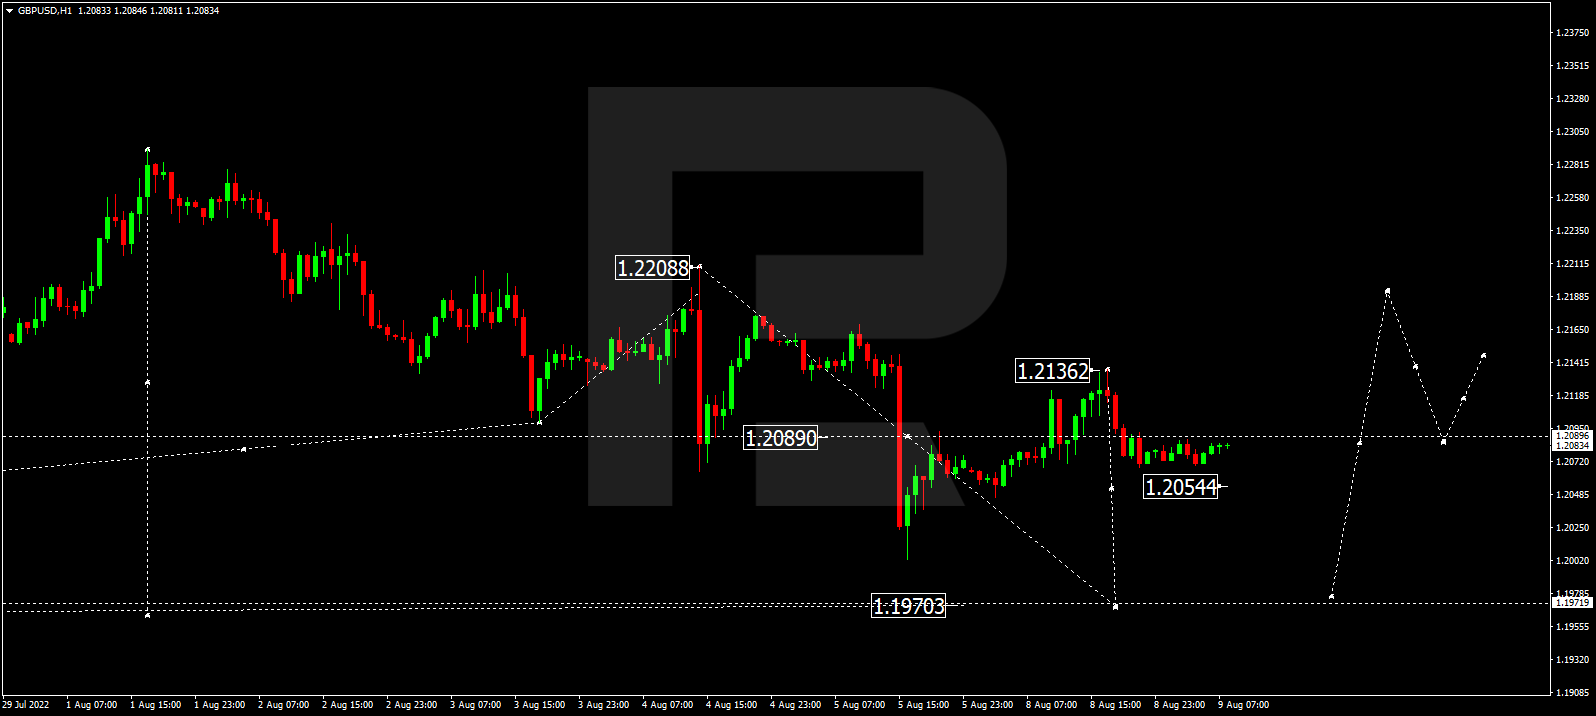
GBPUSD is still consolidating around 1.2088. Today, the pair may fall towards 1.2050 and then form one more ascending wave to return to 1.2088. Later, the market may resume falling with the target at 1.2002, or even extend this structure down to 1.1970.
USDJPY, “US Dollar vs Japanese Yen”
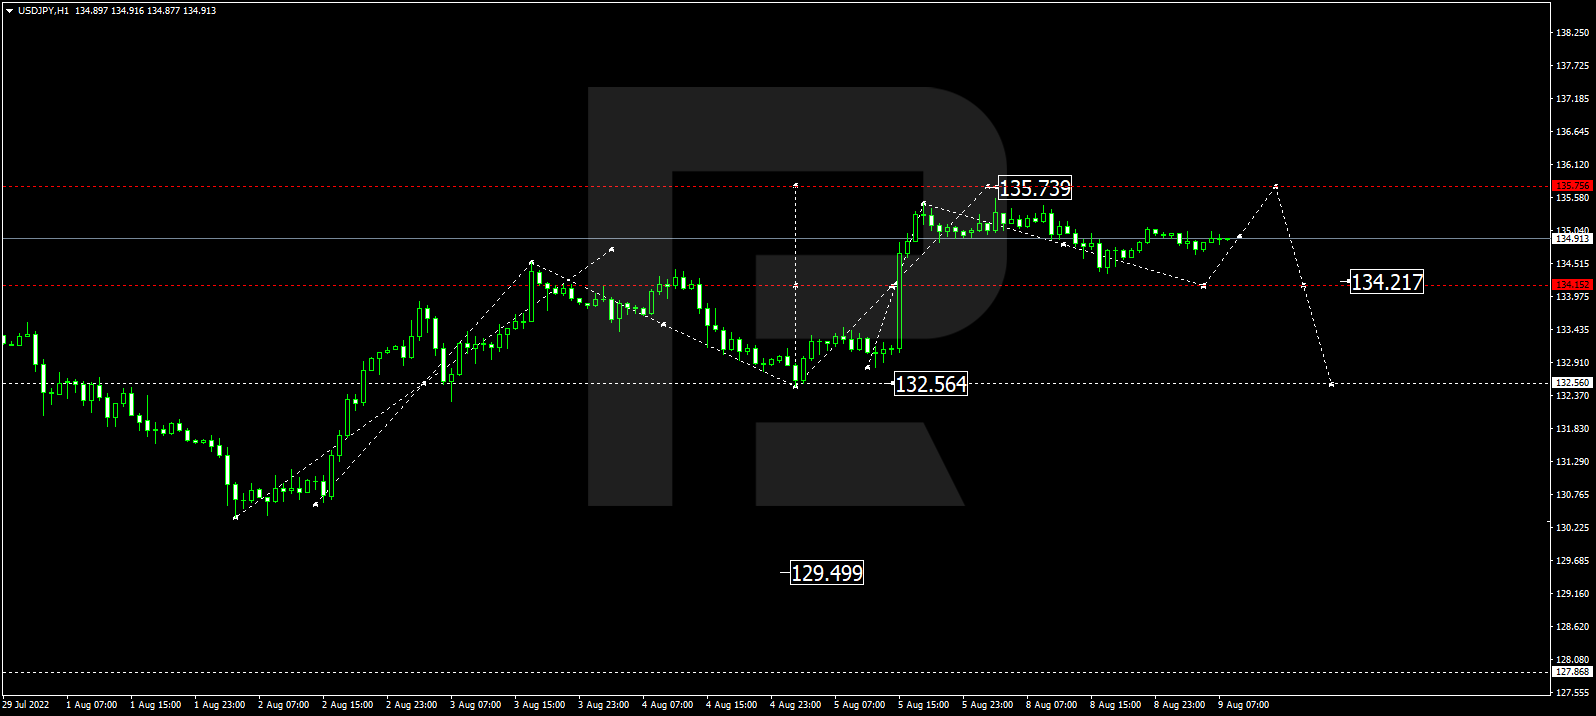
USDJPY is still consolidating around 134.94. Possibly, the pair may start a new decline with the target at 134.18 and then resume trading upwards to reach 135.75. After that, the instrument may fall towards 132.55.
USDCHF, “US Dollar vs Swiss Franc”
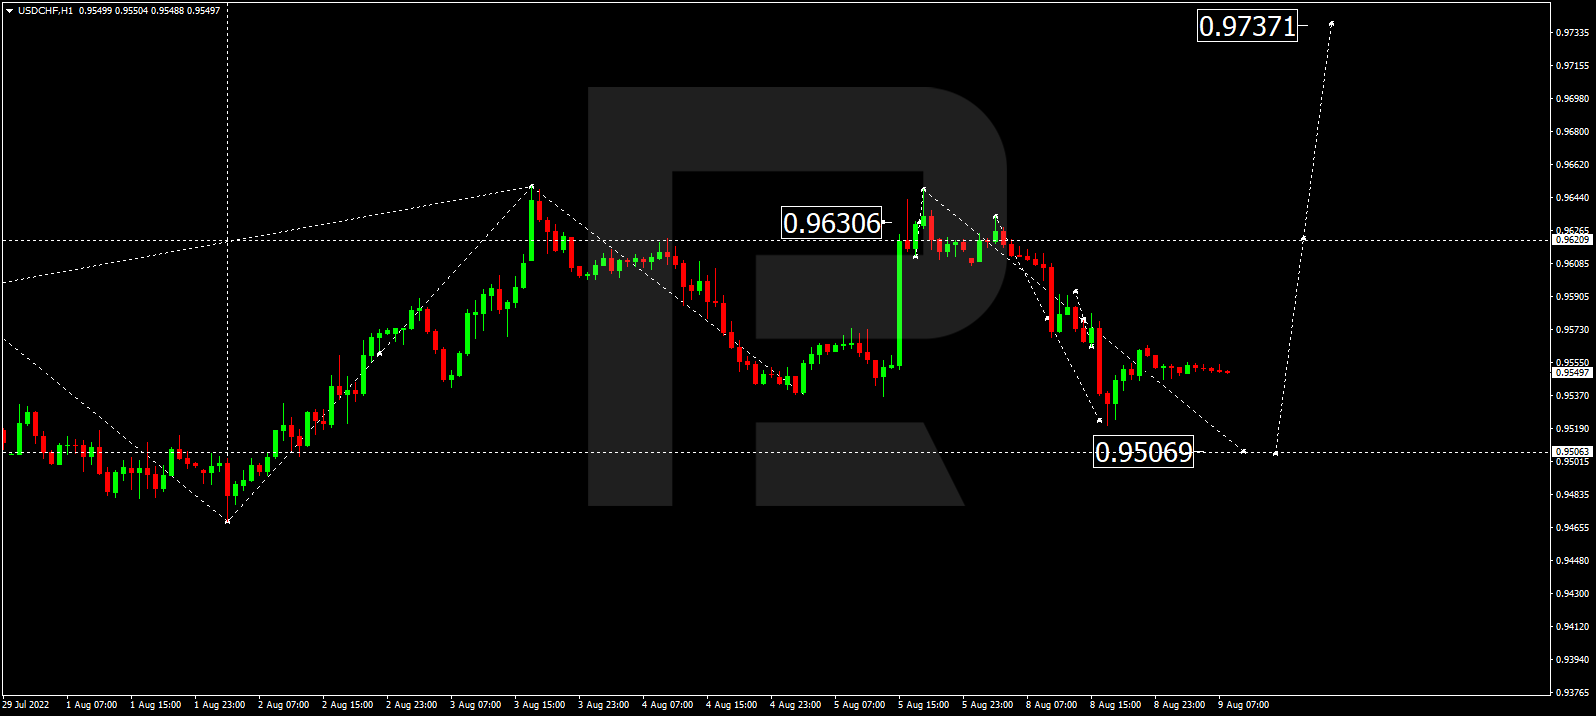
USDCHF continues falling towards 0.9506; it has already completed the descending structure at 0.9506 along with the correction up to 0.9544. After that, the instrument may resume trading downwards to return to 0.9506 and then form one more ascending structure with the target at 0.9588.
AUDUSD, “Australian Dollar vs US Dollar”
AUDUSD continues falling to break 0.6900 and may later continue trading downwards with the short-term target at 0.6797.
BRENT
Brent has finished the ascending structure at 99.90; right now, it is falling to break 96.44 and may later continue trading downwards to reach 93.00. After that, the instrument may start another growth with the target at 98.88.
XAUUSD, “Gold vs US Dollar”
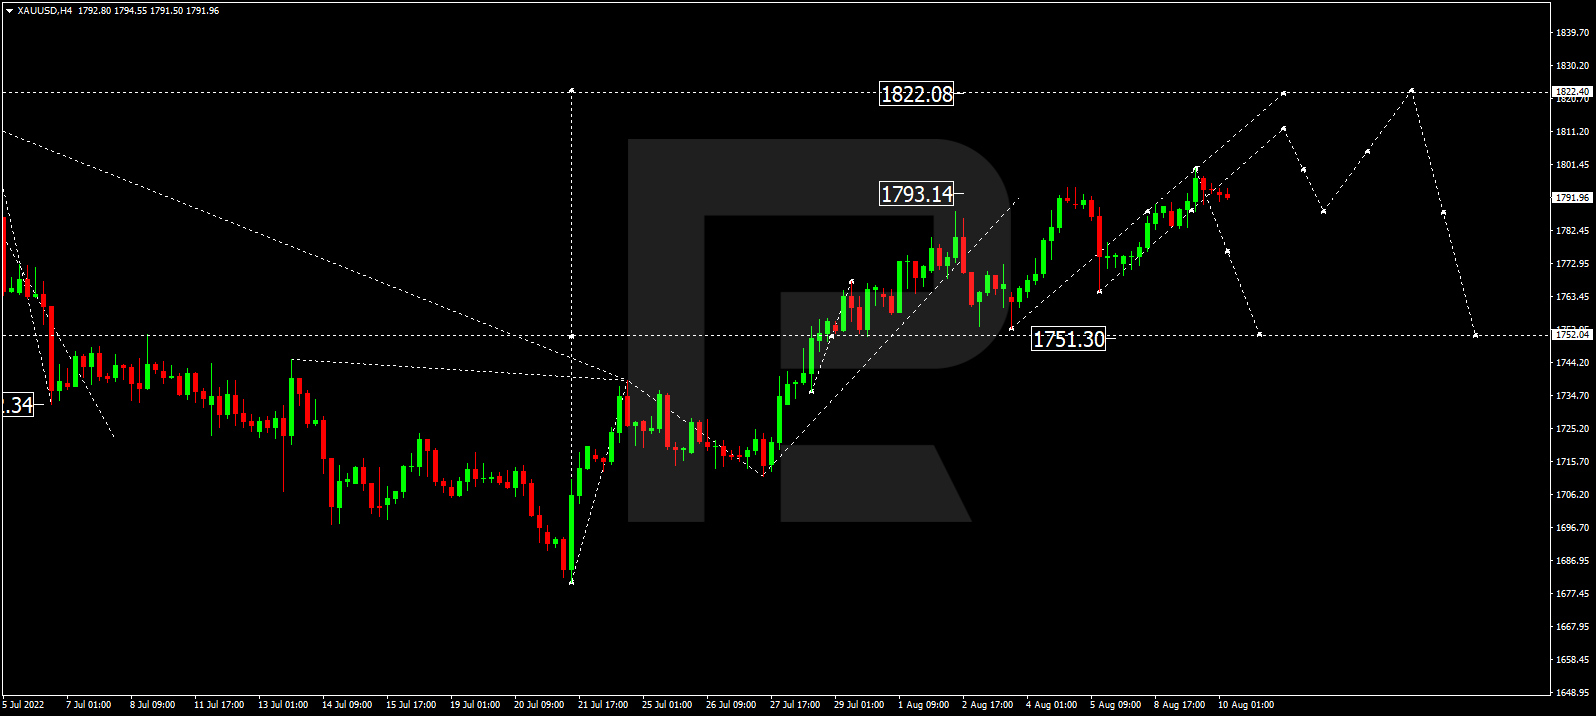
Gold has completed the ascending wave at 1800.00. Possibly, today the metal may fall towards 1752.00 and then resume trading upwards with the first target at 1822.40.
S&P 500
The S&P index has reached 4111.0; right now, it is consolidating above it. Possibly, the asset may extend this descending wave down to 4075.7. Later, the market may resume trading upwards to reach 4211.0 and then start a new decline with the first target at 3919.0.
Attention! Forecasts presented in this section only reflect the author’s private opinion and should not be considered as guidance for trading. RoboForex LP bears no responsibility for trading results based on trading recommendations described in these analytical reviews.
The BTC dropped to $23,000. Yesterday’s trading session was emotionally exhausting – market players were selling and the overall picture was more negative than positive.
Two days ago, the BTC was going to test $24,400. However, market conditions failed: American exchanges started falling. Technically, it was explained by the fact that their previous growth had no solid base, but a nail-biting wait for the US CPI data release and a possible recession made investors lock in profits.
Wednesday is a very important day. If the CPI data from the US does show a slowdown in inflation, stock exchanges will rise, and the crypto market will follow. Reasonable inflation numbers might prevent the US Fed from continuing its aggressive policy in the near future – it’s a good signal for capital markets.
The capitalisation of the crypto market is about $1.084 trillion; the fear index has significantly dropped.
Iran: first steps in crypto
Iran made the first import order paid with cryptocurrency worth $10 million. Possibly, in a couple of months, likely by the end of September, cryptos will be more widely used in the country’s trade – it will make the process less dependable of exchange rate fluctuations.
Core Scientific is still selling BTC
In July, Core Scientific mined 1,221 Bitcoins, but sold 1,975 tokens to cover its capital expenses. By selling crypto, the company earned $44 million; the average price was $22,000 per coin. The company needs this money to continue expanding its mining facilities.
SEC will monitor exchanges
The United States Securities and Exchange Commission initiated investigations into operations of all crypto exchanged operating on the American soil. It’s about 40 platforms, including Binance. The regulator’s major accusation is possible violations of the law.
Attention! Forecasts presented in this section only reflect the author’s private opinion and should not be considered as guidance for trading. RoboForex LP bears no responsibility for trading results based on trading recommendations described in these analytical reviews.
Inflation data will be released in the US today. Analysts expect consumer prices to stay about the same, indicating a slowdown in price growth. But if the data turns out to be worse than forecasted and inflation rises again, it may boost the US dollar index on expectations of further aggressive interest rate hikes by the Fed.
Trading recommendations
Support levels: 1.0200, 1.0146, 1.0112, 1.0035, 1.0000
From the technical point of view, the trend on the EUR/USD currency pair on the hour time frame is bullish. The price is still forming a wide volatile balance with the borders of 1.0112-1.0284. Under such market conditions, buy trades are best to consider on intraday time frames from the support level of 1.0200. Sell trades can be considered from the resistance level of 1.0233 or 1.0264, but only after additional confirmation and only with short targets.
Alternative scenario: if the price breaks down through the 1.0112 support level and fixes below, the downtrend will likely resume.
News feed for 2022.08.10:
– Japan Producer Price Index (m/m) at 02:50 (GMT+3);
– US Consumer Price Index (m/m) at 15:30 (GMT+3).
The GBP/USD currency pair
Technical indicators of the currency pair:
Prev Open: 1.2079
Prev Close: 1.2074
% chg. over the last day: -0.04%
According to a SocGen strategist, the British pound could fall below $1.20 next month as the US Federal Reserve’s interest rate hike continues to outpace the Bank of England. According to the analyst, the Bank of England’s recent recession warning, combined with growing expectations of another 75 basis points US interest rate hike, could put the pound at risk of falling below $1.20. The pound has fallen 10% against the dollar since the beginning of the year, ranking among the three worst G-10 currencies.
Trading recommendations
Support levels: 1.2063, 1.2006, 1.1803
Resistance levels: 1.2098, 1.2209, 1.2294
From the technical point of view, the trend on the GBP/USD currency pair on the hour time is bullish, but now the price is forming a balance, where the sellers prevail. The MACD indicator has become inactive. If the price dips below 1.2063 again and stays lower, there will be a trend change. At the moment, it is better to look for buy trades on the intraday time frames from the support level of 1.2063, but only with a confirmation. Sell trades can be considered from the resistance level of 1.2098, but only after additional confirmation and with short targets.
Alternative scenario: if the price breaks down through the 1.2063 support level and fixes below, the downtrend will likely resume.
News feed for 2022.08.10:
– US Consumer Price Index (m/m) at 15:30 (GMT+3).
The USD/JPY currency pair
Technical indicators of the currency pair:
Prev Open: 134.84
Prev Close: 135.13
% chg. over the last day: +0.22%
In Japan, the Producer Price Index, which shows the factory inflation rate, declined from 9.4% to 8.6% annually. This indicates that the consumer inflation rate is also set to decline, which is bad for the Japanese currency as the Bank of Japan, on the contrary, aims to raise the consumer price level. Thus, traders should not expect any changes in the monetary policy of the central bank of Japan in the direction of tightening.
Trading recommendations
Support levels: 134.29, 133.42, 132.12, 131.37, 130.85
Resistance levels: 135.29, 136.03, 137.11
From the technical point of view, the medium-term trend on the USD/JPY currency pair is close to changing to the uptrend. The price is now trading at the priority change level but has not yet consolidated higher. A break of 135.29 will change the trend. Under such market conditions, buy trades can be sought from the support level of 134.29 or 133.42, but with additional confirmation. Resistance levels of 135.29 may be considered for sell deals, but only with additional confirmation in the form of a reverse initiative, as the price has already tested it.
Alternative scenario: If the price fixes above 135.29, the uptrend will likely resume.
News feed for 2022.08.10:
– Japan Producer Price Index (m/m) at 02:50 (GMT+3);
– US Consumer Price Index (m/m) at 15:30 (GMT+3).
The USD/CAD currency pair
Technical indicators of the currency pair:
Prev Open: 1.2845
Prev Close: 1.2883
% chg. over the last day: +0.29%
Currently, the Bank of Canada and the US Federal Reserve keep interest rates at 2.5%, so parity prevails on the USD/CAD currency pair with a short-term shift of initiative from the dollar to the Canadian and vice versa. The labor market remains strong in both the US and Canada, which leaves room for central banks to raise interest rates further. Therefore, the only imbalance in the USD/CAD quotes will be oil. It is well known that the Canadian dollar is a commodity currency, so a rise in oil prices always gives confidence to the Canadian.
In terms of technical analysis, the USD/CAD currency pair trend has changed to bullish. At the moment, the price is trading at the level of moving averages. The MACD indicator has become inactive, and the volatility has declined in anticipation of inflation and oil reserves data. Under such market conditions, buy trades should be considered on the lower time frames from the support level of 1.2800, but only with confirmation and short targets. For sell deals, it is better to consider the resistance level of 1.2895 or 1.2926, but with confirmation.
Alternative scenario: if the price breaks out and consolidates below the 1.2786 support level, the downtrend will likely resume.
This article reflects a personal opinion and should not be interpreted as an investment advice, and/or offer, and/or a persistent request for carrying out financial transactions, and/or a guarantee, and/or a forecast of future events.
The US stock indices were trading lower yesterday ahead of the inflation data, indicating that investors were probably closing their positions before the important report. At the close of the stock market yesterday, the Dow Jones Index (US30) decreased by 0.18%, and the S&P 500 Index (US500) was down 0.42%. The NASDAQ Technology Index (US100) fell by 1.19%.
The Fed’s balance sheet reduction plan, known as quantitative tightening (QT), will begin in full force in September. The Fed will begin reducing the balance sheet with $95 billion monthly cuts ($60 billion in Treasuries and $35 billion in mortgage-backed securities). But analysts believe the US Central Bank will have to wind down some of its aggressive monetary tightenings as early as next year as it begins cutting rates to fight the economic downturn. Bank of America estimates that if the Fed pauses QT in September 2023, the Treasury will probably have $630 billion less debt for the public in the fiscal year 2024. Fed Chairman Jerome Powell said last month that the Central Bank’s model “Suggests that it could take two to two and a half years” for the balance sheet to come to a “New equilibrium.” The balance sheet more than doubled during the pandemic, to $9 trillion earlier this year, as the Fed again used quantitative easing as a crisis-fighting tool. But there is an alternative view. Some analysts believe the US Fed will have to raise rates to 5% in 2023 and stay at that level because of tight inflation to get room to lower interest rates in 2024 and again resort to increasing the balance sheet by turning on the printing machine.
Micron Technology (MU) projected negative free cash flow in the second quarter due to falling revenue as lower PC and video game sales are expected to impact chip demand. The company’s stock is down more than 4%. Norwegian Cruise Line (NCLH) reported second-quarter results that fell short of Wall Street expectations and provided gloomy forecasts, predicting that occupancy levels won’t return to pre-pandemic levels until next year. Rival Royal Caribbean Cruises (RCL) and Carnival (CCL) are down more than 5%.
Tesla CEO Elon Musk sold $6.9 billion of Tesla stock, citing the high likelihood of a forced deal with Twitter. Musk broke off an April 25 agreement to buy Twitter for $44 billion in early July. Twitter sued Musk to force him to complete the transaction, dismissing his claim that he had been misled about the number of spam accounts on the social media platform. Both parties will appear in court on October 17.
Stock markets in Europe traded flat on Tuesday. Yesterday German DAX (DE30) fell by 1.12%, French CAC 40 (FR40) lost 0.53%, Spanish IBEX 35 (ES35) gained 0.48%, British FTSE 100 (UK100) closed on the plus side by 0.07%.
A famous German aluminum factory is preparing to shut down due to the growing gas crisis in Europe. Costs have doubled this year, causing the plant to idle one week a month to save gas. The price of gas contracts for Europe has nearly tripled since the beginning of the year due to Russia’s invasion of Ukraine, sanctions against Russia, a slowdown in Russian gas supplies through Nord Stream 1, and global market tensions. Germany’s energy regulator is urging companies, the government, and consumers to reduce gas consumption and has asked major firms to submit contingency plans to reduce consumption during the winter further.
Gold prices are strengthening ahead of a key inflation report. Gold is getting support as a safe-haven asset as stock indices decline along with the Dollar Index. Investors expect a decline in the rate of inflation in today’s report. But if the data is worse than expected, the dollar index could get a boost, negatively affecting the prices of precious metals.
Oil prices fell on Tuesday as market participants compared last week’s potential stockpiling in the US with news that exports of some oil via the “Druzhba” pipeline from Russia to Europe, which runs through Ukraine, have been halted. Russian pipeline monopoly Transneft said Ukraine had suspended crude through the pipeline because Western sanctions prevented Moscow from paying transit fees. The news, however, was offset by reports of new progress in nuclear talks with Iran, which could bring 500,000 to one million barrels a day to the market if Tehran frees itself from sanctions imposed on its oil over its suspected nuclear weapons development.
Asian markets traded flat yesterday. Japan’s Nikkei 225 (JP225) fell by 0.88%, Hong Kong’s Hang Seng (HK50) lost 0.21%, and Australia’s S&P/ASX 200 (AU200) was up by 0.13% by the end of the day.
China’s annual Consumer Price Index was slightly lower than expected at 2.7% instead of 2.5%. Meanwhile, the Producer Price Index, which shows the factory inflation rate, fell sharply from 6.1% to 4.2%. The easing of price pressures in China may reflect the sluggish performance of the domestic economy due to continued Covid-19 lockdowns in major commercial centers hampering activity.
S&P 500 (F) (US500) 4,122.47 −17.59 (−0.42%)
Dow Jones (US30) 32,774.41 −58.13 (−0.18%)
DAX (DE40) 13,534.97 −152.72 (−1.12%)
FTSE 100 (UK100) 7,488.15 +5.78 (+0.077%)
USD Index 106.32 −0.12 (−0.11%)
Important events for today:
– Japan Producer Price Index (m/m) at 02:50 (GMT+3);
– China Consumer Price Index (m/m) at 04:30 (GMT+3);
– China Producer Price Index (m/m) at 04:30 (GMT+3);
This article reflects a personal opinion and should not be interpreted as an investment advice, and/or offer, and/or a persistent request for carrying out financial transactions, and/or a guarantee, and/or a forecast of future events.
– A sense of anticipation has gripped financial markets as investors brace for the latest US inflation report this afternoon.
Inflation is expected to cool 8.7% in July compared with 9.1% in June. As highlighted on multiple occasions this week, the pending report could spark explosive levels of volatility given the market obsession with rising prices.
Before the report is published at 1:30 pm London time, there are a couple of technical setups to keep a close eye on.
Dollar wobbles above 106.00
It has been a shaky week for the dollar thus far. Prices are wobbling above 106.00 as of writing. A hot inflation report could inject bulls with enough confidence to retest 106.70 and 107.30. Alternatively, one that meets or prints below expectations could drag the DXY back towards 105.00.
EURUSD trapped in a range
The EURUSD is clearly waiting for a fresh fundamental spark to breakout of the current range. Support can be found at 1.0100 and resistance at 1.0270. This afternoon’s US CPI report could trigger a breakout with a move above 1.0270 opening doors towards 1.0350. If 1.0100 is breached, bears may target parity.
GBPUSD breakdown pending?
The subtitle says it all. Prices are struggling to keep above the 1.2060 support level. A breakdown could be on the horizon which opens the doors towards 1.1900. If 1.2060 proves to be reliable support, prices could rebound back towards the 50-day SMA and 1.2260.
Same old story for AUDUSD
Since punching back above 0.6850 back in mid-July, the AUDUSD has been trapped within a range. Support can be found at 0.6850 and resistance at 0.7050. Given how prices are trading above the 50-day SMA and the MACD is above zero, bulls have a platform to push prices higher. However, the currency pair could be waiting for a fundamental catalyst to experience a breakout/down.
USDJPY presses against 135
After staging a sharp bounce from the 100-day SMA at the start of August, the USDJPY is trading around 135.0 as of writing. A strong breakout above this level could open a path towards 137.00 and 139.380. Sustained weakness below 135.00 may trigger a selloff towards 131.34.
NZDUSD waits for catalyst
Prices remain in a range with support at 0.6220 and resistance at 0.6375. A strong breakout above 0.6375 could trigger a move towards 0.6450 and 0.6570. If prices slip back towards 0.6220, we could see a selloff back towards 0.6100.
EURJPY breakout on horizon?
The EURJPY has the potential to push higher if a strong breakout above 138.00 is secured. This may open a path towards 139.00 and 141.50. Sustained weakness below 138.00 may open the doors back towards 136.70 and 134.500.
Having completed the correctional structure at 1.0220, EURUSD is falling to break 1.0122 and may later continue trading downwards with the target at 1.0080.
GBPUSD, “Great Britain Pound vs US Dollar”
GBPUSD has finished the correctional structure at 1.2136; right now, it is forming a new descending wave to break 1.2050 and may later continue falling with the target at 1.1970.
USDJPY, “US Dollar vs Japanese Yen”
USDJPY is correcting down to 134.22. After that, the instrument may start a new growth with the target at 135.75 and then resume trading downwards to reach 132.55.
USDCHF, “US Dollar vs Swiss Franc”
USDCHF continues falling towards 0.9506. After that, the instrument may form one more ascending structure to break 0.9620 and then continue growing with the short-term target at 0.9733.
AUDUSD, “Australian Dollar vs US Dollar”
AUDUSD has finished the correctional wave at 0.7007. Possibly, today the pair may resume falling with the target at 0.6899, or even extend this structure down to 0.6794.
BRENT
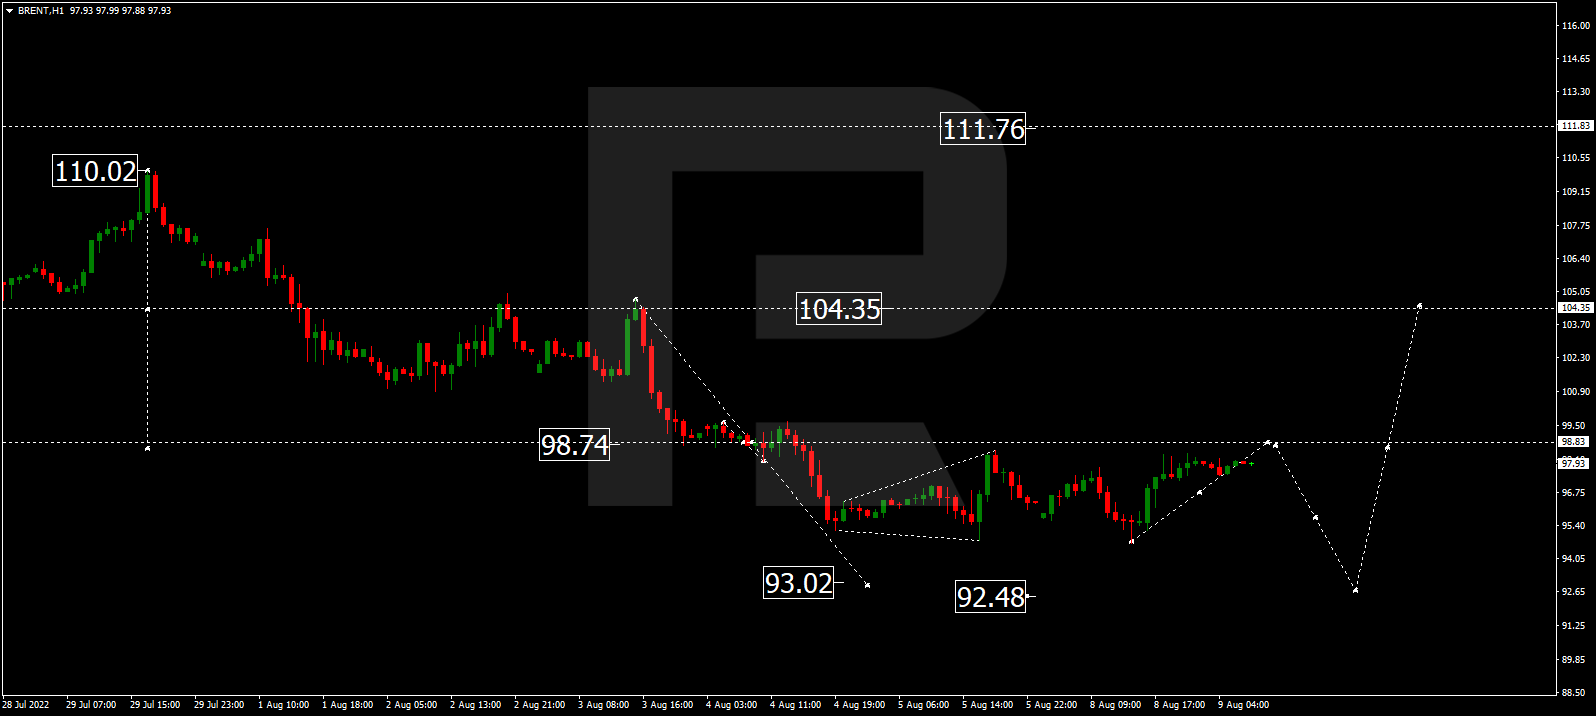
Brent is still consolidating around 96.90. Today, the asset may grow to test 98.88 from below and then start a new decline with the target at 93.00, or even extend this structure down to 92.50.
XAUUSD, “Gold vs US Dollar”
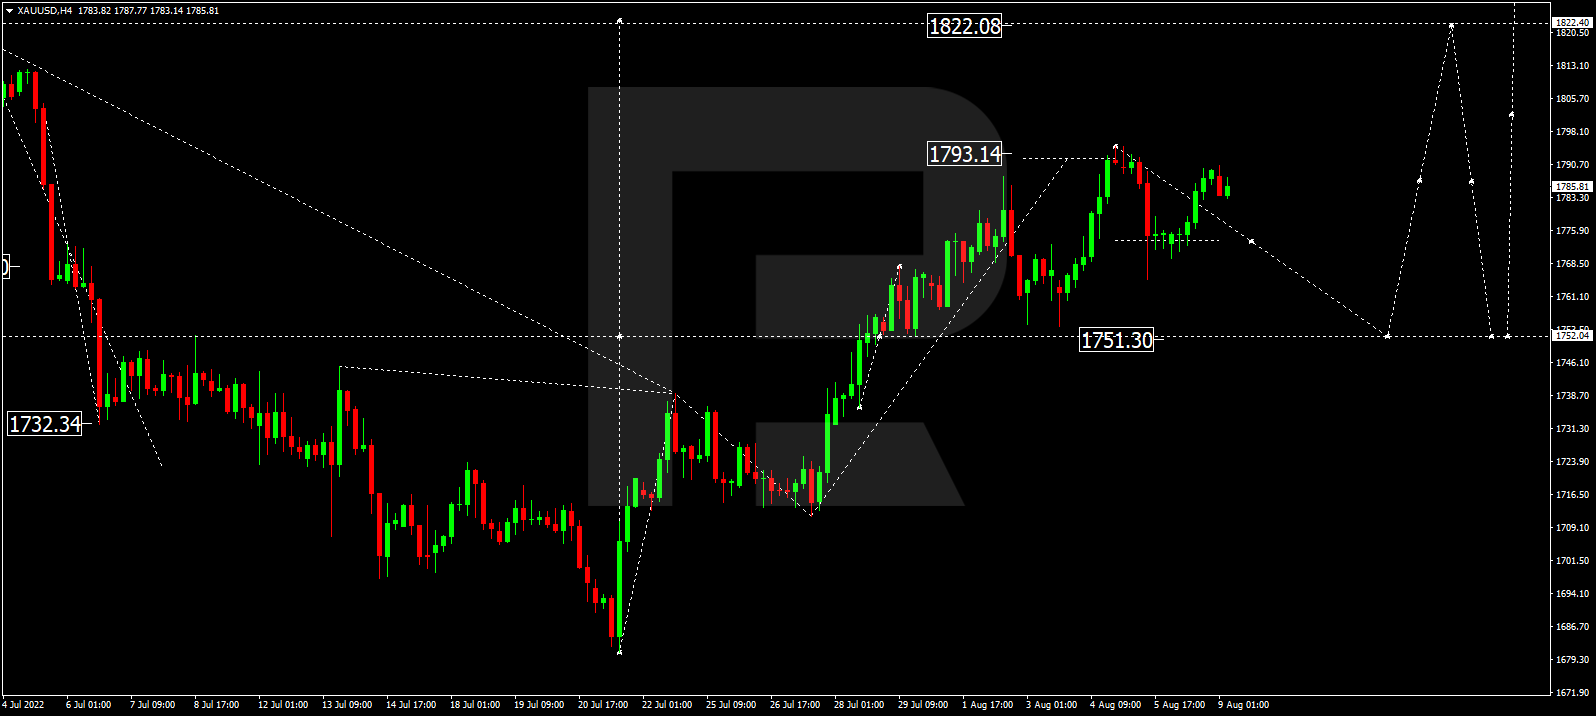
Gold is still consolidating around 1774.00. Possibly, today the metal may correct down to 1752.00. After that, the instrument may resume trading upwards with the target at 1790.00, or even extend this structure up to 1822.40.
S&P 500
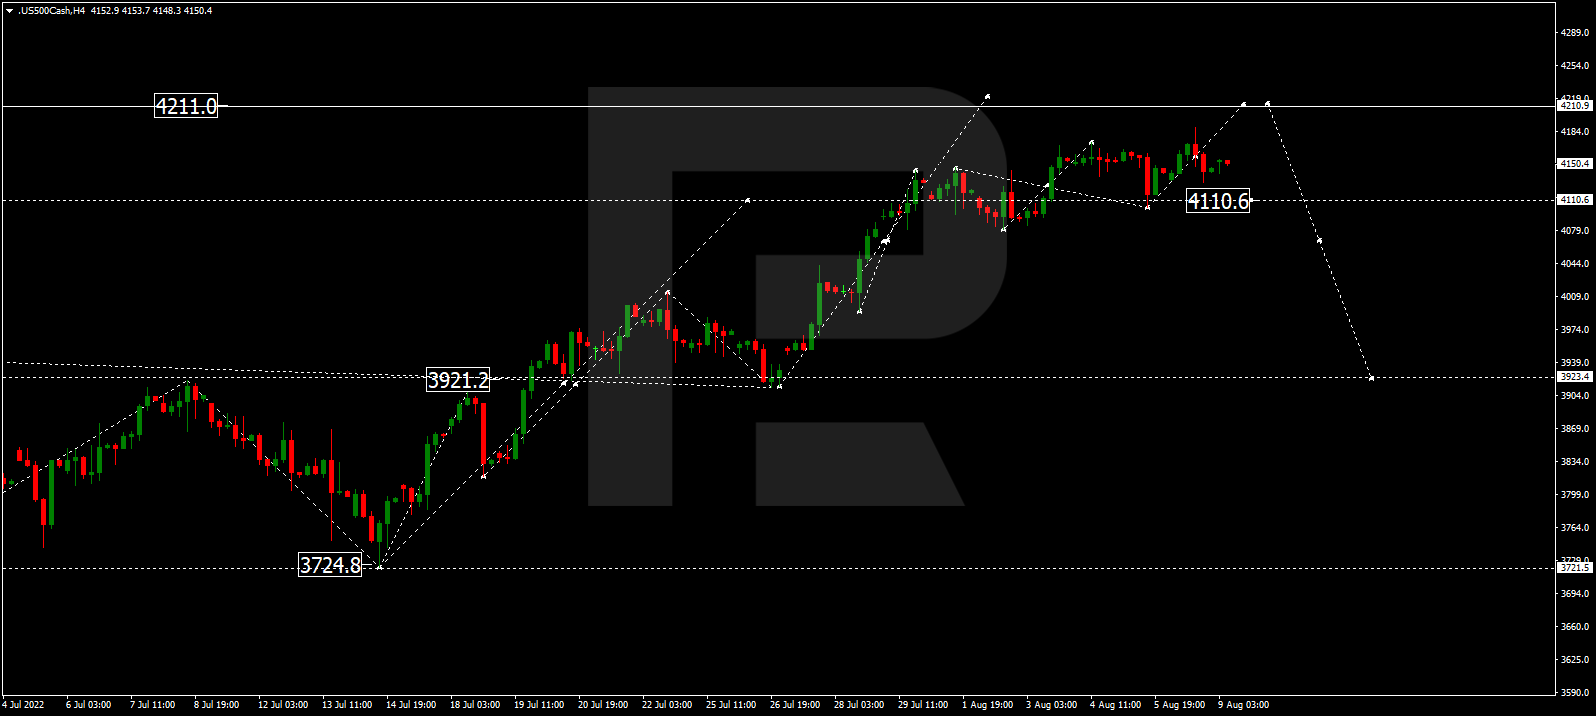
The S&P index continues consolidating above 4110.0. Possibly, the asset may expand the range up to 4211.0. Later, the market may resume trading downwards to break 4070.0 and then continue falling with the first target at 3923.4.
Attention! Forecasts presented in this section only reflect the author’s private opinion and should not be considered as guidance for trading. RoboForex LP bears no responsibility for trading results based on trading recommendations described in these analytical reviews.
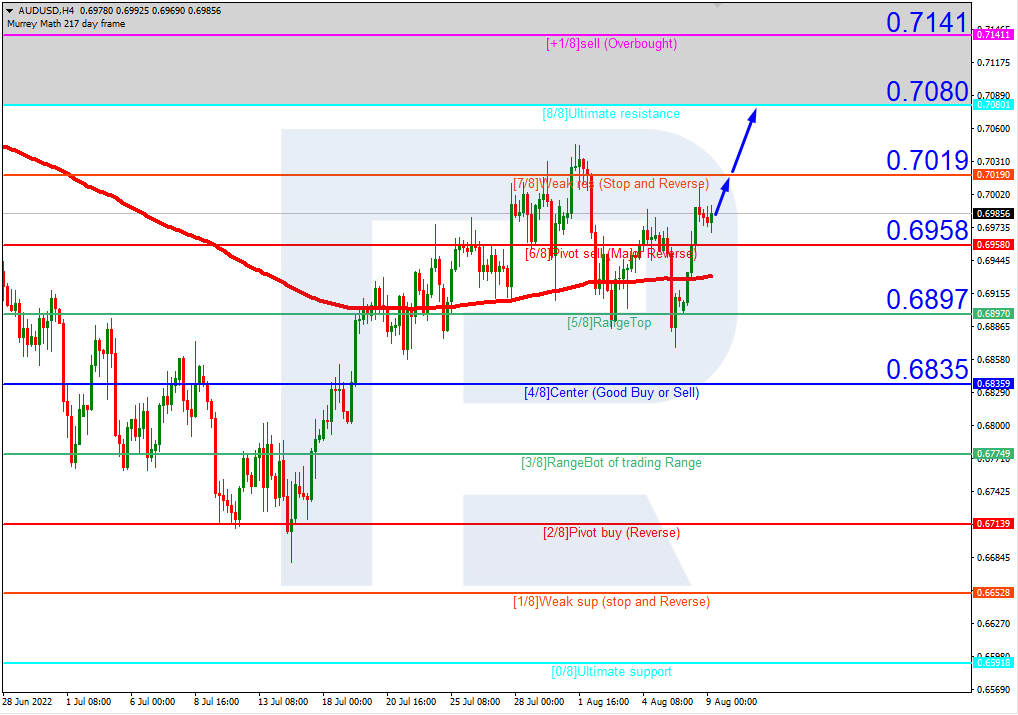
In the H4 chart, after breaking the 200-day Moving Average, AUDUSD is trading above it, thus indicating an ascending tendency. In this case, the price is expected to break 7/8 and continue growing to reach the resistance at 8/8. However, this scenario may no longer be valid if the price breaks 6/8 to the downside. After that, the instrument may reverse and resume falling to return to the support at 4/8.
As we can see in the M15 chart, the pair has broken the upside line of the VoltyChannel indicator and, as a result, may continue moving upwards.
NZDUSD, “New Zealand Dollar vs US Dollar”
In the H4 chart of NZDUSD, the situation is similar. after breaking the 200-day Moving Average, NZDUSD is trading above it to indicate a possible ascending tendency. In this case, the price is expected to break 6/8 and continue moving upwards to reach the resistance at 8/8. On the other hand, this scenario may no longer be valid if the price breaks the support at 5/8 to the downside. After that, the instrument may continue falling towards 3/8.
As we can see in the M15 chart, the pair has broken the upside line of the VoltyChannel indicator and, as a result, may continue its growth to reach 8/8 from the H4 chart.
Attention! Forecasts presented in this section only reflect the author’s private opinion and should not be considered as guidance for trading. RoboForex LP bears no responsibility for trading results based on trading recommendations described in these analytical reviews.
According to Refinitiv, investors are considering a 69% chance that the Fed will raise rates by 75 basis points at its September meeting. The US dollar is supported by a combination of stronger US economic data and hawkish comments from regional Fed presidents, which have prompted market participants to abandon expectations of dovish Fed policy. According to strategists at Deutsche Bank, it’s too early to think about the peak of the Fed’s tightening cycle. For now, traders’ main focus is on US inflation data, which will be released on Wednesday. Analysts expect annual inflation to remain about the same. But the unexpected rise in CPI may lead to further growth in government bond yields and the US dollar.
Trading recommendations
Support levels: 1.0176, 1.0146, 1.0112, 1.0035, 1.0000
From the technical point of view, the trend on the EUR/USD currency pair on the hour time frame is bullish. The price is still forming a wide volatile balance with the borders of 1.0112-1.0284. Under such market conditions, buy trades are best to consider on intraday time frames from the support level of 1.0176. Sell trades can be considered from the resistance level of 1.0227 or 1.0245, but only after additional confirmation and only with short targets.
Alternative scenario: if the price breaks down through the 1.0112 support level and fixes below, the downtrend will likely resume.
There is no news feed for today.
The GBP/USD currency pair
Technical indicators of the currency pair:
Prev Open: 1.2067
Prev Close: 1.2075
% chg. over the last day: +0.07%
Four weeks before Britain gets a new Prime Minister, Liz Truss is so far ahead in the polls that she thinks it’s time for Rishi Sunak to step down so she can work faster on the crises Britain is facing, including the looming recession and declining living standards. In addition to these problems, Britain’s largest electricity distribution company has announced that the £280 million damage from the bankruptcy of energy companies will be passed on to consumers. Thus, consumers will receive a double blow. This will undoubtedly harm consumer confidence and reduce business activity.
From the technical point of view, the trend on the GBP/USD currency pair on the hour time is bullish, but on Friday, the price broke through the priority change level but failed to consolidate below, forming a false break down. The MACD indicator becomes inactive. If the price holds below 1.2063 again, a trend will change. At the moment, it is better to look for buy trades on the intraday time frames from the support level of 1.2063, but only with a confirmation. Sell trades can be considered from the resistance level of 1.2105, but only after additional confirmation and with short targets.
Alternative scenario: if the price breaks down through the 1.2063 support level and fixes below, the downtrend will likely resume.
There is no news feed for today.
The USD/JPY currency pair
Technical indicators of the currency pair:
Prev Open: 135.03
Prev Close: 135.02
% chg. over the last day: -0.01%
The situation on the USD/JPY currency pair remains unchanged, and there is nothing to add. The Bank of Japan’s ultra-soft monetary policy to support economic recovery has left the Japanese yen behind other G-10 currencies, while the US Federal Reserve is aggressively tightening monetary policy and raising interest rates aggressively. The Japanese government is already discussing a change in monetary policy, but so far, it’s all just talk. Analysts predict that the Bank of Japan will leave things as they are until the end of the year.
Trading recommendations
Support levels: 134.29, 133.42, 132.12, 131.37, 130.85
Resistance levels: 135.29, 136.03, 137.11
From the technical point of view, the medium-term trend on the USD/JPY currency pair is close to changing to the uptrend. The price is now trading at the priority change level but has not yet consolidated higher. A break of 135.29 will change the trend. Under such market conditions, buy trades can be sought from the support level of 134.29 or 133.42, but with additional confirmation. Resistance levels of 135.29 may be considered for sell deals, but only with additional confirmation in the form of a reverse initiative, as the price has already tested it.
Alternative scenario: If the price fixes above 135.29, the uptrend will likely resume.
There is no news feed for today.
The USD/CAD currency pair
Technical indicators of the currency pair:
Prev Open: 1.2930
Prev Close: 1.2855
% chg. over the last day: -0.58%
The Canadian dollar is a commodity currency, so it depends not only on the monetary policy of the Bank of Canada but also on the USD Index and oil price movements. The dollar index traded without significant changes yesterday, while oil prices increased by 2%. A jump in oil prices gave confidence to the Canadian currency, which has strengthened a bit. The Bank of Canada and the US Federal Reserve keep interest rates at 2.5% so that parity will prevail in the USD/CAD currency pair with a short-term shift of initiative from the dollar to the Canadian and vice versa.
In terms of technical analysis, the USD/CAD currency pair trend has changed to bullish. The price confidently broke through the priority change level and consolidated above. But yesterday, against the background of rising oil prices, the USD/CAD prices dropped below the moving lines again and did it aggressively. The MACD indicator became negative with signs of sellers’ pressure. Under such market conditions, buy trades should be considered on the lower time frames from the support level of 1.2802, but only with confirmation and short targets. For sell deals, it is better to consider the resistance level of 1.2895 or 1.2926, but with confirmation.
Alternative scenario: if the price breaks out and consolidates below the 1.2786 support level, the downtrend will likely resume.
This article reflects a personal opinion and should not be interpreted as an investment advice, and/or offer, and/or a persistent request for carrying out financial transactions, and/or a guarantee, and/or a forecast of future events.
Farmers are adopting precision agriculture, using data collected by GPS, satellite imagery, internet-connected sensors and other technologies to farm more efficiently. While these practices could help increase crop yields and reduce costs, the technology behind the practices is creating opportunities for extremists, terrorists and adversarial governments to attack farming machinery, with the aim of disrupting food production.
Food producers around the world have been under increasing pressure, a problem exacerbated by the war in Ukraine and rising fuel and fertilizer costs. Farmers are trying to produce more food but with fewer resources, pushing the food production system toward its breaking point.
In this environment, it’s understandable that many U.S. farmers are turning to modern information technologies to support decision-making and operations in managing crop production. These precision agriculture practices lead to more efficient use of land, water, fuel, fertilizer and pesticides so that farmers can grow more, reduce costs and minimize their impact on the environment.
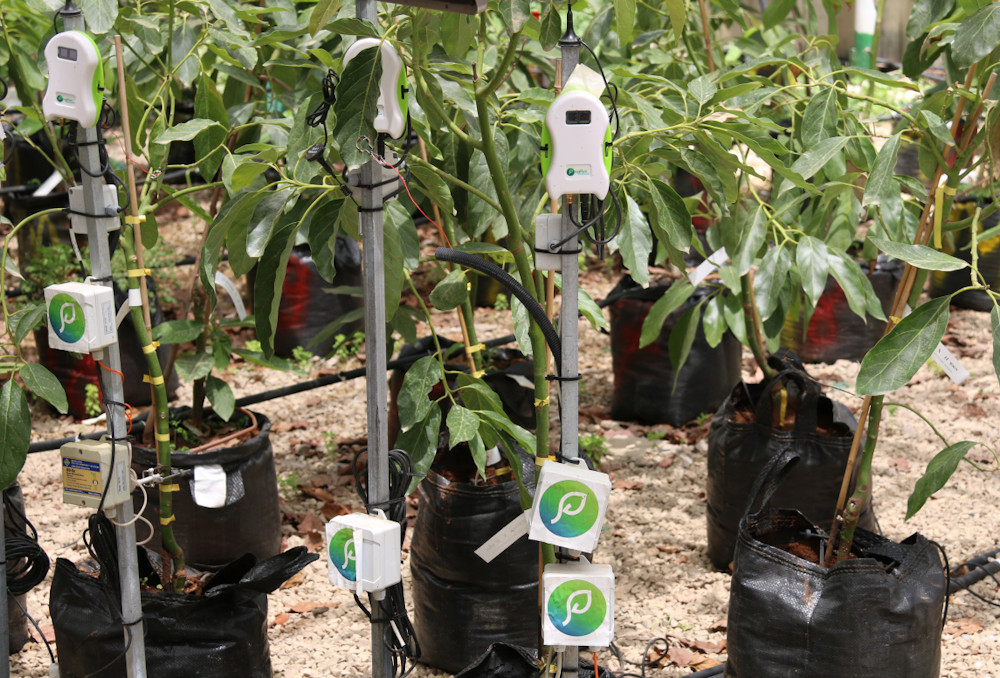
Precision agriculture can include sensors that monitor crops, such as these avocado plants. Simple loquat/Wikimedia
Cyberattacks against agricultural targets are not some far-off threat; they are already happening. For example, in 2021 a ransomware attack forced a fifth of the beef processing plants in the U.S. to shut down, with one company paying nearly $11 million to cybercriminals. REvil, a Russia-based group, claimed responsibility for the attack.
Similarly, a grain storage cooperative in Iowa was targeted by a Russian-speaking group called BlackMatter, who claimed that they had stolen data from the cooperative. While previous attacks have targeted larger companies and cooperatives and aimed to extort the victims for money, individual farms could be at risk, too.
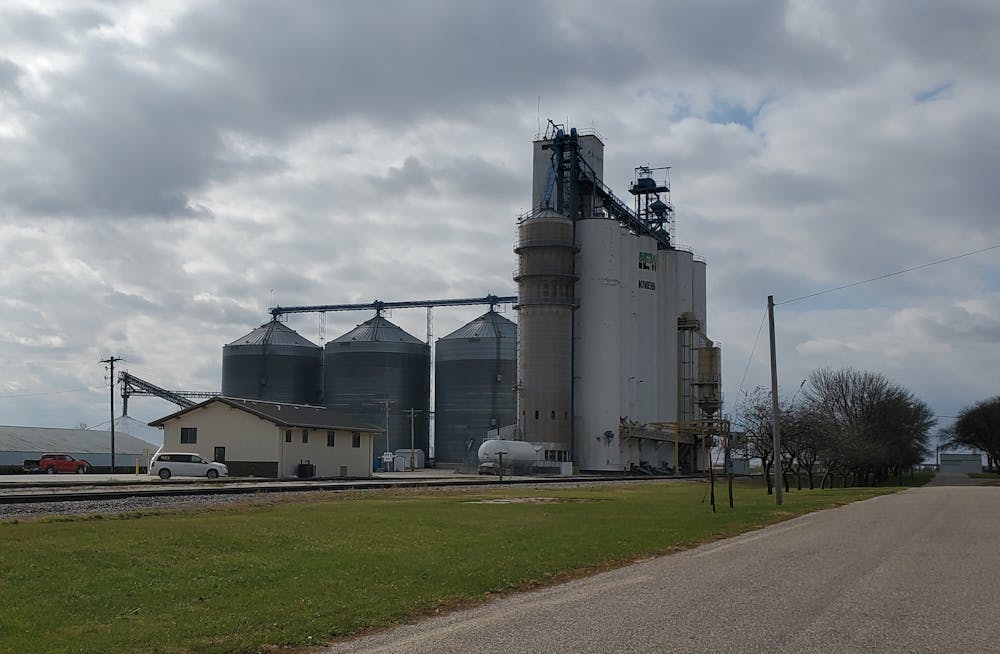
This grain storage facility is run by New Cooperative, a farm cooperative in Iowa that was hit by a ransomware attack in 2021. Jstuby/Wikimedia
The integration of technologies into farm equipment, from GPS-guided tractors to artificial intelligence, potentially increases the ability of hackers to attack this equipment. And though farmers might not be ideal targets for ransomware attacks, farms could be tempting targets for hackers with other motives, including terrorists.
For example, an attacker could look to exploit vulnerabilities within fertilizer application technologies, which could result in a farmer unwittingly applying too much or too little nitrogen fertilizer to a particular crop. A farmer could then end up with either a below-expected harvest, or a field that has been over fertilized, resulting in waste and long-term environmental ramifications.
Disruption to sensitive industries and infrastructure gives attackers higher returns for their efforts. This means that the increasing stress on the global food supply raises the stakes and creates a stronger motivation to disrupt the U.S. agriculture sector.
Unlike other critical industries such as finance and health care, the farming industry has been slow to recognize cybersecurity risks and take steps to mitigate them. There are several possible reasons for this sluggishness.
One is that many farmers and agricultural providers haven’t viewed cybersecurity as a significant enough problem compared with other risks they face such as floods, fires and hail. A 2018 Department of Homeland Security report that surveyed precision agriculture farmers throughout the U.S. found that many did not fully understand the cyberthreats introduced by precision agriculture, nor did they take these cyber-risks seriously enough.
This lack of preparedness leads to another reason: limited oversight and regulation from government. In 2010, the U.S. Department of Agriculture classified cybersecurity as a low priority. While this classification was upgraded in 2015, the farming sector is likely to be playing catch-up for years. While other critical infrastructure industries have developed and published numerous countermeasures and best practices for cybersecurity, the same cannot be said for the farming sector.
In addition to the pressing need for policy guidance and resources from federal, state and local governments to prevent this type of cyberattack, there is room for academia and industry to step up.
From an academic research perspective, multidisciplinary efforts that bring together researchers from precision agriculture, robotics, cybersecurity and political science can help identify potential solutions. To this end, we and researchers at the University of Nebraska-Lincoln have launched the Security Testbed for Agricultural Vehicles and Environments.
Farming equipment manufacturers and other industry organizations can help by designing and engineering equipment to account for cybersecurity considerations. This would lead to the manufacture of farming equipment that not only maximizes food production yields but also minimizes exposure to cyberattacks.
The US stock indices traded mixed on Monday. By the close of trading, the Dow Jones index (US30) increased by 0.09%, while the S&P 500 (US500) decreased by 0.12%. The NASDAQ Technology Index (US100) lost 0.10% yesterday.
Tesla (TSLA) added 1%, driving consumer stocks higher as sentiment about electric vehicles was boosted by a new climate bill passed by the US Senate over the weekend. It includes nearly $400 billion over a 10-year period to fund energy-related programs and expand and improve existing tax credits for electric vehicles.
Nvidia Corporation (NVDA) fell more than 8% after the chip maker reported second-quarter revenue of $6.7 billion, well below its estimate of $8.1 billion, with the company lowering its revenue forecast for the third quarter.
In the US, consumer confidence in the housing market fell to its lowest level since 2011 as both prospective buyers and sellers became more pessimistic. According to Fannie Mae’s monthly survey, only 17% of those surveyed in July said it was a good time to buy a home, down from 20% in June.
Stock markets in Europe mostly rose on Monday. Germany’s DAX (DE30) gained 0.84%, France’s CAC 40 (FR40) added 0.80%, Spain’s IBEX 35 (ES35) jumped by 1.28%, and the British FTSE 100 (UK100) closed higher by 0.57% yesterday.
Britain’s largest electricity distributor said that the damages of 280 million pounds sterling from the bankruptcy of energy companies would be shifted to consumers.
Yesterday, the German government spokesman said that Germany faces difficult months, but the country supports Ukraine and sanctions against Russia.
Goldman Sachs analysts said they believe the case for higher oil prices remains strong as the market faces larger shortages than they expected in recent months.
Gold prices maintained their recent gains as volatility in stock markets ahead of this week’s US inflation data boosted demand for the yellow metal. Gold and silver prices are inversely correlated with the dollar index and US government bond yields. Therefore, a decline in the dollar is usually accompanied by a rise in gold prices and vice versa. The focus now is on US consumer price data for July, which will be published on Wednesday. Analysts expect inflation to likely remain at a 40-year high in the coming months, necessitating further monetary tightening by the Fed. An unexpected rise in CPI could push up the dollar index and yields, negatively impacting gold and silver prices.
Asian markets traded flat yesterday. Japan’s Nikkei 225 (JP225) gained 1.26%, Hong Kong’s Hang Seng (HK50) was down by 0.77%, and Australia’s S&P/ASX 200 (AU200) added 0.07%.
Tensions between China and Taiwan eased slightly after China announced the end of military exercises around the island. At the same time, Taiwan’s defense ministry said Chinese planes and ships never entered Taiwan’s territorial waters.
The NAB Australia Business Confidence Index showed that inflationary pressures continue to rise, indicating that inflation has not yet peaked. But business activity remains strong despite global and domestic economic headwinds. Analysts believe the strong economic data will allow the RBA to raise interest rates another 0.5% at its next meeting on September 6.
S&P 500 (F) (US500) 4,140.06 −5.13 (−0.12%)
Dow Jones (US30) 32,832.54 +29.07 (+0.089%)
DAX (DE40) 13,687.69 +113.76 (+0.84%)
FTSE 100 (UK100) 7,482.37 +42.63 (+0.57%)
USD Index 106.41 −0.21 (−0.20%)
Important events for today:
– Australia NAB Business Confidence (m/m) at 04:30 (GMT+3).
This article reflects a personal opinion and should not be interpreted as an investment advice, and/or offer, and/or a persistent request for carrying out financial transactions, and/or a guarantee, and/or a forecast of future events.













 Article by