US Federal Reserve officials tried to temper expectations for looser policy, and Neel Kashkari said at a conference on Wednesday that the Central Bank is a long way from declaring victory. Kashkari also added that the Central Bank’s proposal to cut interest rates early next year is unrealistic. In an interview with the Financial Times, San Francisco Fed President Mary Daly also warned that it is too early for the US Central Bank to “declare victory” in the fight against inflation. Amid such comments, stock indices fell slightly. At the close of the stock market yesterday, the Dow Jones Index (US30) added 0.08%, while the S&P 500 Index (US500) was down 0.07%. The NASDAQ Technology Index (US100) lost 0.58%.
The slowdown in US inflation may have opened the door for the Federal Reserve to soften the pace of the coming interest rate hikes, but policymakers left no doubt that they will continue to tighten monetary policy until price pressures are fully resolved. At this point, traders of federal funds futures contracts currently estimate a 66% chance of a 50 basis point hike and a 34% chance of a 75 basis point hike in September. Calling inflation “unacceptably high,” Chicago Fed President Charles Evans said he thinks the Fed will probably need to raise the rates to 3.25-3.5% this year and 3.75-4% by the end of next year.
Equity markets in Europe traded yesterday without a single dynamic. German DAX (DE30) decreased by 0.05%, French CAC 40 (FR40) added 0.33%, Spanish IBEX 35 (ES35) gained 0.33%, British FTSE 100 (UK100) was down by 0.55%.
European futures on gas exceeded $2350 per thousand cubic meters. Energy carriers are getting more expensive amid unprecedented heat waves in Europe. High temperatures caused unexpected strain on the region’s power grids, boosting the demand for electricity to power fans and air conditioners. Oil is in increasing demand in this environment as power plants seek alternatives to expensive gas. The International Energy Agency (IEA) raised its forecast for oil demand this year by 380,000 BPD. Normally, the IEA is negative on oil demand, but rising global natural gas prices may encourage more energy consumers to switch to oil for winter heating.
Meanwhile, the Organization of the Petroleum Exporting Countries (OPEC), which usually does its best to boost oil prices, has lowered its forecast for global oil demand growth for 2022. OPEC said it expects oil demand to grow by 3.1 million BPD in 2022, down 260,000 BPD from its previous forecast. Goldman Sachs analysts again forecast an oil price above $130 a barrel by the end of the year.
Gold futures closed lower Thursday as a three-week rally in the precious metal’s prices halted, and investors shifted their attention to the rising US stock market rather than safe-haven assets such as gold and the dollar.
The Latvian Saeima declared Russia a sponsor of terrorism. Earlier, the US Senate passed a resolution urging the State Department to recognize Russia as a state sponsor of terrorism because of the events in Ukraine, Chechnya, Georgia, and Syria. A ban on issuing Schengen visas to all Russians could be part of the seventh package of European sanctions against Russia. EU countries are now discussing the issue.
Asian markets were trading up yesterday. Japan’s Nikkei 225 (JP225) was not trading due to the bank holiday, Hong Kong’s Hang Seng (HK50) added 2.40%, while Australia’s S&P/ASX 200 (AU200) ended the day up by 1.12%. But Asian stocks started declining at the open on Friday amid a new blockage in China. China’s economy is still reeling from a series of economically devastating quarantine restrictions imposed earlier this year, and investors are wary of further such measures. Quarantine in a major commodity center such as Yiwu could cause further problems for China’s industrial sector, which unexpectedly contracted in July.
S&P 500 (F) (US500) 4,207.27 −2.97 (−0.071%)
Dow Jones (US30) 33,336.67 +27.16 (+0.082%)
DAX (DE40) 13,694.51 −6.42 (−0.047%)
FTSE 100 (UK100) 7,465.91 −41.20 (−0.55%)
USD Index 105.19 −0.01 (−0.01%)
Important events for today:
– UK GDP (m/m) at 09:00 (GMT+3);
– UK Industrial Production (m/m) at 09:00 (GMT+3);
– Eurozone Industrial Production (m/m) at 12:00 (GMT+3);
– US Michigan Consumer Sentiment (m/m) at 17:00 (GMT+3).
This article reflects a personal opinion and should not be interpreted as an investment advice, and/or offer, and/or a persistent request for carrying out financial transactions, and/or a guarantee, and/or a forecast of future events.
The Research Brief is a short take about interesting academic work.
The big idea
Women in statistics classes do better academically than men over a semester despite having more negative attitudes regarding their own abilities, according to our recent study in the Journal of Statistics and Data Science Education.
Using data from more than 100 male and female students from multiple statistics classes, my colleagueand I assessed gender differences in grades over the course of a semester. As part of the study, students also answered surveys at the start and end of the semester that measured six different things: their fear of statistics teachers in general; their thoughts about the usefulness of statistics; their perceptions of their own mathematical ability; their anxiety in taking tests; their anxiety in interpreting statistics; and their fear of asking for help.
Overall, we found that students with more negative perceptions of their own mathematical ability had lower grades over the course of the semester. What’s even more interesting are the gender differences that emerged.
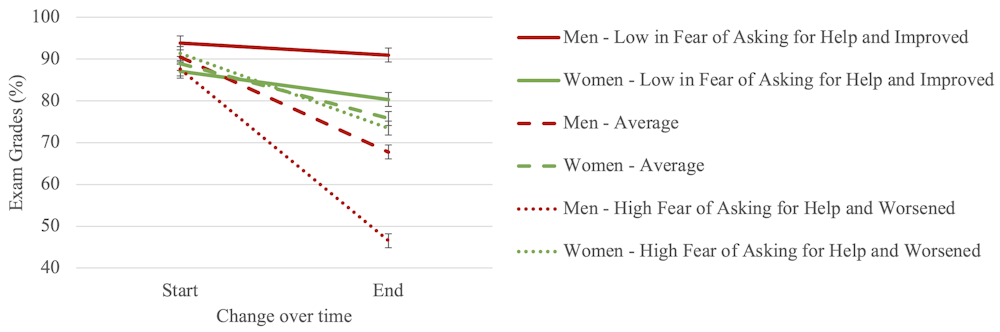
Even though men and women scored similarly on exams at the start of the semester, women finished the semester with almost 10% higher final exam grades. This was the case even though women had significantly worse attitudes about their mathematical abilities at the start of the semester than their male counterparts.
At the beginning of the semester specifically, women were more likely to rate their mathematical abilities as lower than men in the class and report more anxiety toward exams and toward interpreting statistical findings. However, each of these self-assessments improved over the course of the semester such that women’s attitudes didn’t differ from men’s by the end.
Meanwhile, the grades of male students who reported fear of statistics teachers or fear of asking for help decreased more sharply over the course of the semester. For men whose attitudes improved during the semester, grades also improved – though not as much as women’s grades improved.
Figure reflecting the effect of fear of asking for help and its change over time among women and men. Average grades decreased overall across the semester, likely because of coursework getting more challenging over time. Jonathan Santo, Author provided
The results from our study, in line with others, bolster the notion that women have the potential to do as well as men, and even better, in STEM fields, such as statistics. We contend that women would benefit from additional mentoring to encourage them as they begin pursuing STEM-related education.
Undergraduate students at the University of Nebraska Omaha collaborate on a group assignment for a STEM course. Derrick Nero, University of Nebraska Omaha, CC BY-NC-ND
What still isn’t known
The evidence above provides hints at some of the causes of the gender discrepancy in perceived ability. However, there is much we still don’t know.
For example, why did the attitudes of the women in our study improve over time? Was it based on their confidence in their abilities as their grades improved, or did their statistics teachers influence their perception of their own abilities over time?
More research is needed to understand exactly how women differed from men in their attitudes over the course of the school semester, among other questions. In particular, we’d like to disentangle exactly which classroom or instructor factors can lead to better attitudes among students, ultimately translating to better grades.
Speaker Nancy Pelosi’s visit to Taiwan has elicited a strong response from China: three days of simulated attack on Taiwan with further drills announced, plus a withdrawal from critical ongoing conversations with the US on climate change and the military.
This strong reaction was predictable. President Xi had earlier warned President Biden not “to play with fire”. Of course, if Pelosi’s visit hadn’t gone ahead, the Biden administration would have faced a strong reaction from both parties in Congress for not standing up to China’s threat to Taiwan or human rights issues regarding Tibet and Xinjiang, not to mention Hong Kong.
So where does it leave trade between the world’s two leading powers?
How business trumped ideology
Consider the not-too-distant past. The US supported the Republic of China against Japan in the Pacific war of 1941-45. When the Chinese leadership fled to Taiwan in 1949 following the victory of Mao Zedong’s communists in the Chinese civil war, Washington continued to recognise the exiled regime as China’s legitimate government, blocking the People’s Republic of China (PRC) from joining the United Nations.
This shifted in 1972 following President Nixon’s historic visit to China (in a move to isolate the Soviets). The US now recognised the PRC as China’s sole government and accepted its One China policy. It downgraded its Taiwan relations to merely informal, while affirming a peaceful settlement to the mainland communists’ claim that this was a breakaway province that had to be assimilated.
President Richard Nixon meeting Chairman Mao Zedong in Peking (Beijing) in 1972. manhhai, CC BY-SA
This opened US-China trade, ending a US trade embargo in place since the 1940s. Economic ties proliferated in the 1980s under Mao’s eventual successor, Deng Xiaoping, helping the Chinese economy to multiply while the US enjoyed lower consumer prices and a stronger stock market.
Western manufacturing firms either outsourced to Chinese firms or set up operations themselves. They benefited from cheaper production and – for those outsourcing – not having to own factories or deal with labour issues. In turn, the Chinese gained tremendous manufacturing capability.
As China’s middle class grew wealthier, the country became a major target consumer market for US firms such as Apple and GM. The Chinese authorities insisted this was done through local partner firms, transferring technology in the process and further enhancing the nation’s manufacturing know-how.
The growing Chinese threat
China and the US captured more than half the growth in GDP across the world from 1980 to 2020. US GDP grew nearly five times from US$4.4 trillion (£3.6 trillion) to US$20.9 trillion (£17.3 trillion) in today’s money, while China’s grew from US$310 billion to US$14.7 trillion.
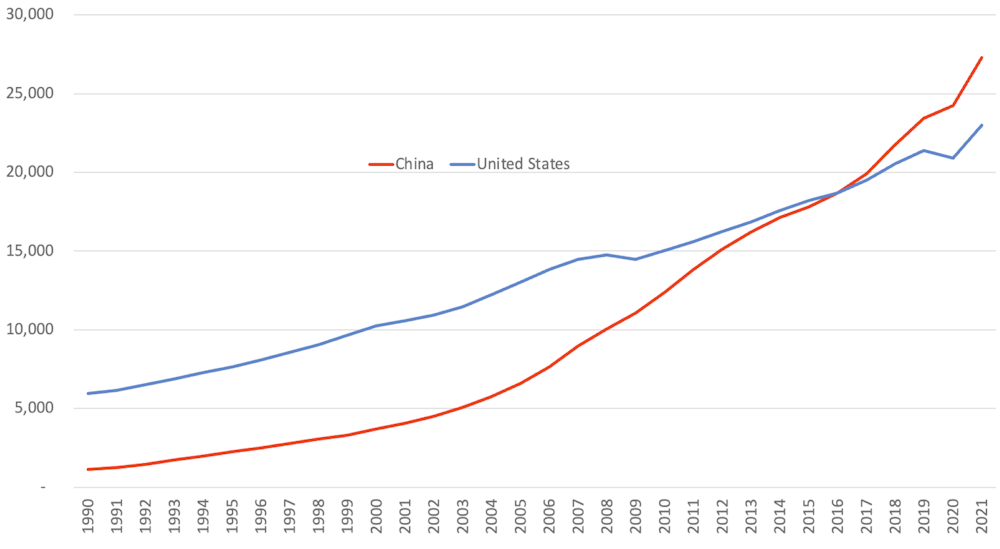
China is now the second largest economy, although the IMF, World Bank and CIA consider it the largest once purchasing power is taken into account (see chart below). The US is still well ahead on per capita income (US$69,231 vs US$12,359 in 2021), though China’s is now that of a “developed” country, having lifted 800 million people out of poverty in the process.
The US has become increasingly concerned about China’s faster economic growth and the fact that the US buys much more from its rival than the other way around. This drove the big decline in US domestic manufacturing that famously helped Donald Trump to win the US presidency.
Chinese and US GDP based on purchasing power parity 1990-2021
World Bank
Equally, the rivalry has extended to other areas as China has sought a leading role on the world stage. Both nations are nuclear powers, although the Chinese military has only 350 nuclear warheads to America’s 5,500.
China has a larger navy, with some 360 battle force ships compared to the US 297, although China’s are mostly smaller – only three aircraft carriers compared to America’s 11, for example. The two countries are also competing in space to bring astronauts to the Moon and establish the first lunar base.
All this has threatened American dominance, while President Xi has also been much more forthright both domestically and internationally than any Chinese leader since Mao. The US has gradually become more hostile, starting with President Obama’s pivot towards other Asian nations in 2016 and then President Trump’s public complaints and eventual sanctioning of China’s “unfair” trade practices.
When President Biden took office in 2021, he began highlighting long-simmering complaints about human rights issues in Xinjiang and the threat to Taiwan (while still endorsing the One China Policy). He also imposed sanctions on certain Chinese companies of a kind not been seen since the Mao-era trade embargo.
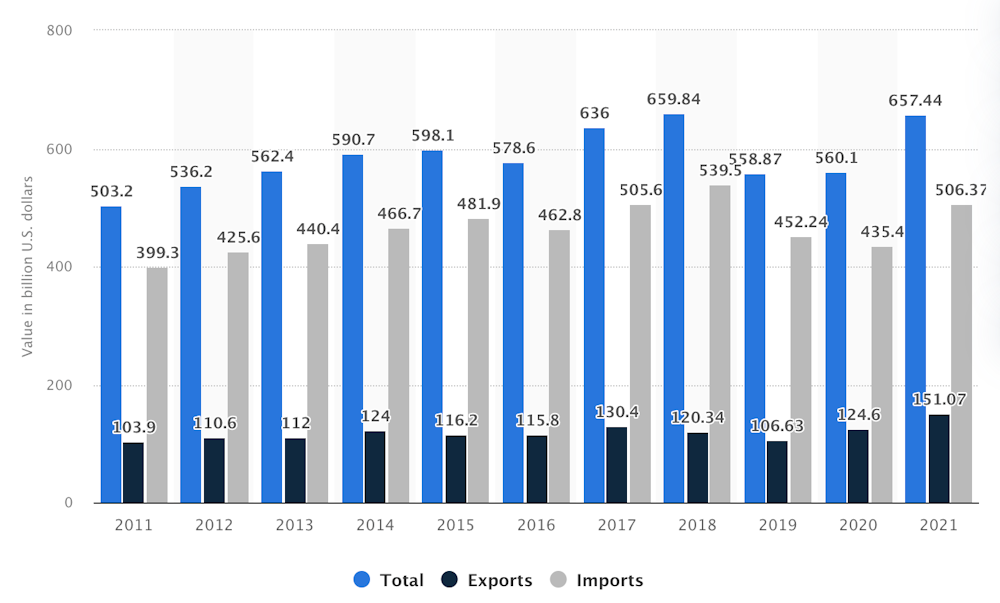
US trade in goods to China 2011-21
Note the US trade in services to China is about one-tenth that of goods. In 2020 the US exported US$40 billion in services to China and imported US$16 billion. Statista
Biden also banned goods from China’s Xinjiang region on the grounds of forced labour in 2022, affecting the purchasing of goods by many western companies. China reportedly moved workers to other parts of the country to enable western companies to keep purchasing.
Bipolarity is back
COVID-19 further increased the distance between the two countries. After China’s zero COVID policy helped to disrupt supply chains and cause product shortages, the Biden administration began calling for reduced dependency on its rival.
US firms have duly been restructuring their supply chains. In June, Apple moved some iPad production from China to Vietnam, albeit also because of growing demand in south-east Asia.
Near-shoring to Mexico is gaining momentum. Apple manufacturers Foxconn and Pegatron are considering producing iPhones for North America in Mexico rather than China to take advantage of lower labour costs and the free-trade agreement between the US and Mexico.
Two global blocs are increasingly emerging, with US treasury secretary Janet Yellen in April calling for “friend-shoring” with trusted partners, dividing countries into friends or foes. The Biden administration announced at the June G7 meeting a new “Partnership for Global Infrastructure and Investment”. Aiming to mobilise US$600 billion in investments over five years, this is an overture to various developing countries already being courted by China under its similar Belt and Road Initiative.
Days earlier, China had hosted the annual BRICS summit, which includes Brazil, Russia, India and South Africa. It welcomed leaders from 13 other countries: Algeria, Argentina, Egypt, Indonesia, Iran, Kazakhstan, Senegal, Uzbekistan, Cambodia, Ethiopia, Fiji, Malaysia and Thailand. Xi urged the summit to build a “global community of security” based on multilateral cooperation. Iran and Argentina have since applied to join the bloc.
We are already seeing what bipolarity will mean for vital components and commodities. In nanochips, the US is leading a “chips 4” pact with Japan, Taiwan and possible South Korea to develop next-generation technologies and manufacturing capacity. China is investing US$1.4 trillion between 2020 and 2025 in a bid to become self-reliant in this technology.
Another big issue is cobalt, which is essential for making lithium batteries for electric vehicles. To secure supply from the Democratic Republic of the Congo, which produces 70% of world reserves, China has navigated Congolese politics, lobbying powerful politicians in mining regions. By 2020, Chinese firms owned or had a stake in 15 of the DRC’s 19 cobalt-producing mines.
As China hoards cobalt supplies, the US seeks alternatives. GM is developing its Ultium battery cell, which needs 70% less cobalt than today’s batteries, while Oak Ridge National Laboratory is developing a battery that doesn’t need the metal at all.
Silver linings
As US-China relations have moved from building bridges in 1972 to building walls in 2022, countries will increasingly be forced to choose sides and companies will have to plan supply chains accordingly. Those seeking to trade in both blocs will need to “divisionalise”, running parallel operations.
American companies wanting to serve Chinese consumers will still need to manufacture in China or other nations within that bloc, while Chinese companies will need to do the same in reverse. Interestingly, Chinese companies have been rapidly buying farmland and agriculture-based companies in the US and elsewhere.
Yet though the new supply chains will almost certainly increase costs for western consumers and dampen China’s growth, there will be benefits. Supply chains should be more resilient to future crises and also more transparent, while reduced transportation (and reliance on Chinese coal) should cut carbon emissions. This should help to meet the UN Sustainable Development Goals on environmental and social sustainability.
The cobalt and nanochips examples also show how the US-China rivalry is catalysing innovation. And importantly, global trade will continue growing as countries depend on each other, even as trade links change.
It will certainly take time to find an equilibrium. It took years for the USSR and US to figure out how to co-exist without getting into direct military conflict. Hillary Clinton wrote in 2011 as Secretary of State that “there is no handbook for the evolving US-China relationship”, and that remains the case today.
At any rate, the businesses that thrive in this new environment will likely be those that plan for a divided world with divisional supply chains. The recent Taiwan row will probably not lead to direct military conflict; rather it will reinforce a trend that has been gathering momentum for a decade or more.
With many nations making efforts to transition away from fossil fuels to renewable energy, SciLine interviewed Erin Baker, a professor of industrial engineering and operations at UMass Amherst. Baker discussed the technological, political and regulatory efforts needed for this transition, as well as ways that our fossil fuel-dependent system disproportionately harms poor communities and communities of color.
The Conversation has collaborated with SciLine to bring you highlights from the discussion, which have been edited for brevity and clarity.
How is our country doing at making the transition to renewable energy?
Erin Baker: There has been amazing technological change over the past 15 years. Offshore wind costs 50% less than it did six years ago. Solar has had a sixfold decrease in costs since 2010. And I think there’s a lot of evidence that technology will adapt and improve if we set the goals and incentives for it.
In terms of policy and regulations, we are moving forward, but we need to be more aggressive. Something that we’re missing and that would be really helpful would be a coherent, federal-level climate policy – whether that is regulatory policy, such as we have for pollution, or a carbon tax or some kind of a cap. The Inflation Reduction Act would be a fantastic starting point if it becomes law.
A good example of something that has been done is President Biden’s move to coordinate and streamline the federal approval process for offshore wind. There are seven federal agencies involved, and having them all separate and moving at their own pace was really difficult for offshore wind energy developers. So Biden has coordinated that, and that’s fantastic. But there are tens of local and state-level agencies and processes that developers still have to go through. It would be really great if we could figure out ways to coordinate and streamline those.
How does our current energy system disproportionately harm poor communities and communities of color?
Erin Baker: Unfortunately, in a lot of different ways. Polluting facilities tend to be located disproportionally in areas that are low income and home to people of color, which can lead to negative health outcomes. Also, in the Texas blackout last winter that killed around 250 people, some research done by my colleague Jay Teneja showed that the long blackouts were four times as likely in communities of color as in predominantly white communities. And, unfortunately, the energy transition won’t necessarily be any more equitable.
For example, it’s common for states to subsidize rooftop solar. And this is good, but the people who get the subsidies are people who own roofs with sun shining on them. People who live in apartments and in cities don’t have access to this, and yet they’re paying for the subsidies. We take the money for the subsidies from everyone, including low-income people, and send them mostly to white, wealthy suburbs.
How can injustices in our energy system be rectified?
Erin Baker: There’s obviously no one solution, but there are a couple of categories of things we can do. One thing that would be really helpful would be to collect data. We have very little data about energy equity issues.
We also need to involve and listen to the traditionally marginalized communities that are most affected by the inequities.
What do you think of the federal and state targets set for offshore wind?
Erin Baker: The Biden administration set a target for 30 gigawatts by 2030. That’s an ambitious goal, since in 2019 the entire world had only 30 GW. But it’s growing rapidly, with global capacity at an astounding 56 GW.
Having this goal of 30 gigawatts helps to organize the supply chain – all the pieces that need to get done for this to happen. We need people who know how to install offshore wind farms. We need special ships. We need planning for transmission. Having these goals really helps to organize all that and make sure all these pieces are in place.
What are the environmental costs and benefits of offshore wind?
Erin Baker: Offshore wind is a really promising technology. The ocean has really good wind resources. And it’s near population centers – we have lots of cities up and down the coasts. Because wind energy is carbon-free, it will provide benefits by reducing emissions and reducing costs.
Some of the work I’ve done has shown that there are billions, and maybe even trillions, of dollars of climate value in offshore wind. We lose between US$10 million and $150 million per year per wind farm by delaying them. We really want to keep these large global environmental benefits in mind as we plan. These can be balanced against local environmental costs and benefits, as well as other factors, like jobs.
In terms of local environmental benefits, when you build an offshore wind farm, the stuff underneath the water ends up creating an artificial reef and actually increasing sea life in that area, which is a benefit.
Negatively, they interfere with bird migrations. Birds don’t actually fly into the wind turbines that much. They fly around them. But if there are a lot of wind farms, that’s a lot of flying around, and that can be hard on the birds. And some animals, like right whales, can get caught in mooring lines if we have floating wind turbines. So, there are local environmental costs. What we need to do is balance these with the global benefits from addressing climate change.
Are you hopeful about our ability to address climate change?
Erin Baker: I am optimistic that we can solve climate change, because humans are very inventive. My work on technological change has shown that once we have a goal or incentive, we tend to improve technologies much faster than we ever predicted. So I think we can be ambitious. We can aim for net-zero by 2030 instead of 2050. And we can solve climate change while at the same time stimulating innovation, fueling growth and increasing quality of life. But we have to set these goals. To access the benefits of the energy transition, we really need to act boldly and decisively.
Watch the full interview to hear more about what’s required for a just, renewable energy transition.
SciLine is a free service based at the nonprofit American Association for the Advancement of Science that helps journalists include scientific evidence and experts in their news stories.
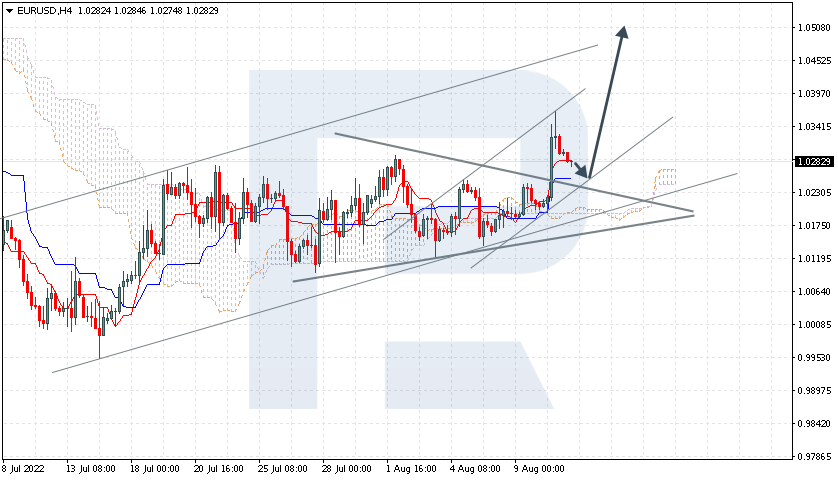
EURUSD is no longer moving inside the Triangle pattern. The instrument is currently moving above Ichimoku Cloud, thus indicating an ascending tendency. The markets could indicate that the price may test Kijun-Sen at 1.0245 and then resume moving upwards to reach 1.0505. Another signal in favour of a further uptrend will be a rebound from the rising channel’s downside border. However, the bullish scenario may no longer be valid if the price breaks the cloud’s downside border and fixes below 1.0155. In this case, the pair may continue falling towards 1.0065.
XAUUSD, “Gold vs US Dollar”
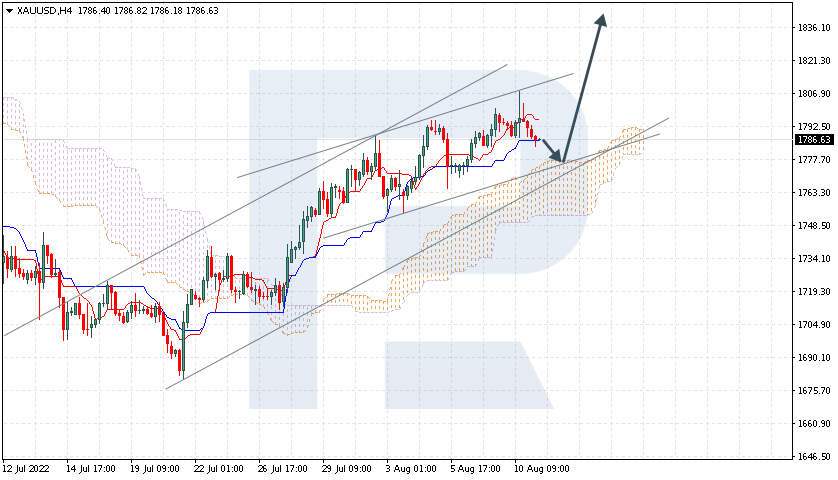
XAUUSD is testing Kijun-Sen. The instrument is currently moving above Ichimoku Cloud, thus indicating an ascending tendency. The markets could indicate that the price may test the cloud’s upside border at 1775.00 and then resume moving upwards to reach 1835.00. Another signal in favour of a further uptrend will be a rebound from the rising channel’s downside border. However, the bullish scenario may no longer be valid if the price breaks the cloud’s downside border and fixes below 1735.00. In this case, the pair may continue falling towards 1695.00.
NZDUSD, “New Zealand Dollar vs US Dollar”
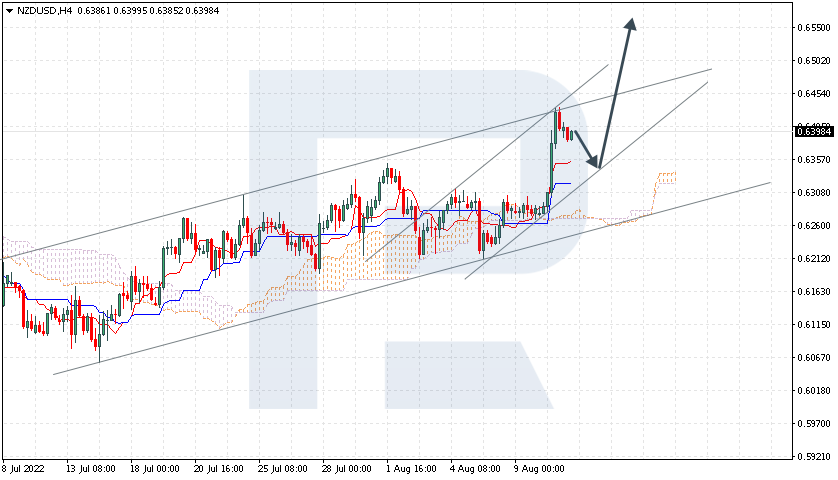
NZDUSD is rising within the bullish channel. The instrument is currently moving above Ichimoku Cloud, thus indicating an ascending tendency. The markets could indicate that the price may test Tenkan-Sen at 0.6355 and then resume moving upwards to reach 0.6555. Another signal in favour of a further uptrend will be a rebound from the rising channel’s downside border. However, the bullish scenario may no longer be valid if the price breaks the cloud’s downside border and fixes below 0.6240. In this case, the pair may continue falling towards 0.6135. To confirm a further uptrend, the price must break the bullish channel’s upside border and fix above 0.6475.
Attention! Forecasts presented in this section only reflect the author’s private opinion and should not be considered as guidance for trading. RoboForex LP bears no responsibility for trading results based on trading recommendations described in these analytical reviews.
EURUSD took advantage of the reasons for growth and may yet continue to improve.
The major currency pair remains in good spirits on Thursday. The current quote for the instrument is 1.0225.
Yesterday, the US released important and long-awaited data on inflation. Although when making monetary decisions the US Fed pays more attention to the other indicators, such as the PCE Price Index, the CPI and Core CPI remain very important for situational awareness and understanding the regulator’s sentiment.
So, the CPI dropped to 8.5% y/y in July after being 9.1% y/y the month before, thus failing to update its 40-year highs. On MoM, inflation didn’t change after gaining 1.3% in June.
The Core CPI added 0.3% m/m after gaining 0.5% m/m the month before.
It’s interesting that after the CPI report was released, inflation expectations in the US based on the breakeven rate dropped to 2-month lows.
The regulator’s policymakers also said that it was too early to triumph over inflation. That’s right: it was the first and maybe the only signal so far that showed some slowdown. It’s not the time to make conclusions.
Nevertheless, the “greenback” found itself under pressure from expectations that the Fed might not continue being aggressive during its September meeting and that the next rate hikes might be rather small.
Attention! Forecasts presented in this section only reflect the author’s private opinion and should not be considered as guidance for trading. RoboForex LP bears no responsibility for trading results based on trading recommendations described in these analytical reviews.
The EUR showed the largest one-day gain against the USD in the last five months. The euro’s strengthening came at the expense of the US Dollar Index as the US inflation data showed a slowdown in growth, raising expectations for a less aggressive rate hike cycle from the Fed. Now the most likely scenario at the US Federal Reserve’s September meeting will be a move to raise rates by 50 bps rather than the 75 bps previously forecast. But some analysts believe the market reaction was an overreaction as the cycle of rate hikes continues, and the Fed will begin reducing its balance sheet by $95 billion a month starting in September.
Trading recommendations
Support levels: 1.0286, 1.0247, 1.0146, 1.0112, 1.0035, 1.0000
Resistance levels: 1.0317, 1.0365, 1.0415, 1.050
Yesterday the price sharply jumped on the inflation data and consolidated above the balance. Under such market conditions, it is best to look for buy trades on intraday time frames from the support level of 1.0247, but with confirmation. Sell trades can be considered from the resistance level of 1.0317, only after additional confirmation and with short targets.
Alternative scenario: if the price breaks down through the 1.0146 support level and fixes below, the downtrend will likely resume.
News feed for 2022.08.11:
– US Producer Price Index (m/m) at 15:30 (GMT+3);
– US Initial Jobless Claims (w/w) at 15:30 (GMT+3).
The GBP/USD currency pair
Technical indicators of the currency pair:
Prev Open: 1.2070
Prev Close: 1.2214
% chg. over the last day: +1.19%
The representative of the Bank of England said yesterday that investors should not expect the return of quantitative easing in the next few years at least. The sentiment of politicians speaks for itself – the UK is preparing for a recession. Even though the Bank of England was one of the first central banks to begin the cycle of raising interest rates, the steps of the increase were too slow, analysts say. As a result, inflation in the country has not yet peaked, and the tightening cycle will stretch over time.
Trading recommendations
Support levels: 1.2130, 1.2063, 1.2000
Resistance levels: 1.2240, 1.2294
From the technical point of view, the trend on the currency pair GBP/USD on the hour timeframe is still upward, but now the price has deviated strongly from the average, we should wait for a pullback. The MACD indicator has turned positive. At the moment, it is best to look for buy trades on intraday time frames from the support level of 1.2130, but only with confirmation. Sell trades can be considered from the resistance level of 1.2240, but only after additional confirmation and with short targets.
Alternative scenario: if the price breaks down through the 1.2063 support level and fixes below, the downtrend will likely resume.
There is no news feed for today.
The USD/JPY currency pair
Technical indicators of the currency pair:
Prev Open: 135.04
Prev Close: 132.86
% chg. over the last day: -1.64%
The dollar fell on Wednesday, showing the biggest decline against the yen since March 2020 after US inflation data. However, do not take this fall as a start of the Japanese currency. Fundamentally, the US Federal Reserve is tightening monetary policy by raising interest rates, while the Bank of Japan has a soft monetary policy, and no changes are planned before the end of the year. So, a huge difference in interest rates (+2.5% vs. -0.1%) will encourage USD/JPY quotes to grow in the mid-term.
Trading recommendations
Support levels: 132.51, 131.08, 130.85
Resistance levels: 134.36, 135.55, 136.02, 137.13
From the technical point of view, the medium-term trend on the currency pair USD/JPY is still bullish. The price has formed an accumulation zone above the 134.36 level, so a test of this zone is very likely. Under such market conditions, buy trades can be sought from the support level of 132.51, but with additional confirmation. For sell deals, it is possible to consider the level of resistance 134.36, but only with additional confirmation in the form of a reverse initiative, as fundamentally, USD/JPY quotes are inclined to grow.
Alternative scenario: If the price fixes above 135.55, the uptrend will likely resume.
There is no news feed for today.
The USD/CAD currency pair
Technical indicators of the currency pair:
Prev Open: 1.2887
Prev Close: 1.2775
% chg. over the last day: -0.87%
The slowdown in US inflation reduces the likelihood of a 75 basis point interest rate hike by the Bank of Canada next month. Swap markets suggest there is about a 45% chance that Bank of Canada officials will raise borrowing costs by three-quarters of a percentage point in their September 7 decision. Next week, Canada will release inflation data for July. If inflation slows or stays the same, Tiff Macklem and his officials may opt for a smaller rate hike. Last week, though, a senior strategist at Toronto-Dominion Bank indicated that the Bank of Canada is likely to raise rates another 0.75% before starting to lower the rate hike.
Trading recommendations
Support levels: 1.2766, 1.2701
Resistance levels: 1.2817, 1.2871, 1.2918, 1.2965
In terms of technical analysis, the USD/CAD currency pair trend has changed to bearish. The price has consolidated below the priority change level. The MACD indicator has become negative, and the sellers’ pressure is still present. Under such market conditions, buy trades should be considered on the lower time frames from the support level 1.2766, but only with confirmation and short targets. For sell deals, it is better to consider the resistance level 1.2817 or 1.2871, but with confirmation.
Alternative scenario: if the price breaks out and consolidates above the 1.2918 resistance level, the uptrend will likely resume.
This article reflects a personal opinion and should not be interpreted as an investment advice, and/or offer, and/or a persistent request for carrying out financial transactions, and/or a guarantee, and/or a forecast of future events.
The US stock market rose Wednesday after the release of inflation data for July, which showed that price pressures eased. The overall Consumer Price Index for July was 8.5%, down from the 8.7% expected by economists. Investors now see a 50 basis point rate hike as the most likely scenario for the Federal Reserve’s September meeting. Stock indices jumped sharply on the news, while the dollar index saw its biggest one-day drop in 5 months. As the stock market closed yesterday, the Dow Jones Index (US30) increased by 1.63%, while the S&P 500 Index (US500) added 2.13%. The NASDAQ Technology Index (US100) jumped by 2.89%.
Most of the decline in inflation in July was due to the drop in gasoline prices, which fell by 7.7% for the month. Other categories also saw significant declines, including prices of airline tickets, used cars and trucks, and clothing. On the other hand, some analysts are inclined to think that markets have overreacted positively to the slowdown in inflation because the Fed is still in a cycle of raising rates and will begin cutting the balance sheet next month. Also, according to a new Bloomberg Economics model, inflation in the US now consists of four factors: supply, demand, energy prices, and monetary policy. This model showed that lower energy costs and a tougher Fed stance were the main factors behind the slowdown to 8.5% last month. At the same time, rising demand combined with supply constraints continued to put upward pressure on inflation.
Equity markets in Europe were also up yesterday. Germany’s DAX (DE30) gained 1.23%, France’s CAC 40 (FR40) added 0.52%, Spain’s IBEX 35 (ES35) added 0.49%, and Britain’s FTSE 100 (UK100) closed up by 0.25%.
The US Energy Information Administration reported a second straight week of five million barrels increase in crude oil inventories. But the agency also mentioned that gasoline inventories fell by about five million barrels, which helped offset the bearish sentiment hanging over the market. A lower dollar on the back of slowing inflation led to a rise in oil prices. But there is a vicious circle here that many do not notice. Inflation in the US has slowed due to falling oil and gasoline prices. This caused the dollar index to fall, causing oil prices to rise again. Thus, if the dollar index continues to decline, oil prices will continue to rise, which will have the opposite effect and cause a new acceleration of inflation in the US.
Gold hit a 5-week high on declining US inflation. Gold has an inverse correlation to the dollar index and government bond yields, which fell sharply yesterday after the CPI data. But it should be noted that usually, in a cycle of monetary tightening through higher interest rates, the national currency and government bond yields rise.
Asian markets traded lower yesterday. Japan’s Nikkei 225 (JP225) decreased by 0.65%, Hong Kong’s Hang Seng (HK50) fell by 1.96%, and Australia’s S&P/ASX 200 (AU200) ended the day down by 0.53%.
The Reserve Bank of New Zealand will likely raise its rate by another 50 basis points in August. Nevertheless, the deteriorating economic picture and rapidly falling home prices suggest that investors may see a downward revision to the interest rate trajectory forecast. As the RBNZ is increasingly seen as a test case for other central banks, global markets will be watching closely for any dovish bias from the bank.
S&P 500 (F) (US500) 4,210.23 +87.76 (+2.13%)
Dow Jones (US30) 33,309.84 +535.43 (+1.63%)
DAX (DE40) 13,700.93 +165.96 (+1.23%)
FTSE 100 (UK100) 7,507.11 +18.96 (+0.25%)
USD Index 106.21 −1.16 (−1.09%)
Important events for today:
– US Producer Price Index (m/m) at 15:30 (GMT+3);
– US Initial Jobless Claims (w/w) at 15:30 (GMT+3);
This article reflects a personal opinion and should not be interpreted as an investment advice, and/or offer, and/or a persistent request for carrying out financial transactions, and/or a guarantee, and/or a forecast of future events.
Semiconductors are a critical part of almost every modern electronic device, and the vast majority of semiconductors are made in Tawain. Increasing concerns over the reliance on Taiwain for semiconductors – especially given the tenuous relationship between Taiwan and China – led the U.S. Congress to pass the CHIPS and Science act in late July 2022. The act provides more than US$50 billion in subsidies to boost U.S. semiconductor production and has been widely covered in the news. Trevor Thornton, an electrical engineer who studies semiconductors, explains what these devices are and how they are made.
Thin, round slices of silicon crystals, called wafers, are the starting point for most semiconductor chips. Hebbe/Wikimedia Commons
1. What is a semiconductor?
Generally speaking, the term semiconductor refers to a material – like silicon – that can conduct electricity much better than an insulator such as glass, but not as well as metals like copper or aluminum. But when people are talking about semiconductors today, they are usually referring to semiconductor chips.
These chips are typically made from thin slices of silicon with complex components laid out on them in specific patterns. These patterns control the flow of current using electrical switches – called transistors – in much the same way you control the electrical current in your home by flipping a switch to turn on a light.
The difference between your house and a semiconductor chip is that semiconductor switches are entirely electrical – no mechanical components to flip – and the chips contain tens of billions of switches in an area not much larger than the size of a fingernail.
Semiconductors are how electronic devices process, store and receive information. For instance, memory chips store data and software as binary code, digital chips manipulate the data based on the software instructions, and wireless chips receive data from high-frequency radio transmitters and convert them into electrical signals. These different chips work together under the control of software. Different software applications perform very different tasks, but they all work by switching the transistors that control the current.
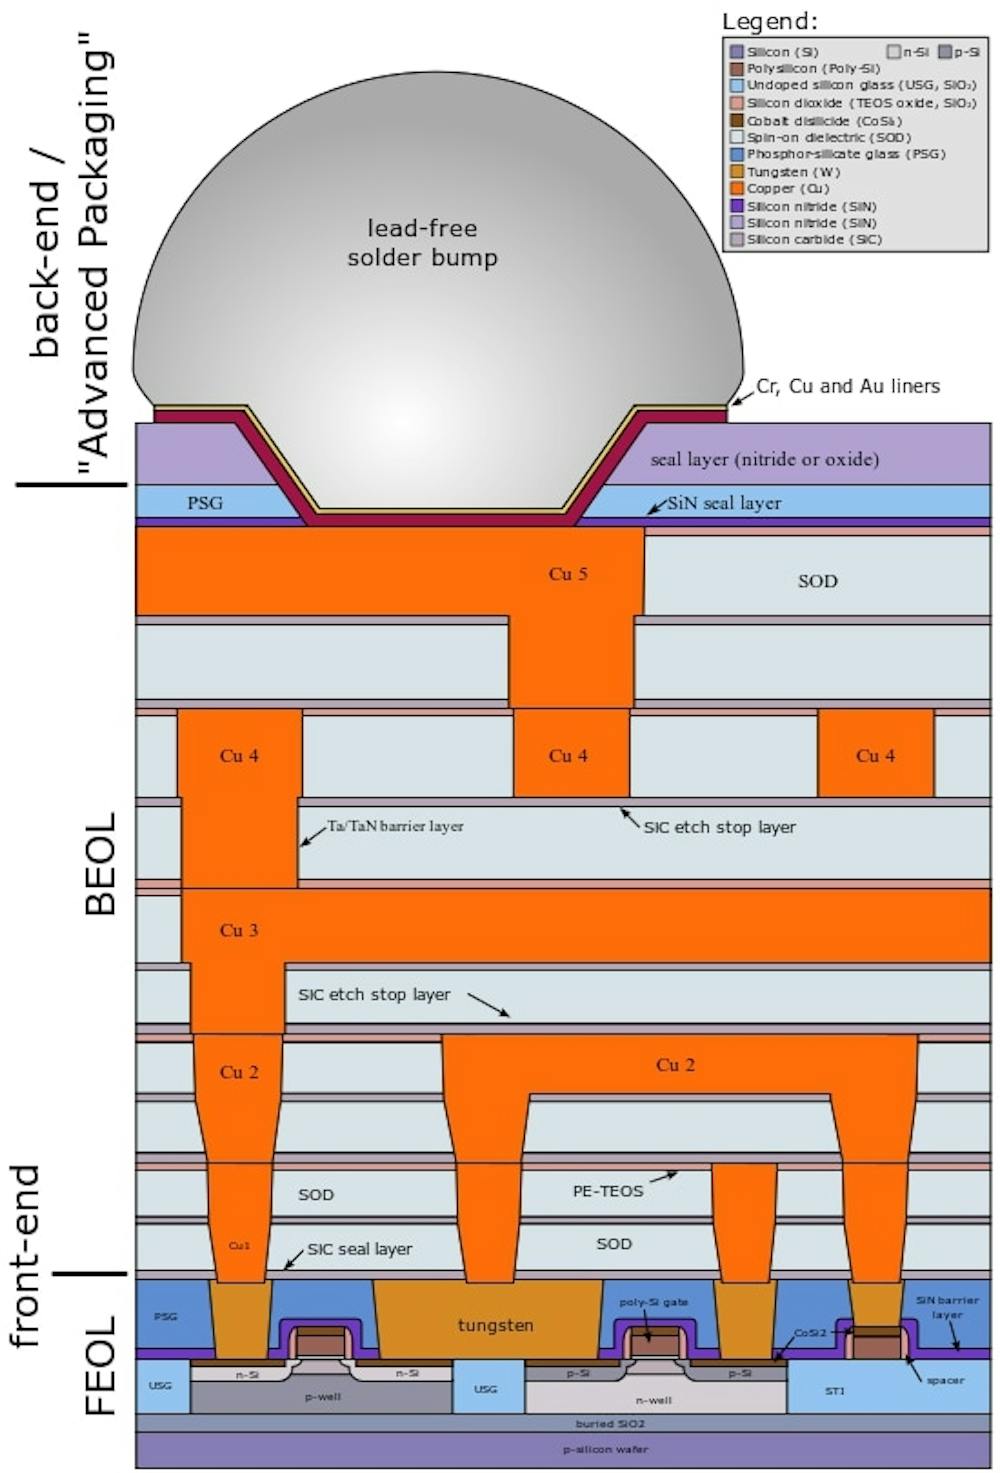
This schematic of a semiconductor chip shows many different materials in different colors and the complicated layering involved in producing a modern chip. Cepheiden/Wikimedia Commons, CC BY
3. How do you build a semiconductor chip?
The starting point for the vast majority of semiconductors is a thin slice of silicon called a wafer. Today’s wafers are the size of dinner plates and are cut from single silicon crystals. Manufacturers add elements like phosphorus and boron in a thin layer at the surface of the silicon to increase the chip’s conductivity. It is in this surface layer where the transistor switches are made.
The transistors are built by adding thin layers of conductive metals, insulators and more silicon to the entire wafer, sketching out patterns on these layers using a complicated process called lithography and then selectively removing these layers using computer-controlled plasmas of highly reactive gases to leave specific patterns and structures. Because the transistors are so small, it is much easier to add materials in layers and then carefully remove unwanted material than it is to place microscopically thin lines of metal or insulators directly onto the chip. By depositing, patterning and etching layers of different materials dozens of times, semiconductor manufacturers can create chips with tens of billions of transistors per square inch.
4. How are chips today different from the early chips?
There are many differences, but the most important is probably the increase in the number of transistors per chip.
Among the earliest commercial applications for semiconductor chips were pocket calculators, which became widely available in the 1970s. These early chips contained a few thousand transistors. In 1989 Intel introduced the the first semiconductors to exceed a million transistors on a single chip. Today, the largest chips contain more than 50 billion transistors. This trend is described by what is known as Moore’s law, which says that the number of transistors on a chip will double approximately every 18 months.
Moore’s law has held up for five decades. But in recent years, the semiconductor industry has had to overcome major challenges – mainly, how to continue shrinking the size of transistors – to continue this pace of advancement.
One solution was to switch from flat, two-dimensional layers to three-dimensional layering with fin-shaped ridges of silicon projecting up above the surface. These 3D chips significantly increased the number of transistors on a chip and are now in widespread use, but they’re also much more difficult to manfacture.
5. Do more complicated chips require more sophisticated factories?
Simply put, yes, the more complicated the chip, the more complicated – and more costly – the factory.
There was a time when almost every U.S. semiconductor company built and maintained its own factories. But today, a new foundry can cost more than $10 billion to build. Only the largest companies can afford that kind of investment. Instead, the majority of semiconductor companies send their designs to independent foundries for manufacturing. Taiwan Semiconductor Manufacturing Co. and GlobalFoundries, headquartered in New York, are two examples of multinational foundries that build chips for other companies. They have the expertise and economies of scale to invest in the hugely expensive technology required to produce next-generation semiconductors.
Ironically, while the transistor and semiconductor chip were invented in the U.S., no state-of-the-art semiconductor foundries are currently on American soil. The U.S. has been here before in the 1980s when there were concerns that Japan would dominate the global memory business. But with the newly passed CHIPS act, Congress has provided the incentives and opportunities for next-generation semiconductors to be manufactured in the U.S.
Perhaps the chips in your next iPhone will be “designed by Apple in California, built in the USA.”
The S&P 500 index is widely used as the benchmark to gauge how overall US stocks are performing.
And much has already been made about the selloff that had persisted through the first half of this year, driven by fears that the Fed will send US interest rates soaring (which it has, by 225 basis points since March).
Since posting a record high early this year, this blue-chip index then fell by as much as 23.55% on June 16th, crossing over into ‘bear market’ territory.
However, since mid-June, the S&P 500 has climbed by 14.8%. Yesterday (Wednesday, August 10th), this index posted its highest closing price since May.
The question now that’s being hotly debated now is whether the worst of the US stock market’s selloff is already over.
And markets are watching closely whether we’ll see a key piece of technical evidence on the S&P 500 today that could help substantially address that very question.
But first … let’s try and understand what may be contributing to the S&P 500’s gains over the past couple of months.
What’s driving this rebound in the S&P 500?
Arguably, the primary reason is that markets believe that the Fed has done the largest chunks of its rate hikes already.
Since March, the Fed has already hiked by 225 basis points. At the time of writing, markets think there are only 125 basis points in hikes left in the Fed’s tank, to be triggered between next month and March 2023.
After that, markets think the US central bank then has to start unwinding its rate hikes (i.e. lower interest rates) sometime in the middle of next year, so as to either avoid sending the US into a full-blown recession, or at least support the demand that the Fed has already gone about destroying in the name of quelling red-hot inflation.
Recall that, generally speaking, riskier assets such as stocks dislike the thought of US interest rates moving higher.
However, if the worst of those fears (markets at one point thought that the Fed would trigger a gargantuan 100 bps hike) had already been priced in, any relief from such perceived worst-case scenarios should translate into a recovery for risk assets.
Hence, investors have been emboldened by the above narrative, and have been rewarded (so far) for “buying the dip”.
Which brings us back to the main question …
Is the worst of this year’s selloff over for the S&P 500?
And here’s the important technical indicator that could confirm whether that the mid-June low of 3637.3 would be the lowest point for the S&P 500 for this latest selloff.
The S&P 500 has to register a daily close above 50% Fibonacci retracement level!
Looking back at the chart above, the S&P 500 has already managed to breach the 4228.6 line, which marks the halfway point from its peak-to-trough plummet in the first half of this year.
According to data compiled by CFRA (research firm) and S&P Global (ratings, analytics, and market intelligence agency), in 18 of the 19 bear markets witnessed since World War 2 (with the exception being the bear market of 1973-1974), the S&P 500 goes on to make a recovery/mark a new bull run once it closes back above its 50% Fibonacci retracement line.
In other words, once the S&P 500 secures a daily close above 4228.6, market participants can then say with greater confidence that the market bottom is indeed in the past.
But wait, there’s more …
Also, the S&P 500 has already posted a higher-high above the late-May cycle peak of 4205.7.
Such a technical event may carry less weight compared to a daily close above the 50% Fib retracement level, but can be used as a point in deciphering whether the S&P 500’s downtrend has been broken.
But let’s be careful.
To be clear, markets never move in a single, straight line.
And also from a technical perspective, the S&P 500 may be due for a pullback, given that its 14-day relative strength index is now flirting with the 70 mark that denotes ‘overbought’ conditions.
So it’s still entirely possible that the S&P 500 falters back below 4228.6, even after a daily close above that mark.
Instead, the idea is that the S&P 500 will not fall lower than the mid-June bottom of 3637.3 if the index posts a daily close above that 50% retracement level of 4228.6 (or so suggest the proponents of such a signal).
S&P 500 still at the mercy of the Fed/US economy
Risk assets have in the past two months clearly basked in the thought that the incoming Fed rate hikes would be fewer and smaller from here on out.
Such a notion was emboldened by yesterday’s (Wednesday, August 10th) lower-than-expected headline US inflation print.
The consumer price index (CPI) “only” rose by 8.5%. That is lower than almost all economists’ had forecasted (at least those surveyed by Bloomberg), and also lower than June’s year-on-year CPI advance of 9.1%.
Those participating in recent gains appear to harbour the belief that US inflation has peaked, which in turn may allow the Fed to step away from being so aggressive in its battle against multi-decade high inflation.
And so, it remains to be seen whether US inflation has truly peaked. Also, whether a full-blown, risk-off recession could undermine the S&P 500’s attempts at a full recovery.
More confirmation could be had at these upcoming economic events:
August 25-27: Fed’s Jackson Hole Symposium (where central bankers gather to talk about issues pertaining to the economy and monetary policy. More clues about the Fed’s view on inflation/rate hikes?)
September 2: US August nonfarm payrolls report (can the US jobs market stay resilient enough to handle US interest rates going much higher?)
September 13: US August CPI release (a print below July’s 8.5% may confirm that inflation in the world’s largest economy has indeed peaked)
September 21: FOMC meeting (Fed to hike by 75bps? Or “just” 50bps?)


 Undergraduate students at the University of Nebraska Omaha collaborate on a group assignment for a STEM course.
















 Article by

.jpg#/media/File:A_Wafer_of_the_Latest_D-Wave_Quantum_Computers_(39188583425).jpg)
.svg#/media/File:Cmos-chip_structure_in_2000s_(en).svg)