What a Major Indicator of “Housing Busts” is Showing Now

“It was the first such decline since November 2015”

By Elliott Wave International

The housing market tends to go the way of the stock market, and nearly everyone knows that the stock market has been sliding.

There’s another housing market indicator that the July Global Market Perspective, a monthly Elliott Wave International publication which covers 50-plus financial markets, mentioned:

[Home] sales declines invariably lead the way into housing busts. This one … should arrive faster and more forcefully than the experts expect.

Homes sales have already begun to decline:

  • U.S. existing home sales fall for third straight month; house prices at record high (Reuters, May 19)
  • Sales of existing homes fell in May, and more declines are expected (CNBC, June 21)

Sales of luxury homes in some areas have dropped significantly. As examples, in Nassau County, NY, Oakland, CA, Dallas, TX, Austin, TX and West Palm Beach, FL, annual drops in the rate of upper-end home sales for the three months ended April 30 stretched from 32.8% to 45.3%.

As June numbers roll in, more signs of a real estate slowdown are evident. For instance, the number of active U.S. home listings jumped 18.7% in June from a year earlier, the largest annual increase since the data started in 2017.

The housing bubble is by no means confined to the U.S. Bloomberg reports that New Zealand, Australia and Canada look even more “frothy” than the U.S.

And, then there’s China. Here’s a chart and commentary from the June Global Market Perspective:

Month-to-month prices of China’s new-home sales turned negative in September, and they’ve continued to fall since. The year-over-year average of new home prices also fell in April. It was the first such decline since November 2015.

In Elliott Wave International’s view, housing markets around the globe are on shaky ground and those who bought at the peak of this latest housing boom better be prepared.

It was mentioned at the top of this article that housing markets within a nation tend to trend with that nation’s stock market.

Elliott wave analysis can help you get a perspective on stock markets anywhere in the world.

If you’re unfamiliar with the Elliott wave model, you are encouraged to read Frost & Prechter’s Wall Street classic, Elliott Wave Principle: Key to Market Behavior.

Here’s a quote from that book:

In the 1930s, Ralph Nelson Elliott discovered that stock market prices trend and reverse in recognizable patterns. The patterns he discerned are repetitive in form but not necessarily in time or amplitude. Elliott isolated five such patterns, or “waves,” that recur in market price data. He named, defined and illustrated these patterns and their variations. He then described how they link together to form larger versions of themselves, how they in turn link to form the same patterns of the next larger size, and so on, producing a structured progression. He called this phenomenon The Wave Principle.

If you’d like to read the entire book, do know that you can access the online version for free once you join Club EWI, the world’s largest Elliott wave educational community.

Club EWI is free to join, and members enjoy complimentary access to videos and other resources on how the Wave Principle can help them navigate financial markets.

Just follow this link to get started: Elliott Wave Principle: Key to Market Behavior — get instant and free access now.

This article was syndicated by Elliott Wave International and was originally published under the headline What a Major Indicator of “Housing Busts” is Showing Now. EWI is the world’s largest market forecasting firm. Its staff of full-time analysts led by Chartered Market Technician Robert Prechter provides 24-hour-a-day market analysis to institutional and private investors around the world.

Japanese Candlesticks Analysis 28.07.2022 (USDCAD, AUDUSD, USDCHF)

Article By RoboForex.com

USDCAD, “US Dollar vs Canadian Dollar”

As we can see in the H4 chart, after forming several reversal patterns close to the support level, such as Doji and Hammer, USDCAD may reverse in the form of another ascending impulse. In this case, the upside target may be the resistance area at 1.2920. Later, the market may break this level and continue growing. However, an alternative scenario implies that the asset may correct to reach 1.2740 and continue the uptrend only after the pullback.

USDCAD
Risk Warning: the result of previous trading operations do not guarantee the same results in the future

AUDUSD, “Australian Dollar vs US Dollar”

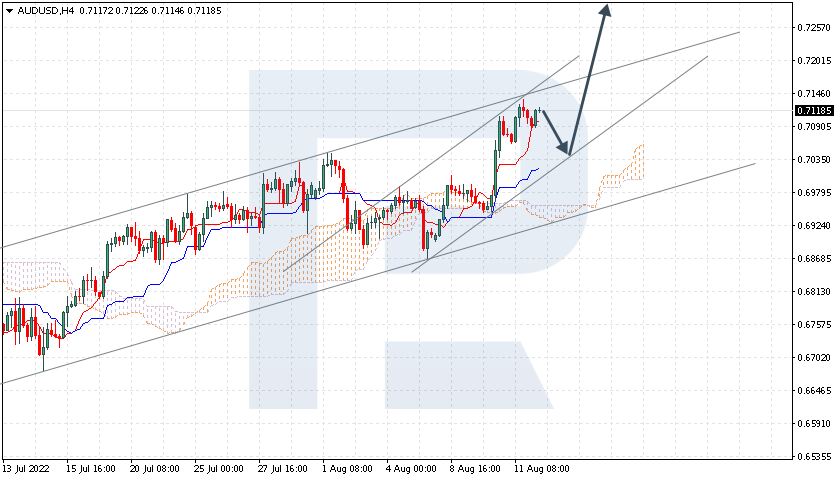
As we can see in the H4 chart, AUDUSD has formed a Harami reversal pattern near the resistance area. At the moment, the asset is reversing in the form a new descending impulse. In this case, the downside target may be the support level at 0.6950. After testing the level, the price may rebound from it and resume the ascending tendency. At the same time, the opposite scenario implies that the price may grow to reach 0.7065 and continue the uptrend without any pullbacks.

AUDUSD
Risk Warning: the result of previous trading operations do not guarantee the same results in the future

USDCHF, “US Dollar vs Swiss Franc”

As we can see in the H4 chart, after testing the support area, the pair has formed a Hammer reversal pattern. At the moment, USDCHF may reverse in the form of a new rising impulse. In this case, the upside target may be at 0.9695. After testing the resistance level, the price may break it and continue trading upwards. Still, there might be an alternative scenario, in which the asset may correct to reach 0.9550 and continue the ascending tendency only after correcting down to the support area.

USDCHF

Article By RoboForex.com

Attention!
Forecasts presented in this section only reflect the author’s private opinion and should not be considered as guidance for trading. RoboForex LP bears no responsibility for trading results based on trading recommendations described in these analytical reviews.

Murrey Math Lines 28.07.2022 (USDCHF, GOLD)

Article By RoboForex.com

USDCHF, “US Dollar vs Swiss Franc”

In the H4 chart, USDCHF is trading below the 200-day Moving Average to indicate a possible descending tendency. In this case, the pair is expected to test 2/8, break it, and then continue falling towards the support at 1/8. However, this scenario may be cancelled if the price breaks the resistance at 3/8 to the upside. After that, the instrument may move upwards to reach 4/8.

USDCHFH4
Risk Warning: the result of previous trading operations do not guarantee the same results in the future

As we can see in the M15 chart, the pair has broken the downside line of the VoltyChannel indicator and, as a result, may continue its decline.

USDCHF_M15
Risk Warning: the result of previous trading operations do not guarantee the same results in the future

XAUUSD, “Gold vs US Dollar”

In the H4 chart, XAUUSD is also trading below the 200-day Moving Average, thus indicating a descending tendency. In this case, the price is expected to test 4/8, rebound from it, and then resume moving downwards to reach the support at 3/8. However, this scenario may no longer be valid if the price breaks the resistance at 4/8 to the upside. After that, the instrument may reverse and resume growing to return to 5/8.

XAUUSD_H4
Risk Warning: the result of previous trading operations do not guarantee the same results in the future

As we can see in the M15 chart, the downside line of the VoltyChannel indicator is pretty far away from the price, that’s why the pair may resume trading downwards only after rebounding from 4/8 in the H4 chart.

XAUUSD_M15

Article By RoboForex.com

Attention!
Forecasts presented in this section only reflect the author’s private opinion and should not be considered as guidance for trading. RoboForex LP bears no responsibility for trading results based on trading recommendations described in these analytical reviews.

A hawkish Fed signals further rate hikes and sees a slowing economy – but not recession

By Arabinda Basistha, West Virginia University 

The U.S. Federal Reserve hiked its benchmark interest rate by a further three-quarters of a percentage point on July 27, 2022.

The jump was expected by most economists, although some had thought the central bank would go further in its attempts to put the brakes on soaring inflation and impose a full point increase.

The Conversation asked Arabinda Basistha, an economist at West Virginia University, to cast an eye over the Fed’s announcement and provide three key takeaways about what it tells us about the economy and future monetary policy.

1. More hawkish on monetary policy

On the surface, the headline decision to raise the interest rate by three-quarters of a percentage point is very much in line with what was expected. But a careful reading of the accompanying statement by the rate-setting Federal Open Market Committee (FOMC) reveals a slightly more hawkish Fed – one that’s more willing to act more aggressively in attempting to calm inflation – than in the last such meeting in June, when it likewise raised rates by three-quarters of a percentage point.

On that occasion, the vote was not unanimous – Kansas City Fed President Esther George opted to go for a half-point raise but was outvoted by colleagues who wanted the more aggressive 0.75% hike in a bid to bring down inflation.

But this time the vote was unanimously in favor of the three-quarter point rise, an indication that the Fed thinks it needs to act more decisively in the face of stubborn cost of living increases.

A notable change in the FOMC statement was the removal of any reference to supply chain disruptions due to COVID-19 in China. That line was in June’s statement, so its absence this time may indicate an easing of the supply chain issues that have contributed to inflation hitting a 40-year high.

That aside, Fed Chairman Jerome Powell stuck a downbeat note on inflation in the U.S., acknowledging in a news conference accompanying the announcement that June’s Consumer Price Index hitting 9.1% was “worse than expected.”

2. Expect a further rate hike in September

There is now a clear indication that that the FOMC will impose another rate hike when it meets in September. Powell noted in the news conference that another 0.75 percentage point rise in September “could be appropriate.”

At the same time, he acknowledged that with the latest increase, the Fed’s rate was pretty much in line with what economists call the “neutral” rate of interest – that is, a rate which neither stimulates the economy nor slows it down. The “neutral rate” is assumed to be around 2.5%; the latest FOMC hike puts the Feds’ policy rate up to a range of 2.25% to 2.5%.

So if there were to be another fairly sharp rise in the benchmark interest rate in September, it would push the Fed rate above the neutral rate – a move that would restrict economic growth. Again, this is an indication that the Fed is striking a more hawkish tone on monetary policy.

Powell did mention that a more moderate rate rise in September is possible, but that will likely depend on there being clear data showing price stabilization and an overall softening of the labor market. The job market has been strong for a while, with healthy monthly gains. The Fed will be looking for a decrease in the current high number of job vacancies, along with lower wage inflation, to signal a softening labor market before it can ease back on aggressive rate hikes.

3. Economic output is slowing, but no recession (yet)

In the statement accompanying the FOMC rate decision, the Fed noted that recent data showed “spending and production have softened.” Powell expanded on that a little, noting that business fixed investment – that is, how much companies spend on things like machines or factories – had gone down.

This acknowledgment that expenditure is softening wasn’t in June’s statement and is a clear sign that Fed officials believe the economy is slowing down, something Powell acknowledged. Yet at the same time, the Fed chair said the strength of the labor market indicated robust overall demand.

As such, it would seem Powell does not see the U.S. heading into recession, but rather, there will be some slowing down of the economy throughout the second half of this year.The Conversation

About the Author:

Arabinda Basistha, Associate Professor of Economics, West Virginia University

This article is republished from The Conversation under a Creative Commons license. Read the original article.


The Analytical Overview of the Main Currency Pairs on 2022.07.28

By JustForex

The EUR/USD currency pair

Technical indicators of the currency pair:
  • Prev Open: 1.0114
  • Prev Close: 1.0198
  • % chg. over the last day: +0.83%

The US central bank raised rates by three-quarters of a percentage point for the second session in a row to rein in record inflation but noted that while the labor market remains strong, other economic indicators have deteriorated. According to the Fed gov, there are no signs of a recession at this time. At the press conference, Fed Chairman Jerome Powell supported the idea that the central bank will hold another rate hike in September, although he said that a slower pace of increases might be needed. According to the CME FedWatch Tool, expectations for a 50 basis point hike at the September Fed meeting rose to 60.9%, up from 50.7% the day before.

Trading recommendations
  • Support levels: 1.0170, 1.0142, 1.0035, 1.0000
  • Resistance levels: 1.0202, 1.0250, 1.0284, 1.0365, 1.0415, 1.050

From the technical point of view, the trend on the EUR/USD currency pair on the hourly time frame is bullish. The price is still forming a wide volatile balance, and buyer pressure prevails now. The MACD indicator has become positive. Under such market conditions, buy trades are best sought on intraday time frames from the support level of 1.0170 or 1.0142. Sell trades can be considered from the resistance level of 1.0202, only after additional confirmation and with short targets.

Alternative scenario: if the price breaks down through the 1.0035 support level and fixes below, the downtrend will likely resume.

EUR/USD
News feed for 2022.07.28:
  • – US GDP (q/q) at 15:30 (GMT+3);
  • – US Treasury Sec Yellen Speaks at 15:30 (GMT+3);
  • – US Initial Jobless Claims (w/w) at 15:30 (GMT+3).

The GBP/USD currency pair

Technical indicators of the currency pair:
  • Prev Open: 1.2016
  • Prev Close: 1.2155
  • % chg. over the last day: +1.16%

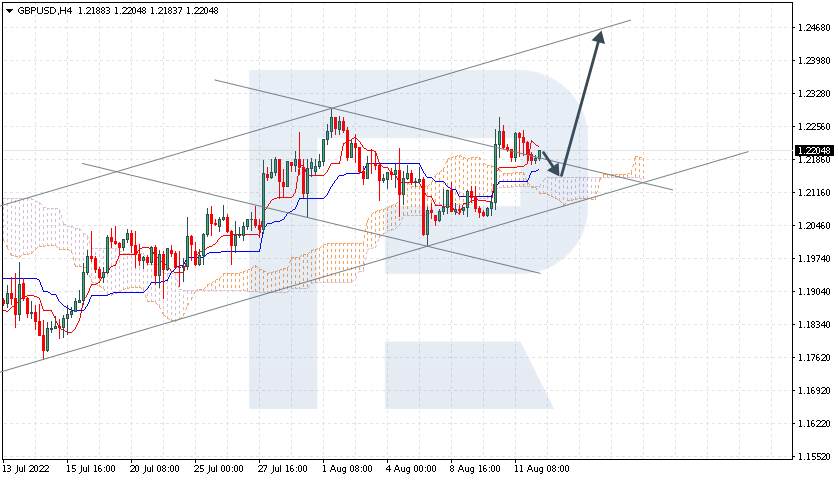
The British pound rose sharply yesterday as the dollar fell after the FOMC meeting. But traders should remember that the interest rate of the central bank of England is now at 1.25%, while the US Federal Reserve’s interest rate is 2.5%, which is twice as much. Such differences can’t pass in vain for the British currency, so analysts expect a decline in GBP/USD quotes in the coming weeks.

Trading recommendations
  • Support levels: 1.2089, 1.2063, 1.1907, 1.1803
  • Resistance levels: 1.2238, 1.2294

From the technical point of view, the trend on the GBP/USD currency pair on the hourly time frame is bullish. Buyer pressure remains. The MACD indicator is in the positive zone but shows signs of divergence already in several time frames. Under such market conditions, it is better to look for buy trades on the intraday time frames from the support level 1.2089 or 1.2063, but only with confirmation. Sell trades can be considered from the resistance level of 1.2238, but only after additional confirmation and with short targets.

Alternative scenario: if the price breaks down through the 1.1907 support level and fixes below, the downtrend will likely resume.

GBP/USD
There is no news feed for today.

The USD/JPY currency pair

Technical indicators of the currency pair:
  • Prev Open: 136.89
  • Prev Close: 136.60
  • % chg. over the last day: -0.22%

Despite the decline in the US Dollar Index yesterday, analysts are still confident in a further rise in USD/JPY quotes as the US and Japanese central banks are moving in different directions. The US Fed is planning another rate hike in September, while the Japanese bank does not intend to tighten its policy until the end of the year.

Trading recommendations
  • Support levels: 134.64, 134.11
  • Resistance levels: 135.88, 136.62, 137.11, 138.25

From the technical point of view, the medium-term trend on the USD/JPY currency pair is bearish. But it should be noted that the fall in the USD/JPY quotes is not accompanied by any fundamental factors, so traders should be careful. The MACD indicator has become negative, and the sellers’ pressure is still there, but there are signs of divergence. Under such market conditions, buy trades can be sought intraday from the lower boundary of the descending channel or the support level of 134.64, but with additional confirmation. Resistance levels of 135.88 or 136.62 may be considered for sell deals, but only with additional confirmation and short targets.

Alternative scenario: If the price fixes above 138.25, the uptrend will likely resume.

USD/JPY
There is no news feed for today.

The USD/CAD currency pair

Technical indicators of the currency pair:
  • Prev Open: 1.2886
  • Prev Close: 1.2822
  • % chg. over the last day: -0.50%

When the US Dollar Index is falling, and oil prices are rising, it is a green light for the Canadian currency because the Canadian is a commodity currency and is directly dependent on these indicators. Now the interest rates of the central banks of the USA and Canada are at the same level, so the price will keep a certain balance without significant trends.

Trading recommendations
  • Support levels: 1.2781
  • Resistance levels: 1.2880, 1.2923, 1.3006, 1.3085, 1.3154

In terms of technical analysis, the trend on the USD/CAD currency pair is bearish. Currently, the price is forming a wide balance and trading on the lower border of the descending channel. The MACD indicator is negative again, but there is a divergence, which indicates that it is harder for the price to move lower. Under such market conditions, it is better to consider sell deals from the resistance level of 1.2880, but with confirmation. Buy trades should be considered on the lower time frames from the support level of 1.2781 or the lower border of the channel, but only with confirmation and short targets.

Alternative scenario: if the price breaks out and consolidates above the 1.3006 resistance level, the uptrend will likely resume.

USD/CAD
There is no news feed for today.

By JustForex


This article reflects a personal opinion and should not be interpreted as an investment advice, and/or offer, and/or a persistent request for carrying out financial transactions, and/or a guarantee, and/or a forecast of future events.

The US Federal Reserve hinted at a slowdown in the pace of rate hikes. The situation in the gas market is escalating

By JustForex

The US Federal Reserve yesterday raised interest rates by 75 basis points and confirmed that further increases would be appropriate to contain high inflation, which is putting pressure on global economic activity. The Fed said that some parts of the economy, such as spending and production, have weakened. However, there has been significant job growth in recent months, and the unemployment rate remains low. At a press conference following the monetary policy announcement, Fed Chairman Jerome Powell supported the idea that the central bank would hold another rate hike in September. However, he said that a slower pace of increases might be needed to give the Fed time to evaluate the implications. It is positive for the market, as the peak of the Fed’s hawkish mood has passed. As the stock market closed yesterday, the Dow Jones Index (US30) increased by 1.37%, and the S&P 500 Index (US500) added 2.62%. Technology Index NASDAQ (US100) jumped by 4.06% yesterday.

Experts believe the Fed’s policy measures to rein in inflation seem to be having the desired effect as recent data and quarterly reports from consumer demand-sensitive sectors, including retail, have revealed fears of slowing economic growth. But many fear that in its fight against inflation, the Fed could slow the economy too much, avoid a so-called “soft landing,” and tilt the economy into recession.

Microsoft shares increased by 6.7% after forecasting double revenue growth. Alphabet shares jumped by 7.7% on the report. The company reported better-than-expected sales of Google Ads Search, easing fears of a slowing advertising market. Companies reporting today include Apple (AAPL), Amazon.com (AMZN), Mastercard (MA), Pfizer (PFE), Merck&Co (MRK), Shell ADR (SHEL), Intel (INTC), Baidu (BIDU) and others.

Most Gulf central banks raised their key interest rates by three-quarters of a percentage point Wednesday, following the US Federal Reserve, as their currencies are pegged to the dollar. The Central Bank of Kuwait, the only one of the six Gulf Cooperation Council (GCC) countries that peg its currency to a basket, not just the dollar, raised its key discount rate by 25 basis points to 2.5%.

Equity markets in Europe closed yesterday in green territory. German DAX (DE30) gained 0.53% on Wednesday, French CAC 40 (FR 40) jumped by 0.75%, Spanish IBEX 35 (ES35) added 0.68%, British FTSE 100 (UK100) closed in plus 0.57%.

Rising inflation and concerns over low natural gas supply combined with the risk of recession caused consumer sentiment in the euro area to plummet to record lows. The main reasons for the sharp deterioration in confidence are primarily related to the Russian invasion of Ukraine. Firstly, because of fears of low natural gas supply. Secondly, fears of recession, as the war has triggered inflation, especially in energy and commodities. In addition, investors are concerned about the political uncertainty in Italy and the struggle for the position of Prime Minister in the UK.

Oil rose more than $2 on Wednesday as a report of lower US inventories, and reduced Russian gas supplies to Europe offset fears of lower demand and a US interest rate hike. US crude reserves were down by 4.5 million barrels last week as exports rose to a record high due to a significant discount in US crude against the international benchmark Brent, the Energy Information Administration said.

The gas market also remains tight. Just days after Europeans breathed a sigh of relief when Russia’s Gazprom announced it would resume supplies through its Nord Stream 1 pipeline, it announced Monday that flows would be cut again. The announcement, in which Gazprom said it would repair a turbine along the pipeline, was met with disbelief and condemnation in Europe. The move will reduce gas flows to Germany by up to 20% of its capacity. Germany, the region’s largest economy and a traditional growth driver, has particular cause for concern. Germany is heavily dependent on Russian gas and is sliding into recession. Since Russia is under a slew of international sanctions in response to its war with Ukraine, gas is one of the weapons Russia uses against Europe. As a result, natural gas prices continue to rise significantly. Analysts predict a harsh winter for Europe if the situation does not change.

On Thursday, Asian stocks showed cautious gains as investors sensed a possible slowdown in the pace of rate hikes in the United States. Japan’s Nikkei 225 (JP225) gained 0.22%, Hong Kong’s Hang Seng (HK50) decreased by 1.13%, while Australia’s S&P/ASX 200 (AU200) was up 0.23% on the day.

S&P 500 (F) (US500) 4,023.61 +102.56 (+2.62%)

Dow Jones (US30) 32,197.59 +436.05 (+1.37%)

DAX (DE40) 13,166.38 +69.45 (+0.53%)

FTSE 100 (UK100) 7,348.23 +41.95 (+0.57%)

USD Index 107.22 +0.73 (+0.69%)

Important events for today:
  • – Australia Retail Sales (m/m) at 04:30 (GMT+3);
  • – US GDP (q/q) at 15:30 (GMT+3);
  • – US Treasury Sec Yellen Speaks at 15:30 (GMT+3);
  • – US Initial Jobless Claims (w/w) at 15:30 (GMT+3);
  • – US Natural Gas Storage (w/w) at 17:30 (GMT+3).

By JustForex


This article reflects a personal opinion and should not be interpreted as an investment advice, and/or offer, and/or a persistent request for carrying out financial transactions, and/or a guarantee, and/or a forecast of future events.

Technical Outlook: Dollar Weakens On Less Hawkish Fed

By ForexTime 

– Earlier in the week, we questioned whether another jumbo Fed rate hike would be enough to satisfy dollar bulls.

Well, we got our answer yesterday evening after the Federal Reserve raised interest rates by 75bps for the second straight month to tame inflation. King dollar offered a muted response and was more concerned with comments from Federal Reserve Chairman Jerome Powell.

The central bank head said a lot of things, highlighting the strong labour markets but weak economic indicators and inflation risk. However, it felt like markets were expecting a more hawkish Powell but instead offered a Powell who talked about rate hikes but left out details on timing. So according to the Fed chair, another “usually large” hike may be appropriate in September but this will be heavily influenced by economic data. He also mentioned that the Fed may slow hikes at some time in the future…

Time for USD bears to attack?

The dollar weakened against every single G10 currency yesterday despite the 75bps rate hike.

If such a jumbo rate hike was unable to excite dollar bulls, then imagine how the currency may react when the Fed raises interest rates by the expected 50bps in September?

Taking a look at the technical picture, the Dollar Index (DXY) is under pressure on the daily charts with prices wobbling above 106.00. A breakdown below this level could signal the start of a bearish trend with 104.60 acting as the first target.

We can see a similar scene playing out on the equally-weighted USD index. A breakdown below the 50-day Simple Moving Average may open the doors towards 1.1700. Below this level, bears are likely to target 1.1630 and 1.1450.

EURUSD to extend rebound?

A weaker dollar could provide a lifeline for EURUSD bulls, keeping prices above parity for slightly longer before the fundamental forces eventually drag prices lower. There seems to be something about the sticky 1.0200 level which has acted as support and resistance over the past few days. A solid breakout and weekly close above this level could encourage a move higher towards 1.0350. Should prices fail to conquer 1.0200, a move back to parity could be on the cards.

GBPUSD breakout inspires bulls

After bouncing within a range, the GBPUSD has finally experienced a breakout above the 1.2060 resistance level. This has been fuelled by a weaker dollar with further upside expected in the short to medium term. The next key levels of interest can be found at the 50-day Simple Moving Average and 1.2350 resistance level.

AUDUSD eyes 0.7050 resistance

Dollar weakness could propel the AUDUSD towards the 0.7050 level. A breakout above this point may open the doors towards 0.7150 and higher. Should 0.7050 prove to be reliable resistance, prices may decline back towards 0.6850.

USDJPY breaks below 136.00

We see a potential breakdown opportunity on the USDJPY. Prices are trading below the 136.00 support level and could decline towards 134.00 which is above the 50-day Simple Moving Average. A strong breakdown below 134.00 could open the doors towards 131.00.

EURJPY lower lows and lower highs

As the subtitle says, the EURJPY is experiencing lower lows and lower highs on the daily charts. Prices are trading below the 50, 100, and 200-day Simple Moving Average while the MACD trades below zero. A strong breakdown below 137.00 could pave a path back towards 134.50.

Time for gold to fight back?

Reduced expectations over the Federal Reserve maintaining an aggressive approach on rates could provide zero-yielding gold some breathing room. A weaker dollar is likely to complement upside gains, pushing prices further away from $1700. Talking technicals, a breakout above $1750 could signal a move towards $1784.


Forex-Time-LogoArticle by ForexTime

ForexTime Ltd (FXTM) is an award winning international online forex broker regulated by CySEC 185/12 www.forextime.com


Murrey Math Lines 27.07.2022 (USDJPY, USDCAD)

Article By RoboForex.com

USDJPY, “US Dollar vs. Japanese Yen”

On the H4 chart, after breaking 8/8, USDJPY is no longer trading within the “overbought” area. In this case, the price is expected to test the resistance at 8/8, rebound from it, and resume falling and reach 6/8. However, this scenario may no longer be valid if the price breaks the resistance at 8/8 to the upside. After that, the instrument may reverse and grow towards +1/8.

USDJPYH4
Risk Warning: the result of previous trading operations do not guarantee the same results in the future

As we can see in the M15 chart, the downside line of the VoltyChannel indicator is pretty far away from the price, that’s why the pair may resume trading downwards only after rebounding from 8/8 in the H4 chart.

USDJPY_M15
Risk Warning: the result of previous trading operations do not guarantee the same results in the future

USDCAD, “US Dollar vs Canadian Dollar”

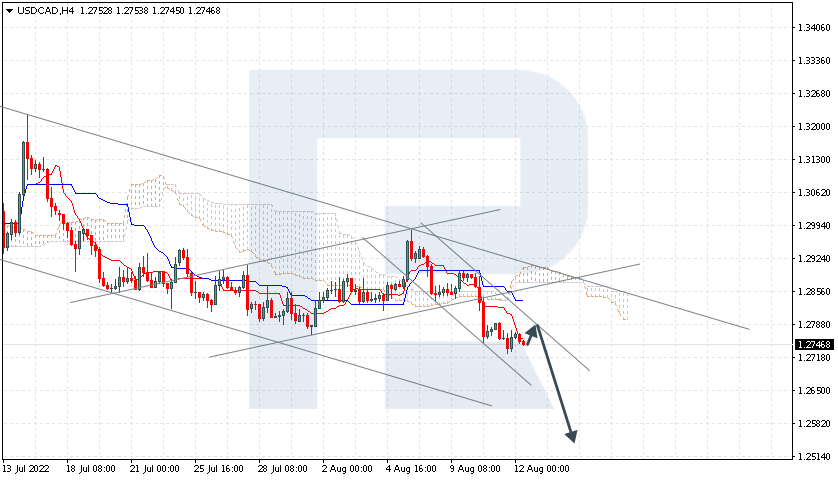
As we can see in the H4 chart, after breaking the 200-day Moving Average, USDCAD is also trading below it, thus indicating a possible descending tendency. In this case, the price is expected to test 1/8, break it, and then continue falling towards the support at 0/8. On the other hand, this scenario may no longer be valid if the pair breaks the resistance at 2/8 to the upside. After that, the instrument may reverse and grow to reach 3/8.

USDCAD_H4
Risk Warning: the result of previous trading operations do not guarantee the same results in the future

In the M15 chart, the pair may break the downside line of the VoltyChannel indicator and, as a result, continue trading downwards.

USDCAD_M15

Article By RoboForex.com

Attention!
Forecasts presented in this section only reflect the author’s private opinion and should not be considered as guidance for trading. RoboForex LP bears no responsibility for trading results based on trading recommendations described in these analytical reviews.

Forex Technical Analysis & Forecast 27.07.2022

Article By RoboForex.com

EURUSD, “Euro vs US Dollar”

Having completed the descending wave at 1.0133, EURUSD is forming a new consolidation range around this level. If later the price breaks the range to the upside, the market may correct up to 1.0200; if to the downside – start a new decline with the short-term target at 1.0033.

EURUSD
Risk Warning: the result of previous trading operations do not guarantee the same results in the future

GBPUSD, “Great Britain Pound vs US Dollar”

After finishing the descending impulse at 1.1965, GBPUSD is correcting up to 1.2061. Later, the market may fall to break 1.1955 and then continue trading downwards with the short-term target at 1.1850.

GBPUSD
Risk Warning: the result of previous trading operations do not guarantee the same results in the future

USDJPY, “US Dollar vs Japanese Yen”

Having completed the correctional wave at 137.12, USDJPY is expected to form a new descending structure to break 134.66 and then continue falling with the target at 133.86.

USDJPY
Risk Warning: the result of previous trading operations do not guarantee the same results in the future

USDCHF, “US Dollar vs Swiss Franc”

USDCHF is still consolidating below 0.9660. Today, the pair may expand the range down to 0.9586 and then resume trading upwards with the target at 0.9738.

USDCHF
Risk Warning: the result of previous trading operations do not guarantee the same results in the future

AUDUSD, “Australian Dollar vs US Dollar”

AUDUSD continues falling to break 0.6909. After that, the instrument may continue trading downwards with the short-term target at 0.6858.

AUDUSD
Risk Warning: the result of previous trading operations do not guarantee the same results in the future

BRENT

Having finished the correction at 103.15, Brent is expected to consolidate there. If later the price breaks the range to the upside, the market may form one more ascending wave towards 106.45, or even extend this structure to teach the short-term target at 108.85.

BRENT
Risk Warning: the result of previous trading operations do not guarantee the same results in the future

XAUUSD, “Gold vs US Dollar”

Gold is still correcting down to 1711.44 and may later start another growth to break 1728.85. After that, the instrument may continue trading upwards with the target at 1749.15.

GOLD
Risk Warning: the result of previous trading operations do not guarantee the same results in the future

S&P 500

The S&P index is still consolidating above 3919.0. Possibly, the asset may break the range to the upside and reach 4100.0. Later, the market may start a new decline towards 4010.0 and then form one more ascending structure with the target at 4233.0.

S&P 500

Article By RoboForex.com

Attention!
Forecasts presented in this section only reflect the author’s private opinion and should not be considered as guidance for trading. RoboForex LP bears no responsibility for trading results based on trading recommendations described in these analytical reviews.

Fed Decision: What you need to know

By ForexTime

When is it due?

  • The FOMC policy statement is due at 6:00PM GMT
  • Fed Chair Jerome Powell is set to hold his press conference at 6:30PM GMT.

Here are the key points to look out for:

  1. The Fed is widely expected to raise its benchmark interest rates by another 75 basis points.
    Anything else would be a surprise.
    A 75-basis point hike is 3 times larger than the customary 25-basis point adjustments that central bankers traditional deploy per meeting. Given the roaring inflation figures around the world, central bankers have been deploying such larger-than-usual hikes in a bid to stop consumer prices from rising uncontrollably.

    Note: Interest rate hikes are a central bank’s main weapon in trying to subdue runaway inflation.

    The Fed has already raised interest rates by a total of 150 basis points since March (excluding today’s forecasted 75bps hike):

  • March: 25bps hike
  • May: 50bps hike
  • June: 75bps hikeAs you can see, each hike has gotten incrementally bigger.

    Hence, faced with multi-decade high inflation, the Fed is roundly expected to fire yet another 3-in-1 shot today. Back-to-back hikes of 75bps at a time are the most aggressive seen out of the US central bank since the 1980s.

    It figures, given that inflation is also at its highest since the early 1980s.

    Recall that, back on July 13th, we learned that the US consumer price index a.k.a. CPI (which is used to measure how much consumer prices have changed) rose by 9.1%.

    Not only did it beat market forecasts, but that was also the fastest CPI year-on-year growth since November 1981.

  1. After today’s decision, markets are expecting an additional 100bps in hikes over the Fed’s remaining three policy meetings scheduled for the rest of the year.Given the forward-looking nature of the markets, investors and traders are already trying to anticipate how high US interest rates will go before the curtains come down on 2022.

    Adding today’s 75bps hike with the additional incoming 100bps by year-end, that would raise the upper bound of Fed Funds target rate up to around 3.5%.

If today’s policy decision and press conference play out exactly as per the above-listed scenarios, then it could be a ho-hum session for FX markets.

However, if there’s any clue that forces markets to significantly alter those above-listed expectations, then we could see heightened volatility across FX markets (and also stocks, commodities, and even crypto; across asset classes).

How would this impact the US dollar?

  • If the Fed triggers a smaller-than-expected 50bps hike, that could result in a softer US dollar.
  • If the Fed triggers a larger 100bps hike, that could jolt the US dollar back to recent heights.
    Up until a couple of weeks ago, some market participants had forecasted a 60% chance that the Fed could trigger such a gargantuan move, in light of the fresh multi-decade high in the headline CPI print (as mentioned above). Those odds (for a 100bps hike today) now stand at just 14%, at the time of writing.
  • If Chair Powell suggests that the Fed will have to incur more hikes through year-end, more than the 100bps that’s been priced in by the markets for the September-December meetings, that should also lift the US dollar.
  • If Chair Powell suggests that the Fed will have to slow down its intended rate hikes, for fear of sending the US economy into a recession, that could see the US dollar moderate further.

Expect a combination of the above-listed scenarios.

How do market forecasts surrounding rate hikes affect FX pairs?

Generally, the more aggressive a central bank is about raising its own rate, the stronger its currency, relative to the other currency whose central bank is deemed to be lagging behind.

For example:

  • The Fed has already raised its rates by 150 basis points since March.After today’s 75bps hike (if it happens), markets expect another 100bps to go through the end of 2022.

    If so, that would bring 2022’s total of Fed rate hikes to 325 basis points.

  • In contrast, the European Central Bank (ECB) has only hiked once so far this year, by 50 basis points just last week.Markets are expecting another 110 bps in hikes through the end of 2022.

    That would bring 2022’s total of ECB rate hikes to 160 basis points

With the Fed clearly being more aggressive with its rates hikes compared to the ECB (325bps vs. 160bps in total hikes expected for 2022) this has resulted in declines EURUSD.

No surprise that the world’s most popularly-traded currency pair has remained around 20-year lows close to parity in recent weeks.

US dollar set to remain sensitive to shifting expectations surrounding incoming Fed rate hikes

In order to assess how the US dollar might react overall in relation to its G10 peers, one could just look at the equally-weighted USD index (as opposed to the benchmark dollar index – DXY), which measures the buck’s performance against six other major currencies all in equal proportions:

  1. Euro
  2. British Pound
  3. Canadian Dollar
  4. Australian Dollar
  5. New Zealand Dollar
  6. Swiss Franc

Key support and resistance levels for USD Index

  • Resistance: 1.195 area (the mid-May and mid-June cycle highs)
  • Stronger resistance set to arrive above 1.21, around the mid-June peak
  • Support: 1.18 (the upward trendline since April)
  • Stronger support set to arrive at the 50-day simple moving average (SMA) around 1.175

Generally, as long as the Fed can persist with its pedal-to-the-metal approach in raising US interest rates, assuming the US economy can withstand such elevated rates, that should ensure that the US dollar remains well supported.


Forex-Time-LogoArticle by ForexTime

ForexTime Ltd (FXTM) is an award winning international online forex broker regulated by CySEC 185/12 www.forextime.com