By ForexTime
As another busy year in the financial markets comes to an end our Senior Market Analyst Lukman Otunuga talks a look at the major stories from 2025.
This review covers the major themes, key movers, the year’s biggest shocks, our forecast scorecard, and the lessons worth taking into 2026.
All performance figures referenced are year-to-date as of 16th December 2025 unless otherwise stated.
Key takeaways
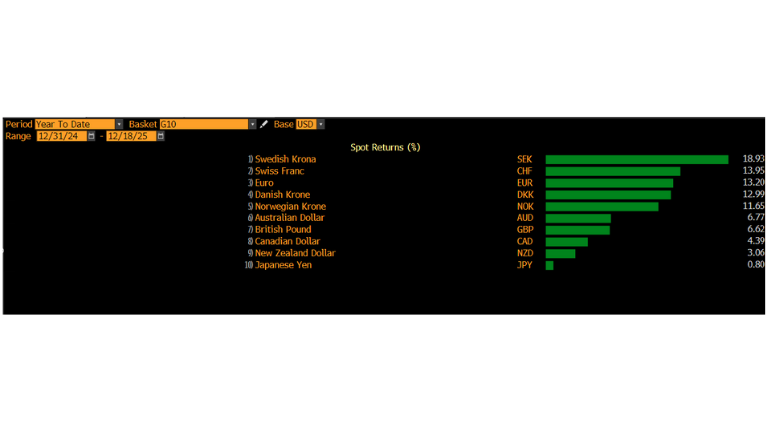
- USD’s grip slips on FX throne, down 9% year-to-date
- Oil ends 2025 with double-digit losses
- EU50 catches up to pack, hitting fresh all-time highs
- Read on as we reveal the FXTM Awards: Best performing assets of 2025!
What happened to markets in 2025?
2025 was defined by uncertainty as investors navigated Trump’s trade war, monetary policy shifts, geopolitical risk and the AI bet.
These themes sparked monstrous levels of volatility, sending tremors across the board. World stocks were placed on a rollercoaster ride in the face of Trump’s trade war before surging due to the AI bet. Nvidia, feeding off this momentum, became the first company ever to reach a market cap of $5 trillion.
The Cboe volatility index saw its biggest ever one-day spike amid the tariff chaos. A shaky dollar offered relief to G10 currencies, while oil prices were mostly pressured by oversupply fears and signs of tepid demand. In the crypto space, bitcoin bulls failed to deliver due to massive ETF outflows and growing sensitivity to macroeconomic forces. Precious metals welcomed the chaos, with one even ending the year with triple-digit gains!
Amid all these developments, there were some standout market shockers:
“Liberation Day” tariffs in April
On 2nd April 2025, the Trump administration announced a universal 10% tariff on all imported goods that would take effect on 15th April. This sent shockwaves across world markets as global growth fears sparked a risk-off stampede. The S&P500 lost more than 10% in the two days after the announcement.
Bitcoin flash crash during October
Bitcoin experienced a sudden flash crash on 10th October, wiping $12,000 from its value in a matter of minutes – resulting in an unprecedented $19 billion worth of liquidations. This brutal selloff was sparked by Trump’s threat to impose an additional 100% tariff on Chinese goods.
Longest US government shutdown in history
The US government shutdown on 1st October and didn’t reopen until 13th November.
Such an event created widespread disruptions, raised fears around the US economic outlook and threw everyone into the dark. Markets are still suffering the consequences with the October US jobs report never to be released.
How did our 2025 predictions play out?
Despite all the chaos and surprises, some of our market predictions came true.
12 months ago, we picked 3 assets that could serve up major opportunities for traders and investors this year.
Here’s how they performed:
1) Dollar loosens grip on FX throne
What we discussed in the 2025 Outlook
Our dollar outlook was firmly bullish due to Trump’s “America First” policies resulting in slower Fed rate cuts, US exceptionalism and safe-haven demand.
How things played out
The USDInd did not see its best year in a decade. Instead prices weakened as Trump’s tariffs sparked concerns over the US economic outlook.
After peaking in January, it was a slippery decline amid growing bets around the Fed cutting interest rates in the face of slowing growth.
Concerns over the Fed’s independence, political uncertainty and risk appetite favouring other currencies fuelled the USD’s decline. The longest US government shutdown in history rubbed salt into the wound.
At the start of the year, markets were only expecting the Fed to cut rates twice in 2025. We saw three rate cuts instead with further cuts expected in 2026.
Technical review
In our 2025 Outlook, we suggested “should prices slip under 105.50, bears may target the 50-week SMA at 103.90, 102.70 and 100.00.”
All bearish price targets were reached.

USD Index down 9% YTD
2) Oil lingers near 2025 lows
What we discussed in the 2025 Outlook
Our outlook on oil was heavily bearish thanks to Trump’s tariffs, global oversupply, OPEC+ output hikes, rising US shale production and still-elevated Fed rates.
How things played out
Oil prices ended 2025 roughly 15% lower but nowhere near the levels seen during the Covid-19 pandemic.
Prices were hit by demand-side fears and oversupply concerns as OPEC kept pumping production to reclaim lost market share.
In 2025, the cartel implemented a series of monthly production increases starting in April. These were part of a plan to gradually reverse previous voluntary output cuts totaling 2.2 million barrels per day (bpd). Rising non-OPEC supply and higher inventories contributed to the downside.
If not for mounting geopolitical risk in the Middle East and sanctions against Russia, oil prices may have extended loss – trading closer to Covid-19 levels.
Technical review
We suggested that “a solid weekly close below $70 may open a path toward $62, $50 and $37.”
Prices hit our first bearish price targets before bottoming out around $63.

Brent Oil down 16% YTD
3) EU plays catchup to hit all-time highs
What we discussed in the 2025 Outlook
We were firmly bullish on the EU50 due to expectations around the ECB cutting rates and easing geopolitical risk in the region.
How things played out
FXTM’s EU50 surged in 2025, gaining over 15% year-to-date.
These gains were powered by lower rates in Europe, robust earnings and a historic change to German government spending which saw hundreds of billions of euros on defense/infrastructure spending.
With more government spending for Europe’s largest economy, this boosted sentiment over the Eurozone’s economic outlook – supporting equities in the region.
Technical review
We stated that “a solid weekly close above 5110 may open a path toward 5250 and the all-time high at 5522. Beyond this point, prices may venture toward 5632.”
The EU50 peaked at 5831 in 2025, fulfilling all our bullish price targets.

EU50 up 17% YTD
FXTM Awards: Best performing assets of 2025
Looking across the FXTM universe, these were the best performing assets we offered in 2025!
- Crypto: Bitcoin Cash ↑ 25% YTD
- Stock Index: SPN35 ↑ 46% YTD
- Metal: XAGUSD (Silver) ↑ 120% YTD
- G10 currency: SEK (Swedish Krona) ↑ 20% YTD
Disclaimer: Data correct as of 16th December 2025.
What lessons can traders learn from 2025?
Volatility offers opportunity regardless of market direction was one of the biggest lessons of 2025.
We went into the year with a Trump-centric focus, bracing for his trade war to throw global markets into chaos.
Trump certainly didn’t disappoint with the knock-on effects impacting commodities, currencies, indices and cryptos.
But markets proved resilient with equities across the globe hitting records and on track for double-digit gains in 2025.
Metals also found their champion in silver, which gained 100% year-to-date amid supply constraints and rate cut bets. Interestingly bitcoin suffered from heavy institutional selling and could be on track for its first negative year since 2022.
We saw the AI bet and expectations around lower interest rates support global stocks this year, but the question is for how long?
What’s the outlook for 2026?
With concerns still lingering around an AI bubble, tariffs starting to bite and geopolitical risk present, things could spice up in 2026.
And this means one thing: more volatility.
Get the inside story on what to expect from markets next year with our 2026 Outlook, which is set to be published early January 2026.
![]() Article by ForexTime
Article by ForexTime
ForexTime Ltd (FXTM) is an award winning international online forex broker regulated by CySEC 185/12 www.forextime.com