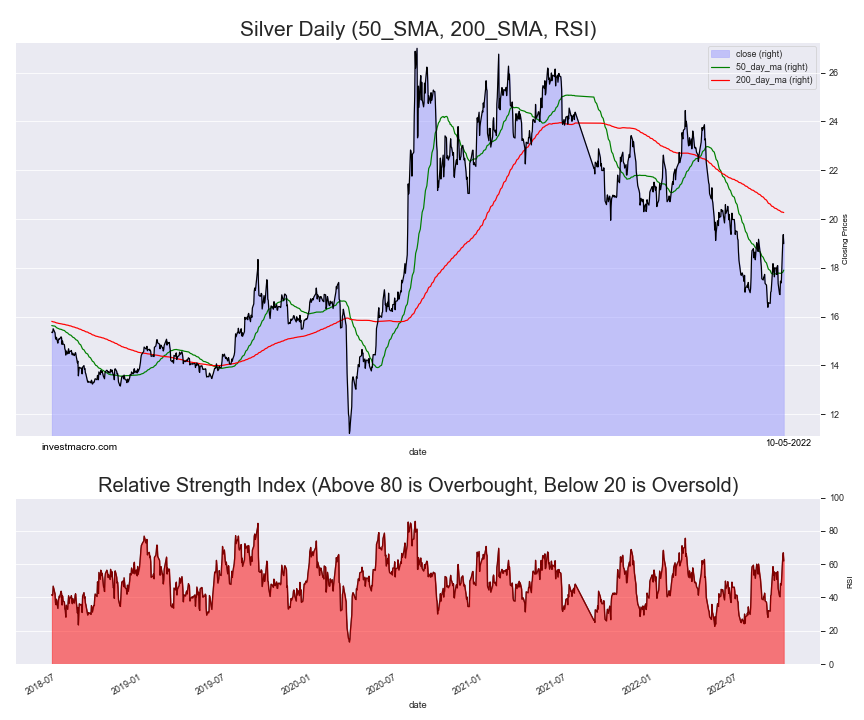
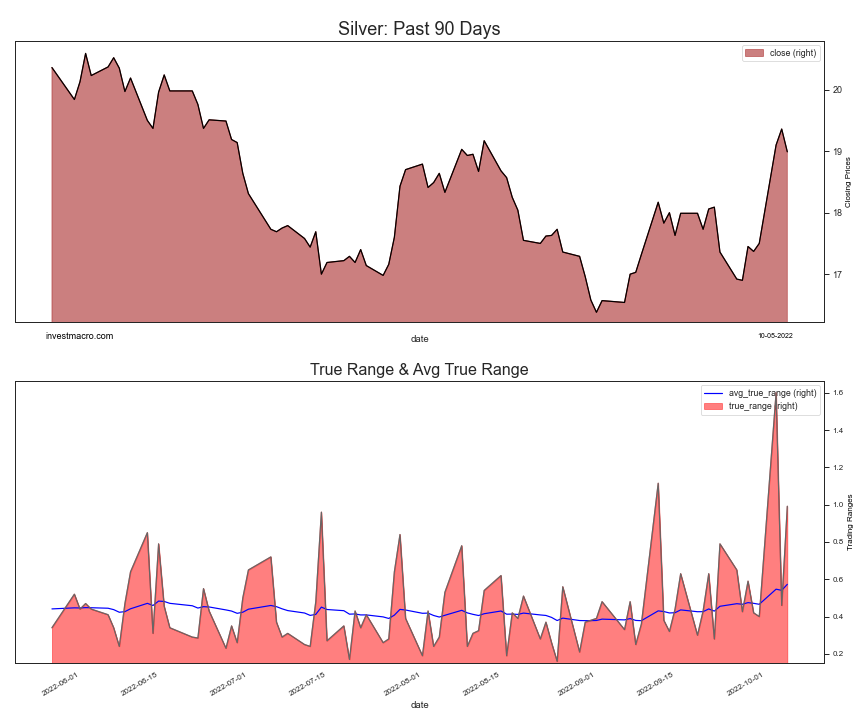
The Silver SLV ETF finished the day with a decline by -1.91 percent, closing the day around the 18.99 price level, according to unofficial data at the New York close. SLV opened the at 18.69 with the high reaching approximately 19.1085 and the low of the day bottoming at 18.3684.
The Silver RSI level is Bullish:
The Relative Strength Index, an indicator that can indicate overbought (above 80) and oversold levels (below 20), shows that the current RSI score is at 61.9. This is a Bullish reading on the daily time-frame.
Silver Trends:
The Silver SLV ETF has risen by 5.15 percent over the past 10 days while seeing a gain by 7.78 over the past 30 days. The 90-day change is -6.50 while the 180-day return and the 365-day return are -12.45 and -22.24, respectively.
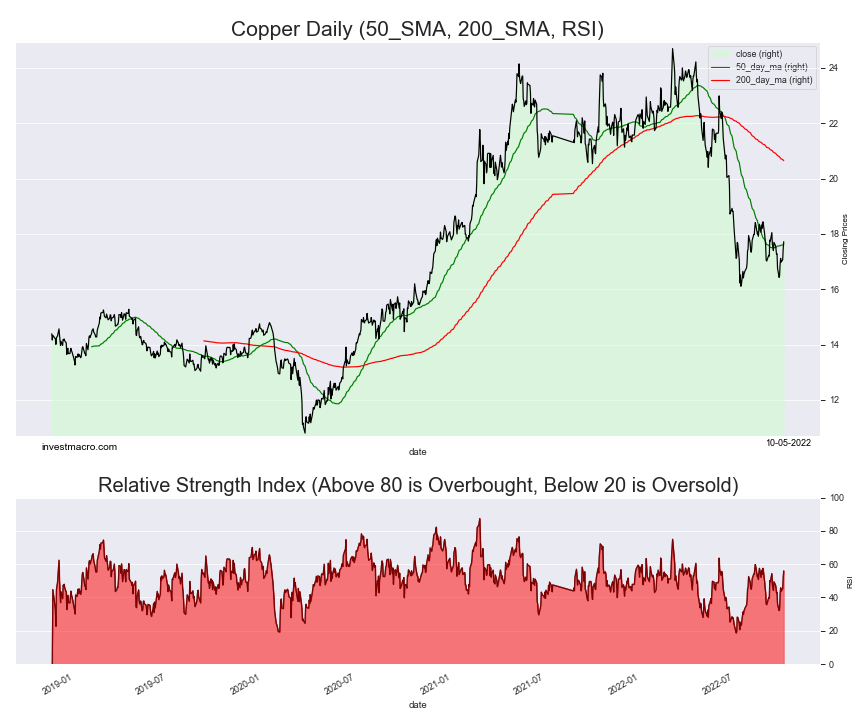
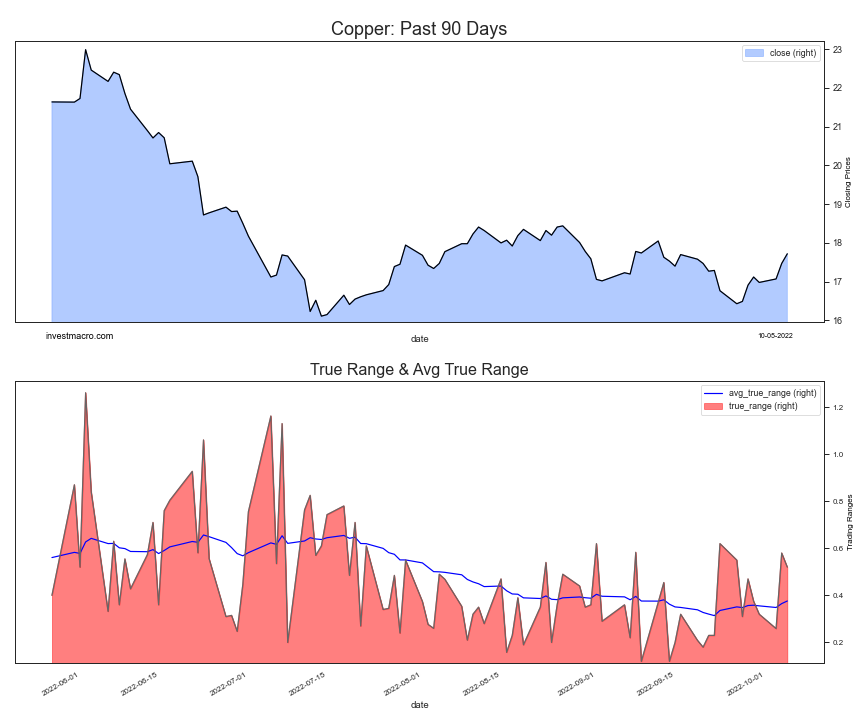
The Copper JJC ETF finished the day with an increase of 1.43 percent and closed the day around the 17.72 price level, according to unofficial data at the New York close. JJC opened the day at 17.41 with the high of the day being 17.78 and the low of the day at 17.26.
The current price is trading slightly above its 50-day simple moving average after a long recent drawdown. The ETF price, meanwhile, is trading quite a ways under the 200-day moving average.
The Copper JJC ETF RSI level is Bullish:
The Relative Strength Index, an indicator that can indicate overbought (above 80) and oversold levels (below 20), shows that the current RSI score is at 56.0. This is a Bullish reading on the daily time-frame.
Copper Trends:
The Copper ETF is higher by 2.61 percent over the past 10 days while seeing a decline of -3.28 over the past 30 days. The 90-day change is -16.85 while the 180-day return and the 365-day return are -19.69 and -15.22, respectively.
Russia’s effort to conscript 300,000 reservists to counter Ukraine’s military advances in Kharkiv has drawn a lot of attention from military and political analysts. But there’s also a potential energy angle. Energy conflicts between Russia and Europe are escalating and likely could worsen as winter approaches.
One might assume that energy workers, who provide fuel and export revenue that Russia desperately needs, are too valuable to the war effort to be conscripted. So far, banking and information technology workers have received an official nod to stay in their jobs.
The situation for oil and gas workers is murkier, including swirling bits of Russian media disinformation about whether the sector will or won’t be targeted for mobilization. Either way, I expect Russia’s oil and gas operations to be destabilized by the next phase of the war.
The explosions in September 2022 that damaged the Nord Stream 1 and 2 gas pipelines from Russia to Europe, and that may have been sabotage, are just the latest developments in this complex and unstable arena. As an analyst of global energy policy, I expect that more energy cutoffs could be in the cards – either directly ordered by the Kremlin to escalate economic pressure on European governments or as a result of new sabotage, or even because shortages of specialized equipment and trained Russian manpower lead to accidents or stoppages.
Dwindling natural gas flows
Russia has significantly reduced natural gas shipments to Europe in an effort to pressure European nations who are siding with Ukraine. In May 2022, the state-owned energy company Gazprom closed a key pipeline that runs through Belarus and Poland.
In June, the company reduced shipments to Germany via the Nord Stream 1 pipeline, which has a capacity of 170 million cubic meters per day, to only 40 million cubic meters per day. A few months later, Gazprom announced that Nord Stream 1 needed repairs and shut it down completely. Now U.S. and European leaders charge that Russia deliberately damaged the pipeline to further disrupt European energy supplies. The timing of the pipeline explosion coincided with the start up of a major new natural gas pipeline from Norway to Poland.
Russia has very limited alternative export infrastructure that can move Siberian natural gas to other customers, like China, so most of the gas it would normally be selling to Europe cannot be shifted to other markets. Natural gas wells in Siberia may need to be taken out of production, or shut in, in energy-speak, which could free up workers for conscription.
European dependence on Russian oil and gas evolved over decades. Now, reducing it is posing hard choices for EU countries.
Restricting Russian oil profits
Russia’s call-up of reservists also includes workers from companies specifically focused on oil. This has led some seasoned analysts to question whether supply disruptions might spread to oil, either by accident or on purpose.
One potential trigger is the Dec. 5, 2022, deadline for the start of phase six of European Union energy sanctions against Russia. Confusion about the package of restrictions and how they will relate to a cap on what buyers will pay for Russian crude oil has muted market volatility so far. But when the measures go into effect, they could initiate a new spike in oil prices.
Under this sanctions package, Europe will completely stop buying seaborne Russian crude oil. This step isn’t as damaging as it sounds, since many buyers in Europe have already shifted to alternative oil sources.
Before Russia invaded Ukraine, it exported roughly 1.4 million barrels per day of crude oil to Europe by sea, divided between Black Sea and Baltic routes. In recent months, European purchases have fallen below 1 million barrels per day. But Russia has actually been able to increase total flows from Black Sea and Baltic ports by redirecting crude oil exports to China, India and Turkey.
Russia has limited access to tankers, insurance and other services associated with moving oil by ship. Until recently, it acquired such services mainly from Europe. The change means that customers like China, India and Turkey have to transfer some of their purchases of Russian oil at sea from Russian-owned or chartered ships to ships sailing under other nations’ flags, whose services might not be covered by the European bans. This process is common and not always illegal, but often is used to evade sanctions by obscuring where shipments from Russia are ending up.
To compensate for this costly process, Russia is discounting its exports by US$40 per barrel. Observers generally assume that whatever Russian crude oil European buyers relinquish this winter will gradually find alternative outlets.
Where is Russian oil going?
The U.S. and its European allies aim to discourage this increased outflow of Russian crude by further limiting Moscow’s access to maritime services, such as tanker chartering, insurance and pilots licensed and trained to handle oil tankers, for any crude oil exports to third parties outside of the G-7 who pay rates above the U.S.-EU price cap. In my view, it will be relatively easy to game this policy and obscure how much Russia’s customers are paying.
On Sept. 9, 2022, the U.S. Treasury Department’s Office of Foreign Assets Control issued new guidance for the Dec. 5 sanctions regime. The policy aims to limit the revenue Russia can earn from its oil while keeping it flowing. It requires that unless buyers of Russian oil can certify that oil cargoes were bought for reduced prices, they will be barred from obtaining European maritime services.
However, this new strategy seems to be failing even before it begins. Denmark is still making Danish pilots available to move tankers through its precarious straits, which are a vital conduit for shipments of Russian crude and refined products. Russia has also found oil tankers that aren’t subject to European oversight to move over a third of the volume that it needs transported, and it will likely obtain more.
Traders have been getting around these sorts of oil sanctions for decades. Tricks of the trade include blending banned oil into other kinds of oil, turning off ship transponders to avoid detection of ship-to-ship transfers, falsifying documentation and delivering oil into and then later out of major storage hubs in remote parts of the globe. This explains why markets have been sanguine about the looming European sanctions deadline.
One fuel at a time
But Russian President Vladimir Putin may have other ideas. Putin has already threatened a larger oil cutoff if the G-7 tries to impose its price cap, warning that Europe will be “as frozen as a wolf’s tail,” referencing a Russian fairy tale.
U.S. officials are counting on the idea that Russia won’t want to damage its oil fields by turning off the taps, which in some cases might create long-term field pressurization problems. In my view, this is poor logic for multiple reasons, including Putin’s proclivity to sacrifice Russia’s economic future for geopolitical goals.
Russia managed to easily throttle back oil production when the COVID-19 pandemic destroyed world oil demand temporarily in 2020, and cutoffs of Russian natural gas exports to Europe have already greatly compromised Gazprom’s commercial future. Such actions show that commercial considerations are not a high priority in the Kremlin’s calculus.
How much oil would come off the market if Putin escalates his energy war? It’s an open question. Global oil demand has fallen sharply in recent months amid high prices and recessionary pressures. The potential loss of 1 million barrels per day of Russian crude oil shipments to Europe is unlikely to jack the price of oil back up the way it did initially in February 2022, when demand was still robust.
Speculators are betting that Putin will want to keep oil flowing to everyone else. China’s Russian crude imports surged as high as 2 million barrels per day following the Ukraine invasion, and India and Turkey are buying significant quantities.
Refined products like diesel fuel are due for further EU sanctions in February 2023. Russia supplies close to 40% of Europe’s diesel fuel at present, so that remains a significant economic lever.
The EU appears to know it must kick dependence on Russian energy completely, but its protected, one-product-at-a-time approach keeps Putin potentially in the driver’s seat. In the U.S., local diesel fuel prices are highly influenced by competition for seaborne cargoes from European buyers. So U.S. East Coast importers could also be in for a bumpy winter.
This article has been updated to reflect conflicting reports about the draft status of Russian oil and gas workers.
Hurricane risk might seem like the obvious problem, but there is a more insidious driver in this financial train wreck.
Finance professor Shahid Hamid, who directs the Laboratory for Insurance at Florida International University, explained how Florida’s insurance market got this bad – and how the state’s insurer of last resort, Citizens Property Insurance, now carrying more than 1 million policies, can weather the storm.
What’s making it so hard for Florida insurers to survive?
One is the rising hurricane risk. Hurricanes Matthew (2016), Irma (2017) and Michael (2018) were all destructive. But a lot of Florida’s hurricane damage is from water, which is covered by the National Flood Insurance Program, rather than by private property insurance.
Another reason is that reinsurance pricing is going up – that’s insurance for insurance companies to help when claims spike.
But the biggest single reason is the “assignment of benefits” problem, involving contractors after a storm. It’s partly fraud and partly taking advantage of loose regulation and court decisions that have affected insurance companies.
It generally looks like this: Contractors will knock on doors and say they can get the homeowner a new roof. The cost of a new roof is maybe $20,000-$30,000. So, the contractor inspects the roof. Often, there isn’t really that much damage. The contractor promises to take care of everything if the homeowner assigns over their insurance benefit. The contractors can then claim whatever they want from the insurance company without needing the homeowner’s consent.
If the insurance company determines the damage wasn’t actually covered, the contractor sues.
So insurance companies are stuck either fighting the lawsuit or settling. Either way, it’s costly.
Other lawsuits may involve homeowners who don’t have flood insurance. Only about 14% of Florida homeowners pay for flood insurance, which is mostly available through the federal National Flood Insurance Program. Some without flood insurance will file damage claims with their property insurance company, arguing that wind caused the problem.
How widespread of a problem are these lawsuits?
Overall, the numbers are pretty striking.
About 9% of homeowner property claims nationwide are filed in Florida, yet 79% of lawsuits related to property claims are filed there.
The legal cost in 2019 was over $3 billion for insurance companies just fighting these lawsuits, and that’s all going to be passed on to homeowners in higher costs.
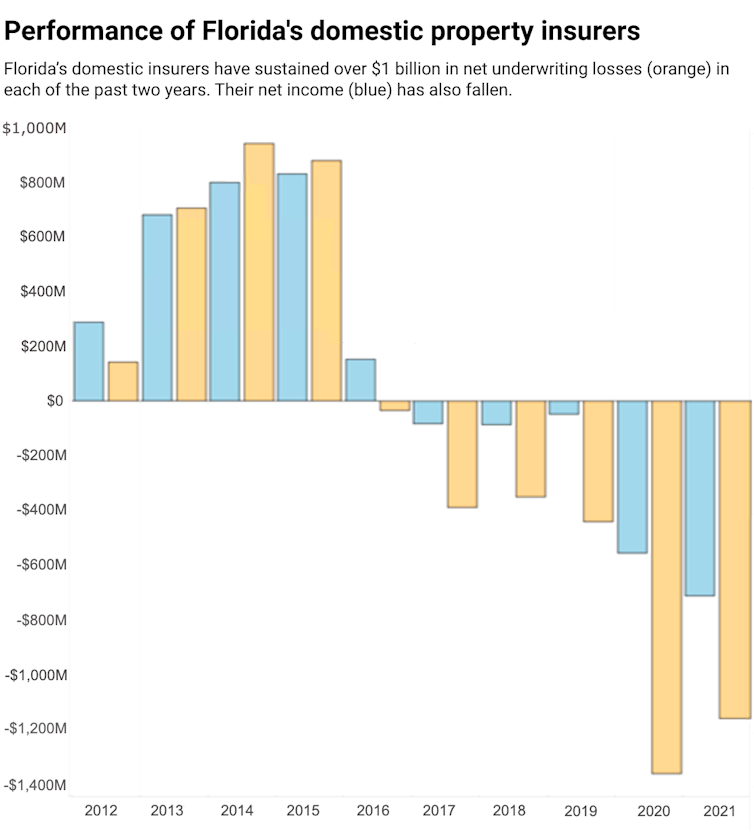
Insurance companies had a more than $1 billion underwriting loss in 2020 and again in 2021. Even with premiums going up so much, they’re still losing money in Florida because of this. And that’s part of the reason so many companies are deciding to leave.
Assignment of benefits is likely more prevalent in Florida than most other states because there is more opportunity from all the roof damage from hurricanes. The state’s regulation is also relatively weak. This may eventually be fixed by the legislature, but that takes time and groups are lobbying against change. It took a long time to pass a law saying the attorney fee has to be capped.
Thirty more are on the Florida Office of Insurance Regulation’s watch list. About 17 of those are likely to be or have been downgraded from A rating, meaning they’re no longer considered to be in good financial health.
The ratings downgrades have consequences for the real estate market. To get a loan from the federal mortgage lenders Freddie Mac and Fannie Mae, you have to have insurance. But if an insurance company is downgraded to below A, Freddie Mac and Fannie Mae won’t accept it. Florida established a $2 billion reinsurance fund in May 2022 that can help smaller insurance companies in situations like this. If they get downgraded, the reinsurance can act like co-signing the loan so the mortgage lenders will accept it.
But it’s a very fragile market.
Ian could be one of the costliest hurricanes in Florida history. I’ve seen estimates of $40 billion to $60 billion in losses. I wouldn’t be surprised if some of those companies on the watch list leave after this storm. That will put more pressure on Citizens Property Insurance, the state’s insurer of last resort.
Some headlines suggest that Florida’s insurer of last resort is also in trouble. Is it really at risk, and what would that mean for residents?
Citizens is not facing collapse, per se. The problem with Citizens is that its policy numbers typically swell after a crisis because as other insurers go out of business, their policies shift to Citizens. It sells off those policies to smaller companies, then another crisis comes along and its policy numbers rise again.
Three years ago, Citizens had half a million policies. Now, it has twice that. All these insurance companies that left in the last two years, their policies have been migrated to Citizens.
Ian will be costly, but Citizens is flush with cash right now because it had a lot of premium increases and built up its reserves.
Citizens also has a lot of backstops.
It has the Florida Hurricane Catastrophe Fund, established in the 1990s after Hurricane Andrew. It’s like reinsurance, but it’s tax-exempt so it can build reserves faster. Once a trigger is reached, Citizens can go to the catastrophe fund and get reimbursed.
More importantly, if Citizens runs out of money, it has the authority to impose a surcharge on everyone’s policies – not just its own policies, but insurance policies across Florida. It can also impose surcharges on some other types of insurance, such as life insurance and auto insurance. After Hurricane Wilma in 2005, Citizens imposed a 1% surcharge on all homeowner policies.
Those surcharges can bail Citizens out to some degree. But if payouts are in the tens of billions of dollars in losses, it will probably also get a bailout from the state.
So, I’m not as worried for Citizens. Homeowners will need help, though, especially if they’re uninsured. I expect Congress will approve some special funding, as it did in the past for hurricanes like Katrina and Sandy, to provide financial aid for residents and communities.
The recent decline can be mostly attributed to the tax cuts announced during Chancellor Kwasi Kwarteng’s recent mini-budget. The £45 billion package caused concern among investors by considerably increasing future government debt, although Kwarteng has since announced a U-turn on the £2 billion plans to abolish cuts for the highest earners. More generally, escalating inflation expectations from this increased fiscal expansion, coupled with ongoing rising energy costs, have had a negative impact on the UK economy and therefore the value of sterling.
The weakening of the pound is also part of a global phenomenon. The US dollar has appreciated by 12% since the end of 2021 against a broad index of currencies, and by more than 20% against the pound. This broad appreciation is attributed to a tightening of US monetary policy and a shift in the risk appetite of investors towards US dollar assets, currently viewed as more of a safe haven.
Given these underlying pressures, questions about the long-term valuation of pound sterling abound, including whether it will settle at parity with the US dollar. An analysis by Bloomberg has shown financial markets believe there is a 60% probability that sterling will reach dollar parity by the end of 2022. A long-term decline in the valuation of the pound increases the price of imported goods, which can feed into consumer price inflation.
If policy makers want to shore up the currency’s strength, several economic theories suggest they must address high inflation expectations, the impacts of Brexit and the various supply chain issues plaguing the economy at present.
Comparing burgers with burgers
Ever heard of the Big Mac Index? Research about long-term movements in exchange rates shows they tend to change in line with relative inflation rates in many countries. This theory, known as purchasing power parity (PPP), uses the price of specific products or baskets of goods to compare currencies and standards of living in different countries.
As such, we can examine the value of the pound compared to other currencies by looking at a single good such as a McDonald’s Big Mac burger. Since this product is the same across countries, the Big Mac can be used to calculate a PPP-implied exchange rate by comparing its price in the UK and the US. In July 2022, the Big Mac Index showed the pound was undervalued by around 14%, based on the exchange rate implied by Big Mac prices in the US versus the UK.
Forecasts by the Bank of England put inflation at 14% by the fourth quarter of 2022, however it is expected to decline to 5% by the end of 2023. The relative fall in UK inflation in 2023 should strengthen the pound, reducing the undervaluation predicted by the Big Mac Index.
Another theory that can help us understand the long-term value of the pound is the link between the sustainability of public debt, sovereign risk and exchange rates. A large increase in the ratio of government debt to gross domestic product (GDP) can trigger a weakening of the currency as financial markets expect more risk, that is, concerns increase about the government being able to repay this debt.
Before the second world war, when sterling was the world’s reserve currency, the government could borrow at low cost. Present-day sterling no longer has the same privileges, however, particularly in recent weeks when sterling has even been compared to emerging market currencies. This theory would dictate that the debt-to-GDP ratio and corresponding sovereign risk must decrease for sterling to recover its value.
Long-term exchange rate movements can also be assessed by comparing productivity differences across countries. Known as the Balassa-Samuelson hypothesis, this theory links productivity slowdowns in a country’s tradeable sector – the industries that produce items that are traded internationally – to a weakening in its real exchange rate (that is, after accounting for differences in inflation).
This theory would therefore link supply chain disruptions resulting from Brexit and the war in Ukraine with fundamental declines in the UK’s productivity, causing the long-term value of the pound to depreciate.
Protecting the pound
Rescuing the pound from long-term parity with the dollar will require action from policy makers. The Bank of England oversees monetary policy – using interest rates, among other tools to control the supply of money to the economy – and has a mandate from the government to tackle price stability by using interest rate increases to bring down inflation. Futures markets forecast an interest rate increase of 4% to 6.25% by May 2023 , showing an expectation that the Bank will continue to hike rates to tackle inflation.
Perhaps the most difficult challenge, however, will be tackling structural change as a result of the recent productivity slowdown due to Brexit and pandemic-related supply chain disruptions. Facilitating post-Brexit trade relations with the European Union could provide the necessary support to the UK’s tradeable sector to help boost the pound.
Without firm plans on these issues, the outlook for the long-term valuation of the pound remains uncertain. While global factors like the risk appetite of investors may continue to keep the dollar strong, domestic factors could mitigate these effects. Monetary tightening, fiscal consolidation and structural reform of the tradeable sector will all contribute to a revaluation of the pound, providing a route for policy makers to shore up its value on the international stage.
Tactical nuclear weapons have burst onto the international stage as Russian President Vladimir Putin, facing battlefield losses in eastern Ukraine, has threatened that Russia will “make use of all weapon systems available to us” if Russia’s territorial integrity is threatened. Putin has characterized the war in Ukraine as an existential battle against the West, which he said wants to weaken, divide and destroy Russia.
I am an international security scholar who has worked on and researched nuclear restraint, nonproliferation and costly signaling theory applied to international relations for two decades. Russia’s large arsenal of tactical nuclear weapons, which are not governed by international treaties, and Putin’s doctrine of threatening their use have raised tensions, but tactical nuclear weapons are not simply another type of battlefield weapon.
Tactical by the numbers
Tactical nuclear weapons, sometimes called battlefield or nonstrategic nuclear weapons, were designed to be used on the battlefield – for example, to counter overwhelming conventional forces like large formations of infantry and armor. They are smaller than strategic nuclear weapons like the warheads carried on intercontinental ballistic missiles.
While experts disagree about precise definitions of tactical nuclear weapons, lower explosive yields, measured in kilotons, and shorter-range delivery vehicles are commonly identified characteristics. Tactical nuclear weapons vary in yields from fractions of 1 kiloton to about 50 kilotons, compared with strategic nuclear weapons, which have yields that range from about 100 kilotons to over a megaton, though much more powerful warheads were developed during the Cold War.
For reference, the atomic bomb dropped on Hiroshima was 15 kilotons, so some tactical nuclear weapons are capable of causing widespread destruction. The largest conventional bomb, the Mother of All Bombs or MOAB, that the U.S. has dropped has a 0.011-kiloton yield.
Delivery systems for tactical nuclear weapons also tend to have shorter ranges, typically under 310 miles (500 kilometers) compared with strategic nuclear weapons, which are typically designed to cross continents.
Because low-yield nuclear weapons’ explosive force is not much greater than that of increasingly powerful conventional weapons, the U.S. military has reduced its reliance on them. Most of its remaining stockpile, about 150 B61 gravity bombs, is deployed in Europe. The U.K. and France have completely eliminated their tactical stockpiles. Pakistan, China, India, Israel and North Korea all have several types of tactical nuclear weaponry.
Russia has retained more tactical nuclear weapons, estimated to be around 2,000, and relied more heavily on them in its nuclear strategy than the U.S. has, mostly due to Russia’s less advanced conventional weaponry and capabilities.
Russia’s tactical nuclear weapons can be deployed by ships, planes and ground forces. Most are deployed on air-to-surface missiles, short-range ballistic missiles, gravity bombs and depth charges delivered by medium-range and tactical bombers, or naval anti-ship and anti-submarine torpedoes. These missiles are mostly held in reserve in central depots in Russia.
Russia has updated its delivery systems to be able to carry either nuclear or conventional bombs. There is heightened concern over these dual capability delivery systems because Russia has used many of these short-range missile systems, particularly the Iskander-M, to bombard Ukraine.
Russia’s Iskander-M mobile short-range ballistic missile can carry conventional or nuclear warheads. Russia has used the missile with conventional warheads in the war in Ukraine.
Tactical nuclear weapons are substantially more destructive than their conventional counterparts even at the same explosive energy. Nuclear explosions are more powerful by factors of 10 million to 100 million than chemical explosions, and leave deadly radiation fallout that would contaminate air, soil, water and food supplies, similar to the disastrous Chernobyl nuclear reactor meltdown in 1986. The interactive simulation site NUKEMAP by Alex Wellerstein depicts the multiple effects of nuclear explosions at various yields.
Can any nuke be tactical?
Unlike strategic nuclear weapons, tactical weapons are not focused on mutually assured destruction through overwhelming retaliation or nuclear umbrella deterrence to protect allies. While tactical nuclear weapons have not been included in arms control agreements, medium-range weapons were included in the now-defunct Intermediate-range Nuclear Forces treaty (1987-2018), which reduced nuclear weapons in Europe.
Both the U.S. and Russia reduced their total nuclear arsenals from about 19,000 and 35,000 respectively at the end of the Cold War to about 3,700 and 4,480 as of January 2022. Russia’s reluctance to negotiate over its nonstrategic nuclear weapons has stymied further nuclear arms control efforts.
The fundamental question is whether tactical nuclear weapons are more “useable” and therefore could potentially trigger a full-scale nuclear war. Their development was part of an effort to overcome concerns that because large-scale nuclear attacks were widely seen as unthinkable, strategic nuclear weapons were losing their value as a deterrent to war between the superpowers. The nuclear powers would be more likely to use tactical nuclear weapons, in theory, and so the weapons would bolster a nation’s nuclear deterrence.
Yet, any use of tactical nuclear weapons would invoke defensive nuclear strategies. In fact, then-Secretary of Defense James Mattis notably stated in 2018: “I do not think there is any such thing as a tactical nuclear weapon. Any nuclear weapon use any time is a strategic game changer.”
This documentary explores how the risk of nuclear war has changed – and possibly increased – since the end of the Cold War.
The U.S. has criticized Russia’s nuclear strategy of escalate to de-escalate, in which tactical nuclear weapons could be used to deter a widening of the war to include NATO.
While there is disagreement among experts, Russian and U.S. nuclear strategies focus on deterrence, and so involve large-scale retaliatory nuclear attacks in the face of any first-nuclear weapon use. This means that Russia’s threat to use nuclear weapons as a deterrent to conventional war is threatening an action that would, under nuclear warfare doctrine, invite a retaliatory nuclear strike if aimed at the U.S. or NATO.
Nukes and Ukraine
I believe Russian use of tactical nuclear weapons in Ukraine would not achieve any military goal. It would contaminate the territory that Russia claims as part of its historic empire and possibly drift into Russia itself. It would increase the likelihood of direct NATO intervention and destroy Russia’s image in the world.
Putin aims to deter Ukraine’s continued successes in regaining territory by preemptively annexing regions in the east of the country after holding staged referendums. He could then declare that Russia would use nuclear weapons to defend the new territory as though the existence of the Russian state were threatened. But I believe this claim stretches Russia’s nuclear strategy beyond belief.
Putin has explicitly claimed that his threat to use tactical nuclear weapons is not a bluff precisely because, from a strategic standpoint, using them is not credible.
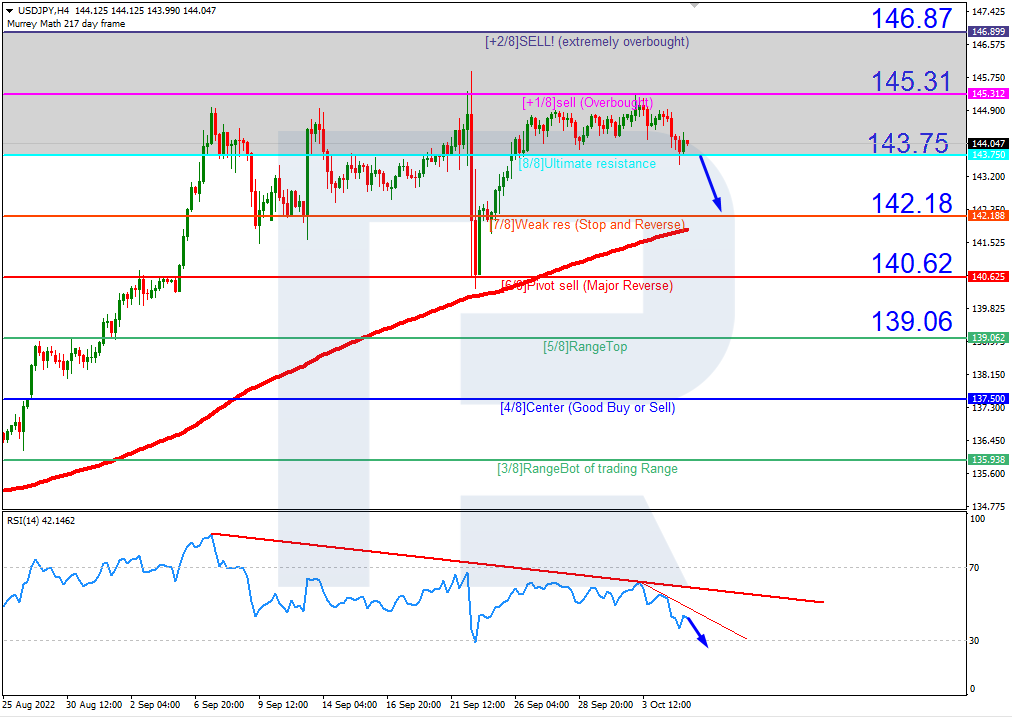
In the H4 chart, USDJPY is trading within the “overbought area”. The Relative Strength Index is slowly moving towards 30. In this case, the pair is expected to break 8/8 (143.75) and then continue falling to reach the support at 7/8 (142.18). However, this scenario may be cancelled if the price breaks the resistance +1/8 (145.31) to the upside. After that, the instrument may grow towards +2/8 (146.87).
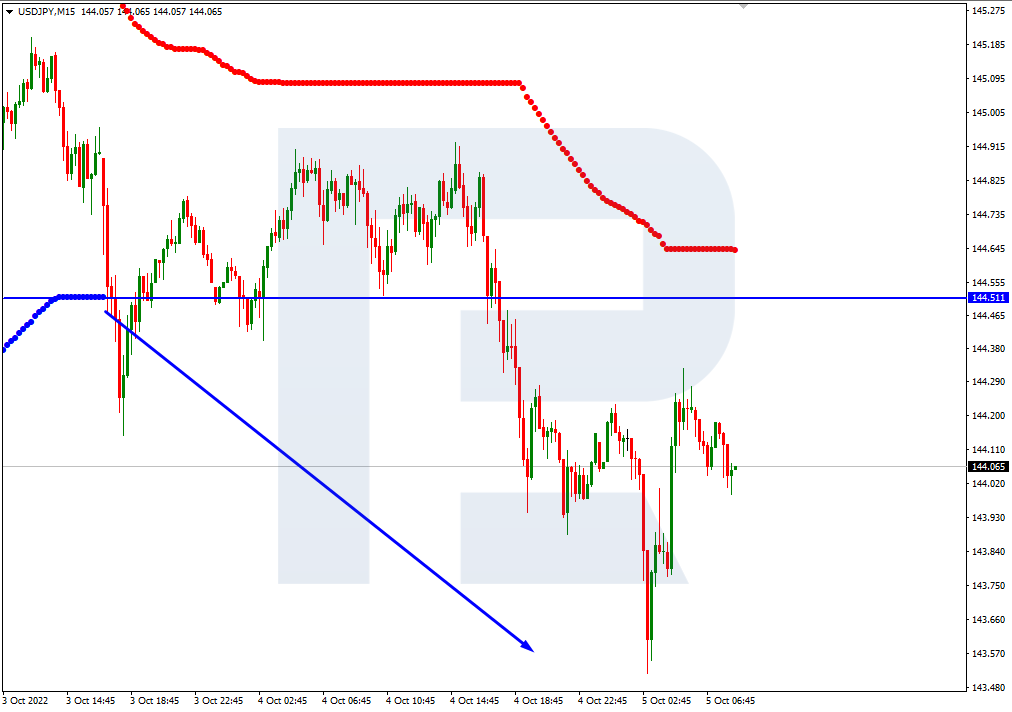
As we can see in the M15 chart, the pair has broken the downside line of the VoltyChannel indicator and, as a result, may continue its decline.
USDCAD, “US Dollar vs Canadian Dollar”
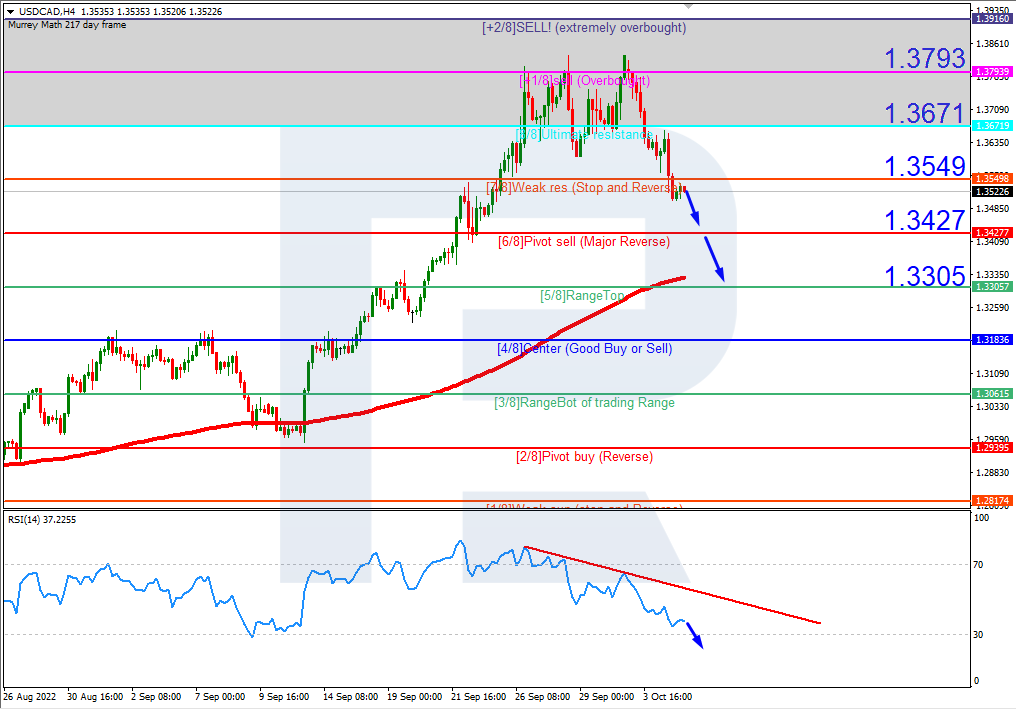
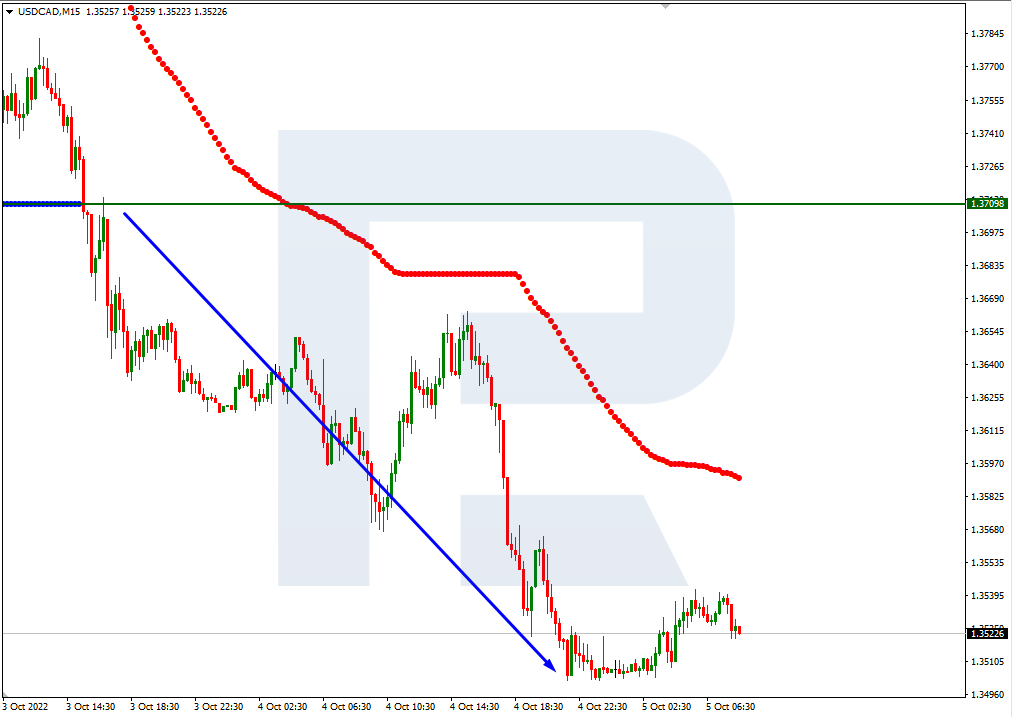
In the H4 chart, USDCAD is still correcting within the uptrend. The Relative Strength Index is approachi9ng 30, but may yet fall a bit. In this case, the price is expected to test 6/8 (1.3427), break it, and then continue moving downwards to reach the support at 5/8 (1.3305). However, this scenario may no longer be valid if the price breaks the resistance at 7/8 (1.3549) to the upside. After that, the instrument may resume growing towards +1/8 (1.3793).
As we can see in the M15 chart, the pair may has broken the downside line of the VoltyChannel indicator and, as a result, may continue trading downwards to reach 5/8 (1.3305) from the H4 chart.
Attention! Forecasts presented in this section only reflect the author’s private opinion and should not be considered as guidance for trading. RoboForex LP bears no responsibility for trading results based on trading recommendations described in these analytical reviews.
The BTC recovered pretty much, but doesn’t want to follow the American stock market. On Wednesday, the asset is mostly fluctuating at $20,238.
So, the major crypto was supported from two sides: a rebound of the American exchanges and a correction in the DXY.
All technical aspects for the BTC remain pretty much the same, without any significant changes. In order for the rebound to transform into a proper growth, the asset must break the resistance at $21,000 and secure above $22,000. A major support area is still at $18,000-$19,000.
What’s next? We should keep a close eye on what will happen to global trends. Stock markets are highly unlikely to continue rising systematically, because the fundamental background hasn’t changed. The rates are rising, so is inflation, and the future prospects for companies and enterprises are still rather vague. However, the data released yesterday showed a slight slowdown in the US labour market, which may prevent the Fed from being aggressive in tightening its monetary policy. Any optimistic vibe is now looking very fragile, that’s why investors are very careful about buying.
Binance is launching a product for XRP
Crypto exchange Binance added the XRP to the list of products for bi-currency investments. It’s a double investment product, which helps to receive more profit during the subscription period regardless of the price movements.
DOGE is in demand again
DOGE has made Top 3 of the most profitable cryptos in the last 24 hours – it has gained over 8%. The market capitalisation has risen to $8.64 billion, while the daily transaction volume was $960 million.
Attention! Forecasts presented in this section only reflect the author’s private opinion and should not be considered as guidance for trading. RoboForex LP bears no responsibility for trading results based on trading recommendations described in these analytical reviews.
The Eurozone Producer Price Index, which measures the inflation rate between businesses and factories, reached an annualized rate of 5% in August, up from 4% in July. The biggest price increase was seen in the energy sector, plus 11.8%, while consumer goods rose by 0.8%. In her speech yesterday, ECB head Christine Lagarde said she did not know whether Eurozone inflation had peaked and was not ready to predict when that peak would be. So, the ECB will only rely on actual data and will gradually raise the interest rate until inflation starts to slow down.
Trading recommendations
Support levels: 0.9845, 0.9748, 0.9666.
Resistance levels: 0.9965, 1.0111, 1.0162, 1.0230
From the technical point of view, the trend on the EUR/USD currency pair on the hourly time frame has changed to bullish. Yesterday, the price broke through the priority change level and consolidated higher. The MACD indicator is positive, the price is trading above the average lines, and the buyer’s pressure remains high. Buy trades should be considered after a small pullback, as the price is overbought now and has strongly deviated from the middle lines. Sell deals can be considered from the resistance level of 1.0111, but only with confirmation.
Alternative scenario: if the price breaks down through the support level of 0.9666 and fixes below it, the downtrend will likely resume.
News feed for 2022.10.05:
– Eurozone Services PMI (m/m) at 11:00 (GMT+3);
– US ISM Services PMI (m/m) at 17:00 (GMT+3);
– US Crude Oil Reserves (w/w) at 17:30 (GMT+3).
The GBP/USD currency pair
Technical indicators of the currency pair:
Prev Open: 1.1317
Prev Close: 1.1467
% chg. over the last day: +1.33 %
The pound/dollar exchange rate is back above 1.14, extending a six-day recovery. Fiscal changes in the UK have had a fairly broad impact on global risk attitudes and likely contributed to a rebound in risk assets and bonds. But analysts believe that, given geopolitical developments in Europe and the energy crisis, it is “too early to rejoice” as winter is ahead. Experts believe that fundamentally, the euro and the pound are still inclined to fall, so any rebound should be used to look for sell deals.
Trading recommendations
Support levels: 1.1281, 1.1121, 1.0915, 1.0816, 1.0711, 1.03
Resistance levels: 1.1478, 1.1693, 1.1816, 1.1901
From the technical point of view, the trend on the GBP/USD currency pair on the hourly time frame has changed to bullish. The price has broken through the priority change level and is confidently trading above the moving averages. The MACD indicator remains positive, but the divergence is present. Under such market conditions, buy trades can be considered from the support level of 1.1281, but only with confirmation. Sell trades are best to look for on intraday time frames, the nearest resistance level is 1.1478, but it is also better with confirmation because the entry is against the main movement.
Alternative scenario: if the price breaks down from the 1.0709 support level and fixes below it, the downtrend will likely resume.
News feed for 2022.10.05:
– UK Services PMI (m/m) at 11:30 (GMT+3).
The USD/JPY currency pair
Technical indicators of the currency pair:
Prev Open: 144.50
Prev Close: 144.14
% chg. over the last day: -0.25 %
Japanese government bond yields fell sharply on Tuesday, following Treasury yields, which fell amid weaker-than-expected US manufacturing data. In a research note, Nomura Securities analyst predicted that the Bank of Japan (BOJ) is likely to loosen its yield curve control (YCC) policy next July, allowing 10-year bond yields to reach 0.4% or 0.5%. Right now, the BOJ is keeping the 10-year yield below 0.25%. In other words, once the BoJ starts to revise its policy, the Japanese yen could gain fundamental support.
Trading recommendations
Support levels: 143.00, 140.60, 139.61, 138.78, 137.65, 136.80, 135.20
Resistance levels: 144.66, 145.35
From the technical point of view, the medium-term trend on the currency pair USD/JPY is bullish. The MACD indicator has become negative, and the price is trading below the moving averages. Under such market conditions, buy trades can be searched for on intraday time frames from the support level of 143.00, but with confirmation. Sell deals can be sought from the resistance level of 144.66, but only with additional confirmation.
Alternative scenario: If the price fixes below 140.60, the downtrend will likely resume.
News feed for 2022.10.05:
– Japan Services PMI (m/m) at 03:30 (GMT+3).
The USD/CAD currency pair
Technical indicators of the currency pair:
Prev Open: 1.3618
Prev Close: 1.3508
% chg. over the last day: -0.81 %
The Canadian dollar strengthened sharply yesterday as the dollar index fell. CAD confidence was boosted by oil, which jumped by 3%, ahead of the OPEC+ meeting. The meeting will take place today, and OPEC+ countries will consider cutting their quota by 1-2 million BPD to support oil prices. If the OPEC+ countries do cut production, this move will drastically reduce supply in the oil market, but the Canadian dollar will only benefit from this as it is a commodity currency.
Trading recommendations
Support levels: 1.3454, 1.3297, 1.3212, 1.3053, 1.2990, 1.2958
Resistance levels: 1.3660, 1.3755, 1.3858, 1.3968
From the point of view of technical analysis, the trend on the USD/CAD currency pair has changed to bearish. The MACD indicator became negative, and the price is trading below the moving lines. Under such market conditions, buy trades should be considered on the lower time frames from the support level of 1.3454, but with confirmation. For sell deals, it is better to consider the resistance level of 1.3660 or 1.3756, but only after the additional confirmation.
Alternative scenario: if the price breaks out through and consolidates above the resistance level of 1.3756, the uptrend will likely resume.
This article reflects a personal opinion and should not be interpreted as an investment advice, and/or offer, and/or a persistent request for carrying out financial transactions, and/or a guarantee, and/or a forecast of future events.
The US Bureau of Labor Statistics (BLS) reported on Tuesday that job openings fell from 11.17 million to 10.05 million during August. On the one hand, the news is negative. Still, on the other hand, investors have begun to wonder if the slowdown seen in the US economy will cause the Federal Reserve to adjust its rate hike trajectory and be less aggressive. The real estate market is already in recession, manufacturing activity is slowing, and the labor market has shown signs of weakness. This caused the dollar and US government bond yields to pull back sharply, allowing the stock market to rise substantially.
At the close of the stock market yesterday, the Dow Jones Index (US30) increased by 2.80%, and the S&P 500 Index (US500) added 3.06%. The NASDAQ Technology Index (US100) jumped by 2.69% on Tuesday.
Monetary and fiscal policies in advanced economies, including continued interest rate hikes, could push the world into a global recession and stagnation, the UN Trade and Development said. The global recession has the potential to cause more damage than the 2008 financial crisis and the Covid-19 shock in 2020. Developing countries in Asia and Africa could bear the brunt of the impending recession, according to the report. If central banks continue to raise interest rates without using other tools and without considering supply-side economics, the desired soft landing is unlikely.
The Global Manufacturing PMI fell into contractionary territory (below the 50 level) for the first time since 2020. The Core Index fell from 50.3 in August to 49.8 in September. The report points to a worsening manufacturing trend in the coming months amid an intensifying downturn in global trade flows, reduced demand related to the ongoing cost-of-living crisis, and growing economic uncertainty about the outlook.
Reuters reported that billionaire Elon Musk plans to realize his initial $44 billion bid to privatize Twitter Inc.
Stock markets in Europe were mostly rising yesterday. Germany’s DAX (DE30) gained 3.78%, France’s CAC 40 (FR40) added 4.24%, Spain’s IBEX 35 (ES35) jumped by 3.14%, Britain’s FTSE 100 (UK100) closed up 2.57% yesterday.
Fiscal changes in the UK had a rather broad impact on global risk attitude and probably contributed to the recovery of risky assets and bonds. But according to analysts, European assets still have a long way to go to restore market positioning, given the energy crisis and geopolitical events. Experts remain skeptical about Europe and believe the recent recovery in sentiment is temporary.
There will be an important OPEC+ meeting today. According to preliminary information, the OPEC+ countries will consider cutting the quota by 1-2 million barrels per day in order to support oil prices. Yesterday, the price of “black gold” jumped by 3% on these rumors. If OPEC+ countries cut production, this step will sharply reduce supply in the oil market. For his part, Kuwait Oil Minister said yesterday that OPEC+ would make a suitable decision to guarantee energy supplies and serve the interests of producers and consumers.
Asian markets traded higher yesterday. Japan’s Nikkei 225 (JP225) gained 2.96%, Hong Kong’s Hang Seng (HK50) did not trade, and Australia’s S&P/ASX 200 (AU200) ended the day up 3.75%.
The Central Bank of New Zealand (RBNZ) raised its interest rate by 0.5% but considered a 0.75% increase. The RBNZ raised interest rates for the eighth time in a row, bringing the interest rate to 3.5%, the highest among major economies. The meeting minutes said that inflation is currently too high and employment is above the maximum sustainable level. RBNZ Governor Adrian Orr noted that their tightening cycle has become “very mature,” although “there is still some work to be done.” The RBNZ expects its OCR rate to be 3.7% by December, and with only one meeting left this year, the RBNZ is very likely to raise the rate by 0.25% at the end of the year.
S&P 500 (F) (US500) 3,791.05 +112.62 (+3.06%)
Dow Jones (US30) 30,316.98 +826.09 (+2.80%)
DAX (DE40) 12,670.48 +461.00 (+3.78%)
FTSE 100 (UK100) 7,086.46 +177.70 (+2.57%)
USD Index 110.15 -1.60 (-1.43%)
Important events for today:
– Australia Retail Sales (m/m) at 03:30 (GMT+3);
– Japan Services PMI (m/m) at 03:30 (GMT+3);
– New Zealand Interest Rate Decision at 04:00 (GMT+3);
– New Zealand RBNZ Rate Statement at 04:00 (GMT+3);
This article reflects a personal opinion and should not be interpreted as an investment advice, and/or offer, and/or a persistent request for carrying out financial transactions, and/or a guarantee, and/or a forecast of future events.