Trade Of The Week: GBPUSD To Plunge Deeper Into Abyss?

By ForexTime 

Our trade of the week was initially reserved for the mighty dollar after the bloodbath in FX markets last week…

However, the pound’s flash crash to record lows hijacked our attention early this morning.

It’s been a rough month for the British pound thanks to a growing list of negative themes.

The economic outlook remains uncertain in the face of rising inflation while the death of Queen Elizabeth II has added to the overall gloom. Sentiment towards the UK economy is shaky despite the BoE recently hiking rates by 50 bp to control inflation. Investors are clearly on edge and this continues to be reflected in increased pound sensitivity to political and economic developments.

The low down…

The key trigger behind the pound’s stomach-churning selloff was the Conservative government’s huge tax-cutting mini-budget revealed last Friday. Growing concern over the fiscal policies fuelling inflation and government debt left investors on edge, adding another layer of uncertainty over the UK’s already gloomy outlook. Chancellor of the Exchequer, Kwasi Kwarteng’s comment on Sunday that there will be “more to come” on tax cuts, simply rubbed salt into the wound – sending the pound sliding to a record low at 1.0350.

With the fundamentals and negative themes clearly favouring pound bears, the path of least resistance for GBPUSD points south.  As the dollar continues to appreciate on Fed hike bets and risk aversion, this may fuel the downside momentum.

What does this mean for the Bank of England?

The pound’s painful depreciation has sparked speculation over an emergency interest rate hike from the BoE to calm markets. Even if the BoE intervenes, short-term gains may be swallowed by long-term themes favouring bears.

According to Bloomberg, traders are pricing as much as 125 basis points of tightening by the next policy meeting in November, springboarding the BoE into the super jumbo hiking club. While such a move could throw the tired pound a lifeline and limit downside losses, the upside could be capped by recession fears and other forces haunting attraction towards sterling.

What to watch out for this week…

This will be a week jampacked with speeches by numerous Federal Reserve officials. The next few days could be incredibly volatile for the dollar which remains highly sensitive to anything relating to inflation and rate hike expectations. If the majority of Fed speakers strike a hawkish note and fuel speculation around more aggressive rate hikes down the road, this could turbo-charge dollar bulls further. Alternatively, a cautious set of Fed officials who drop dovish hints and concerns over the US economic outlook could slam the breaks on the dollar rally. Such a development may invite bears into the scene, dragging the Dollar Index (DXY) lower.

Ultimately, a stronger USD may drag the GBPUSD to fresh all-time lows while a weaker USD could offer space for bulls to fight back – triggering a technical bounce on the currency pair before bears return.

GBPUSD parity dream to become reality?

After hitting an all-time low of 1.0350, the GBPUSD was only 350 pips away from touching parity.

When considering how the currency pair dropped over 400 pips on Friday and well over 1000 pips since the start of last week, the parity dream could become reality sooner than expected.

Prices are under intense pressure in the daily, weekly, and monthly timeframe. Given are we are trading in uncharted territories, there is plenty of space for bears to run rampant. The previous all-time low at 1.0520 (hit back in 1985) could transform into dynamic resistance down the road. Sustained weakness below this point may re-open the doors back towards 1.0350. A breakdown below this level could encourage a selloff towards 1.0100 and parity.

Alternatively, if prices break back above 1.0850 this could trigger a move higher towards 1.1350 where bears may attempt to snatch back control.

On the daily charts, things look ugly. Prices are trading below the 50-, 100- and 200-day SMA while the MACD is below zero. A move back below 1.0520 could signal further declines over the next few days. If 1.0850 proves to be unreliable resistance, the GBPUSD could challenge 1.1300.


Forex-Time-LogoArticle by ForexTime

ForexTime Ltd (FXTM) is an award winning international online forex broker regulated by CySEC 185/12 www.forextime.com

Brent Dropped to Its February Lows

By RoboForex Analytical Department

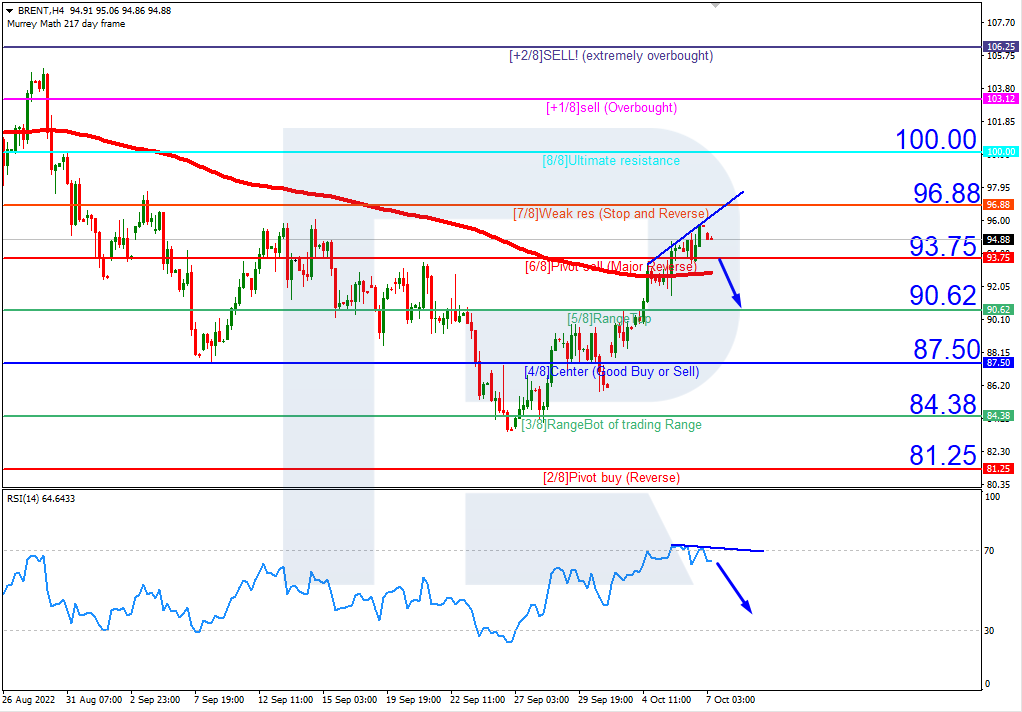
The commodity market is now experiencing a huge stress due to concerns of the reduction in demand for energies. Early in the week, Brent dropped to $85.35 and no other negative factors have appeared since then. However, those that are already here are enough for investors to remain worried. The key aspect is a progressive decline in the global economy, which might cause a serious drop in demand for commodities in general, and in oil in particular.

The Dollar index has reached its multi-year highs and may yet continue to improve. For the commodity market, it’s a negative signal.

In addition, there is a technical factor – when the asset was trying to break $90, bears immediately became more active and the price fell.

On the H4 chart, having broken 88.20 to the downside, Brent continues to fall towards 80.50 and may soon reach 83.00. Later, the market may correct to test 88.20 from below and then start another decline with the closest target at 80.50. From the technical point of view, this scenario is confirmed by the MACD Oscillator: its signal line is moving below 0 and may later continue trading to reach new lows.

As we can see in the H1 chart, after forming a new consolidation range around 88.20 and breaking it to the downside, Brent is still moving downwards with the short-term target at 83.00. Later, the market may correct to return to 88.20 and then resume falling towards 80.50. From the technical point of view, this idea is confirmed by the Stochastic Oscillator: its signal line is moving near the lows below 20. Later, the line may grow to rebound from 50 and resume falling to return to 20.

Disclaimer

Any forecasts contained herein are based on the author’s particular opinion. This analysis may not be treated as trading advice. RoboForex bears no responsibility for trading results based on trading recommendations and reviews contained herein.

Ichimoku Cloud Analysis 26.09.2022 (EURUSD, XAUUSD, NZDUSD)

Article By RoboForex.com

EURUSD, “Euro vs US Dollar”

EURUSD is correcting inside the bearish channel. The instrument is currently moving below Ichimoku Cloud, thus indicating a descending tendency. The markets could indicate that the price may test Tenkan-Sen at 0.9705 and then resume moving downwards to reach 0.9310. Another signal in favour of a further downtrend will be a rebound from the descending channel’s upside border. However, the bearish scenario may no longer be valid if the price breaks the cloud’s upside border and fixes above 1.0055. In this case, the pair may continue growing towards 1.0145.

EURUSD
Risk Warning: the result of previous trading operations do not guarantee the same results in the future

XAUUSD, “Gold vs US Dollar”

XAUUSD is rebounding from the bearish channel’s downside border. The instrument is currently moving below Ichimoku Cloud, thus indicating a descending tendency. The markets could indicate that the price may test Tenkan-Sen at 1645.00 and then resume moving downwards to reach 1585.00. Another signal in favour of a further downtrend will be a rebound from the descending channel’s upside border. However, the bearish scenario may no longer be valid if the price breaks the cloud’s upside border and fixes above 1705.00. In this case, the pair may continue growing towards 1745.00.

XAUUSD
Risk Warning: the result of previous trading operations do not guarantee the same results in the future

NZDUSD, “New Zealand Dollar vs US Dollar”

NZDUSD is rebounding from the support area. The instrument is currently moving below Ichimoku Cloud, thus indicating a descending tendency. The markets could indicate that the price may test Tenkan-Sen at 0.5765 and then resume moving downwards to reach 0.5485. Another signal in favour of a further downtrend will be a rebound from the descending channel’s upside border. However, the bearish scenario may no longer be valid if the price breaks the cloud’s upside border and fixes above 0.6030. In this case, the pair may continue growing towards 0.6125.

NZDUSD

Article By RoboForex.com

Attention!
Forecasts presented in this section only reflect the author’s private opinion and should not be considered as guidance for trading. RoboForex LP bears no responsibility for trading results based on trading recommendations described in these analytical reviews.

Japanese Candlesticks Analysis 26.09.2022 (XAUUSD, NZDUSD, GBPUSD)

Article By RoboForex.com

XAUUSD, “Gold vs US Dollar”

As we can see in the H4 chart, XAUUSD has formed a Hammer reversal pattern not far from the support area. At the moment, the asset may reverse in the form of a new ascending impulse. In this case, the upside correctional target may be at 1645.00. At the same time, the opposite scenario implies that the price may continue falling to reach 1620.00 without any pullbacks up to the resistance level.

XAUUSD
Risk Warning: the result of previous trading operations do not guarantee the same results in the future

NZDUSD, “New Zealand vs US Dollar”

As we can see in the H4 chart, NZDUSD has formed an Inverted Hammer reversal pattern close to the support level. At the moment, the asset is reversing in the form of another ascending wave. In this case, the upside correctional target may be at 0.5770. After that, the asset may rebound from the resistance area and resume moving downwards. However, an alternative scenario implies that the price may fall to reach 0.5625 without any pullbacks.

NZDUSD
Risk Warning: the result of previous trading operations do not guarantee the same results in the future

GBPUSD, “Great Britain Pound vs US Dollar”

As we can see in the H4 chart, GBPUSD has formed a Harami reversal pattern near the support level. At the moment, the pair may reverse in the form of a new rising impulse. In this case, the upside target may be the resistance area at 1.0725. Later, the market may rebound from this level and resume falling. Still, there might be an alternative scenario, in which the asset may continue falling to reach the support level at 1.0165 without testing the resistance area.

GBPUSD

Article By RoboForex.com

Attention!
Forecasts presented in this section only reflect the author’s private opinion and should not be considered as guidance for trading. RoboForex LP bears no responsibility for trading results based on trading recommendations described in these analytical reviews.

The Analytical Overview of the Main Currency Pairs on 2022.09.26

By JustForex

The EUR/USD currency pair

Technical indicators of the currency pair:
  • Prev Open: 0.9826
  • Prev Close: 0.9683
  • % chg. over the last day: -1.47 %

The euro lost almost one and a half percent on Friday against the dollar. Yields on benchmark 10-year US Treasuries reached their highest level in more than 12 years, while German two-year bond yields exceeded 2% for the first time since late 2008. Markets are adjusting to the idea of higher interest rates at the same time that recession warnings are emerging. Analysts believe that in fact, by endorsing the idea of a recession, Fed Chairman Jerome Powell triggered an emotional bear market phase. Weak manufacturing PMI data in Europe added to the negative spiral. The strategists have now changed the rhetoric to: “the question now is not whether we are entering a recession, but how deep it will be.”

Trading recommendations
  • Support levels: 0.9600
  • Resistance levels: 0.9808, 0.9865, 0.9949, 1.0111, 1.0162, 1.0230

From the technical point of view, the trend on the EUR/USD currency pair on the hour time frame is bearish. The price is trading below the moving averages, and sellers’ pressure is still high. The MACD indicator is negative, but divergence can be seen in several timeframes. It is best to look for sell trades from the resistance level of 0.9808 or 0.9866. Buy trades can be considered from the round level 0.9600, but only with confirmation.

Alternative scenario: if the price breaks out through the resistance level of 0.9949 and fixes above it, the uptrend will likely resume.

EUR/USD
News feed for 2022.09.26:
  • – Eurozone German GDP (q/q) at 09:00 (GMT+3);
  • – Eurozone German IFO Business Climate (m/m) at 11:00 (GMT+3);
  • – Eurozone ECB President Lagarde Speaks at 16:00 (GMT+3);
  • – US FOMC Member Mester Speaks at 23:00 (GMT+3).

The GBP/USD currency pair

Technical indicators of the currency pair:
  • Prev Open: 1.1254
  • Prev Close: 1.0848
  • % chg. over the last day: -3.74 %

The British pound fell to a new 37-year low against the dollar after the country’s new finance minister announced historic tax cuts and a huge increase in borrowing. The new measures were announced by the government as harbingers of a new era for growth-oriented Britain. Investors are turning away from UK bonds amid an expected increase in government debt. Yields on UK 2-year government bonds have reached their highest level since October 2007, and yields on 10-year bonds have reached their highest level since 2010. Yields vary inversely with prices. As Britain has reached a record debt-to-GDP ratio, the pound could be revised downward if foreign investors are unwilling to finance the deficit. As a result, Britain risks a currency crisis in which the pound could reach parity with the dollar. According to Bloomberg, analysts expect UK interest rates to reach 5.2% in August 2023, with growing expectations that the Bank of England may raise interest rates by one percentage point at its next meeting in November.

Trading recommendations
  • Support levels: 1.03
  • Resistance levels: 1.0775, 1.1021, 1.1210, 1.1449, 1.1626, 1.1693, 1.1816, 1.1901

From the technical point of view, the trend on the GBP/USD currency pair on the hour time frame is bearish. The price is currently trading below the moving averages, and sellers’ pressure remains. The MACD indicator is deeply negative, with no signs of a reversal. Sell trades are best to look for on intraday time frames, the nearest resistance level is 1.0775. Buy trades can be considered from round levels, but only with confirmation. The nearest support level on the daily timeframe is 1.03.

Alternative scenario: if the price breaks out of the 1.1210 resistance level and fixes above it, the uptrend will likely resume.

GBP/USD
There is no news feed for today.

The USD/JPY currency pair

Technical indicators of the currency pair:
  • Prev Open: 142.31
  • Prev Close: 143.33
  • % chg. over the last day: +0.72 %

According to analysts, the Japanese Yen will trade in the 140-145 range for the rest of the year. On the one hand, the difference in monetary policy between Japan and the USA will put pressure on the yen. On the other hand, the Ministry of Finance of Japan has intervened in the currency for the first time since 1998 and indicated that it will defend the level of USD/JPY 145.

Trading recommendations
  • Support levels: 140.60, 139.61, 138.78, 137.65, 136.80, 135.20
  • Resistance levels: 144.27, 145.00

From the technical point of view, the medium-term trend on the currency pair USD/JPY is bullish despite the intervention. The MACD indicator has become positive, the price has consolidated above the moving averages. Under such market conditions, buy trades can be sought on intraday time frames, but with confirmation. Sell deals can be considered from the resistance level of 144.27 or 145.00, but only with additional confirmation.

Alternative scenario: If the price fixes below 140.60, the downtrend will likely resume.

USD/JPY
News feed for 2022.09.26:
  • – Japan Manufacturing PMI (m/m) at 03:30 (GMT+3);
  • – Japan Services PMI (m/m) at 03:30 (GMT+3);
  • – Japan BoJ Governor Kuroda Speaks at 08:35 (GMT+3).

The USD/CAD currency pair

Technical indicators of the currency pair:
  • Prev Open: 1.3485
  • Prev Close: 1.3587
  • % chg. over the last day: +0.76 %

The Canadian dollar has fallen to its lowest level against the US dollar since July 2020. The US dollar’s uptrend and falling oil prices remain the main catalysts for the Canadian dollar’s decline. On the other hand, analysts believe that when the US dollar’s uptrend reaches its end, the Canadian will be among the few currencies to reverse sharply as the Bank of Canada holds one of its highest interest rates. For the dollar index trend to end, the Fed has signaled that the end of the tightening phase is near. September forecasts suggest that the Canadian dollar may have already bottomed out against the US dollar.

Trading recommendations
  • Support levels: 1.3545, 1.3453, 1.3297, 1.3212, 1.3053, 1.2990, 1.2958, 1.2936, 1.2900
  • Resistance levels: 1.3662

From the point of view of technical analysis, the trend on the USD/CAD currency pair is bullish. The MACD indicator is positive, there is buying pressure, but the divergence is increasing. Under such market conditions, buy trades should be considered on the lower time frames from the support level of 1.3545. For sell deals, it is better to consider the resistance level of 1.3662, but only after the additional confirmation.

Alternative scenario: if the price breaks down and consolidates below the 1.3297 support level, the downtrend will likely resume.

USD/CAD
There is no news feed for today.

By JustForex


This article reflects a personal opinion and should not be interpreted as an investment advice, and/or offer, and/or a persistent request for carrying out financial transactions, and/or a guarantee, and/or a forecast of future events.
Panic selling prevails in financial markets due to aggressive central bank sentiment

By JustForex

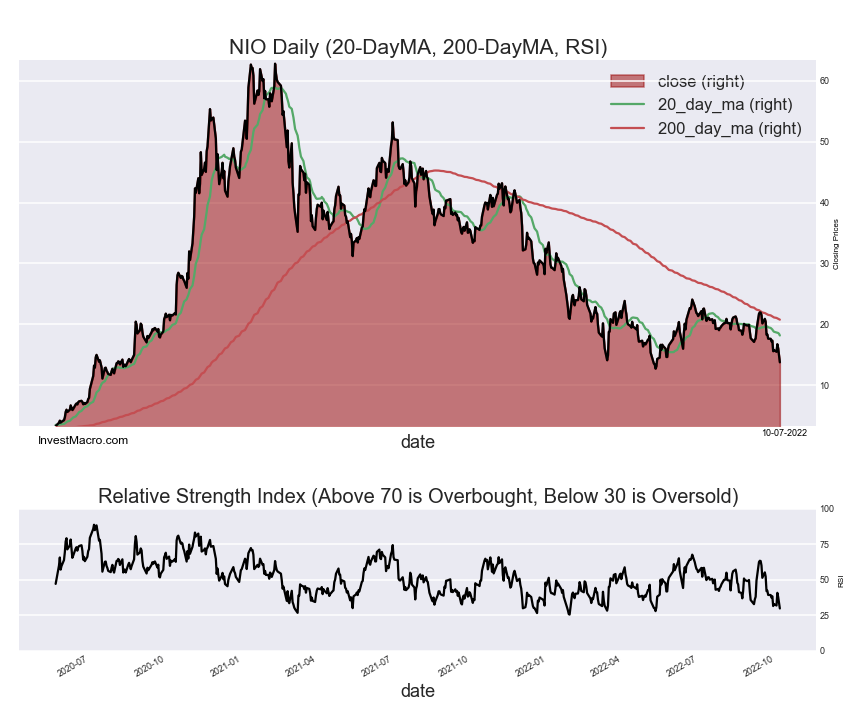
Asset prices around the world fell sharply on Friday as central banks and governments stepped up their fight against inflation. At the close of the stock market on Friday, the Dow Jones Index (US30) decreased by 1.42% (-3.69% for the week) and the S&P 500 Index (US500) fell by 1.72% (-4.07% for the week). Technology index, NASDAQ (US100) lost 0.82% on Friday (-5.92% for the week).

Goldman Sachs strategists Friday lowered their year-end target for the benchmark S&P 500 US stock index to 3600 from 4300. Because monetary policy tends to lag, analysts estimate that the renewed aggressiveness by central banks means the global economy will become even weaker by the middle of next year. The Fed’s latest economic forecasts, released Wednesday along with a massive third straight 75 basis point interest rate hike, show that the Central Bank expects the nation’s unemployment rate to rise to 4.4% next year – up from 3.7% in August. Assuming the labor force remains unchanged, that would mean about 1.2 million people would be out of work. Analysts believe that Fed Chairman Jerome Powell has triggered an emotional bear market phase by endorsing the idea of a recession.

Analysts now dismiss the option that the recession will be short and shallow. Experts are now predicting much tighter monetary policy from central banks and other unintended consequences. The question now is already how deep the recession will be and whether the economy can face any form of financial crisis and a serious global liquidity shock. The US benchmark 10-year Treasury bond yields have reached their highest level in more than 12 years, while German two-year bond yields have exceeded 2% for the first time since late 2008. In the UK, five-year bonds jumped by 50 bps, the biggest one-day jump since late 1991.

Canadian retail sales fell by 2.5% to $61.3 billion in July, the first decline in seven months. Sales fell in 9 of 11 sub-industries, representing 94.5% of retail sales.

Stock markets in Europe were mostly down on Friday. German DAX (DE30) fell by 1.97% (-3.16% for the week), French CAC 40 (FR 40) decreased by 2.28% (-4.39% for the week), Spanish IBEX 35 (ES35) lost 2.46% (-4.68% for the week). British FTSE 100 (UK100) was 1.97% negative (-3.62% for the week).

The manufacturing PMI fell to a low in almost all economies of the region except France. These are clear signs of an impending recession in Europe.

In the UK, recession risks are also rising as the PMI business activity index signals a deepening recession. Companies report that the rising cost of living associated with the energy crisis and growing concerns about the outlook are suppressing demand and reducing output. Renewed supply constraints, soaring energy prices, and the rising cost of imports associated with the weakening pound exacerbate rising price pressures. The British pound and stock indexes fell sharply on Friday after the country’s finance minister announced historic tax cuts and a huge increase in borrowing. Investors are turning away from British bonds amid an expected increase in government debt. According to Bloomberg, analysts expect UK interest rates to reach 5.2% in August 2023, with growing expectations that the Bank of England may raise interest rates by one percentage point at its next meeting in November.

Italians are heading to the polls for a national vote that could bring back the country’s first female prime minister and first far-right-led government since the end of World War II. Incumbent President Mario Draghi, who was kicked out in July because of political strife, has agreed to stay as a caretaker.

Gold remains under pressure because of the rising US dollar index and US government bond yields. As long as the US Federal Reserve follows an aggressive tightening policy, precious metals will have no fundamental reason to rise.

Oil prices fell more than 5% to an eight-month low Friday as the US dollar hit its strongest level in more than two decades and fears that rising interest rates will lead to a recession in major economies, reducing demand for oil. As fears of global growth have turned to panic mode, this will weaken both economic activity and the short-term outlook for oil demand.

Asian markets traded lower last week. Japan’s Nikkei 225 (JP225) decreased by 2.58% for the week, Hong Kong’s Hang Seng (HK50) ended last week down by 4.08%, and Australia’s S&P/ASX 200 (AU200) ended the week in minus 3.92%.

The Chinese yuan finished the trading session at an almost 28-month low as the widening yield gap between the two largest economies in the world continues to put pressure on the Chinese currency.

In the commodities market, futures on orange juice (+6.43%), coffee (+2.32%), and wheat (+2.01%) showed the biggest gains by the end of the week. Natural gas futures (-11.89%), lumber (-9.6%), cotton (-6.8%), WTI oil (-6.29%), platinum (-5.34%), Brent oil (-5.15%), copper (-4.78%), silver (-2.82%) and gold (-1.89%) showed the biggest drop.

S&P 500 (F) (US500) 3,693.23  −64.76  (−1.72%)

Dow Jones (US30) 29,590.41 −486.27 (−1.62%)

DAX (DE40) 12,284.19 −247.44 (−1.97%)

FTSE 100 (UK100) 7,018.60 −140.92 (−1.97%)

USD Index 113.02 +1.67 (+1.50%)

Important events for today:
  • – Japan Manufacturing PMI (m/m) at 03:30 (GMT+3);
  • – Japan Services PMI (m/m) at 03:30 (GMT+3);
  • – Japan BoJ Governor Kuroda Speaks at 08:35 (GMT+3);
  • – Eurozone German GDP (q/q) at 09:00 (GMT+3);
  • – Eurozone German IFO Business Climate (m/m) at 11:00 (GMT+3);
  • – Eurozone ECB President Lagarde Speaks at 16:00 (GMT+3);
  • – US FOMC Member Mester Speaks at 23:00 (GMT+3).

By JustForex


This article reflects a personal opinion and should not be interpreted as an investment advice, and/or offer, and/or a persistent request for carrying out financial transactions, and/or a guarantee, and/or a forecast of future events.
Euro Speculator bets go bullish for 3rd week to lead the COT Changes

By InvestMacro

Forex Currency Futures Open Interest Comparison

Here are the latest charts and statistics for the Commitment of Traders (COT) reports data published by the Commodities Futures Trading Commission (CFTC).

The latest COT data is updated through Tuesday September 20th and shows a quick view of how large market participants (for-profit speculators and commercial traders) were positioned in the futures markets. All currency positions are in direct relation to the US dollar where, for example, a bet for the euro is a bet that the euro will rise versus the dollar while a bet against the euro will be a bet that the euro will decline versus the dollar.

This data is through Tuesday and one day before the US Federal Reserve lifted the benchmark interest rate by 75 basis points to a range of 3 to 3.25 percent.

Euro & British pound lead Weekly Speculator Changes

The COT currency market speculator bets were slightly lower this week as five out of the eleven currency markets we cover had higher positioning while the other six markets had lower speculator contracts.

Leading the gains for the currency markets was the Euro (45,286 contracts) with the Australian dollar (17,294 contracts), the British pound sterling (13,243 contracts), the Swiss franc (565 contracts) and Bitcoin (451 contracts) also showing a positive week.

The currencies leading the declines in speculator bets this week were the Canadian dollar (-10,369 contracts) with the US Dollar Index (-7,738 contracts), the New Zealand dollar (-7,288 contracts), the Mexican peso (-2,652 contracts), the Japanese yen (-588 contracts) and the Brazilian real (-584 contracts) also registering lower bets on the week.

Highlighting the COT Forex data this week was the sharp change in speculator positioning for the Euro again this week. The speculative positioning for the Euro jumped by a total of +45,286 contracts this week following last week’s gain of +24,512 contracts and a rise of +11,327 contracts in the week before that.

Overall, Euro speculator positions have risen by +81,125 contracts in just the past three weeks and have now taken the speculator standing out of bearish territory for the first time in fifteen weeks (current net position of +33,449 contracts). This is a surprising turnabout for this market because speculators (especially in currencies) have tended to be trend-followers historically. They buy when prices are rising and sell when prices are falling.

The Euro has been on a historic decline with prices hitting levels below parity that have not been touched for approximately twenty years. However, the Euro futures speculators have been going the opposite way and increasing their bullish positioning as the currency falls. Will this positioning hold up? Are the speculators buying at the right time (betting on catching the low)? These interesting questions will resolve themselves in the future but it is an example of a current situation that shows that markets and traders can change their tune or flip usual behavior on its head, at least in the short-term.

The Euro price, meanwhile, followed through lower to close out the week. The EURUSD currency pair fell by more than 3 percent and ended the week at the 0.9692 exchange rate – the lowest level since October of 2002.


Data Snapshot of Forex Market Traders | Columns Legend
Sep-20-2022OIOI-IndexSpec-NetSpec-IndexCom-NetCOM-IndexSmalls-NetSmalls-Index
USD Index54,2927627,93172-30,775272,84448
EUR657,9526333,44945-52,3106118,8616
GBP266,29577-54,8432273,48884-18,6458
JPY250,89281-81,2801997,51383-16,23320
CHF40,93723-6,7403912,98664-6,24636
CAD160,314372,0564289269-2,94824
AUD150,54445-40,5564752,12858-11,57224
NZD47,88439-12,5895016,79156-4,2023
MXN172,65036-28,0331523,741834,29261
RUB20,93047,54331-7,15069-39324
BRL51,5004232,36982-34,071181,70285
Bitcoin13,8808057787-812023518


Bitcoin and Brazilian Real lead Strength Scores

Strength Scores (a normalized measure of Speculator positions over a 3-Year range, from 0 to 100 where above 80 is extreme bullish and below 20 is extreme bearish) show that Bitcoin (87.0 percent) and the Brazilian Real (82.2 percent) lead the currency markets this week near the top of their respective ranges and are both in bullish extreme positions (above 80 percent). The US Dollar Index (71.5 percent) comes in as the next highest in the currency markets in strength scores.

On the downside, the Mexican Peso (15.4 percent) and the Japanese Yen (18.8 percent) come in at the lowest strength level currently and are both in extreme bearish positions.


Strength Statistics:
US Dollar Index (71.5 percent) vs US Dollar Index previous week (84.4 percent)
EuroFX (45.3 percent) vs EuroFX previous week (31.4 percent)
British Pound Sterling (21.9 percent) vs British Pound Sterling previous week (10.6 percent)
Japanese Yen (18.8 percent) vs Japanese Yen previous week (19.2 percent)
Swiss Franc (39.4 percent) vs Swiss Franc previous week (38.0 percent)
Canadian Dollar (41.7 percent) vs Canadian Dollar previous week (53.3 percent)
Australian Dollar (47.2 percent) vs Australian Dollar previous week (31.2 percent)
New Zealand Dollar (50.1 percent) vs New Zealand Dollar previous week (62.4 percent)
Mexican Peso (15.4 percent) vs Mexican Peso previous week (16.5 percent)
Brazilian Real (82.2 percent) vs Brazilian Real previous week (82.8 percent)
Bitcoin (87.0 percent) vs Bitcoin previous week (79.1 percent)

Brazilian Real, Euro and Aussie lead the Strength Trends

Strength Score Trends (or move index, calculates the 6-week changes in strength scores) showed that the Brazilian Real (30.1 percent) leads the past six weeks trends for the currency markets this week. The EuroFX (20.9 percent), the Australian Dollar (15.8 percent), Bitcoin (14.1 percent) and the Swiss Franc (7.7 percent) fill out the rest of the positive movers in the latest trends data.

The Japanese Yen (-34.6 percent),  Canadian Dollar (-21.5 percent), New Zealand Dollar (-20.7 percent) and the US Dollar Index (-17.9 percent) were the leaders in the downside trend scores this week.


Strength Trend Statistics:
US Dollar Index (-17.9 percent) vs US Dollar Index previous week (-6.1 percent)
EuroFX (20.9 percent) vs EuroFX previous week (8.3 percent)
British Pound Sterling (-17.5 percent) vs British Pound Sterling previous week (-10.0 percent)
Japanese Yen (-34.6 percent) vs Japanese Yen previous week (-23.4 percent)
Swiss Franc (7.7 percent) vs Swiss Franc previous week (15.2 percent)
Canadian Dollar (-21.5 percent) vs Canadian Dollar previous week (-8.8 percent)
Australian Dollar (15.8 percent) vs Australian Dollar previous week (-1.8 percent)
New Zealand Dollar (-20.7 percent) vs New Zealand Dollar previous week (-6.3 percent)
Mexican Peso (-0.2 percent) vs Mexican Peso previous week (-1.0 percent)
Brazilian Real (30.1 percent) vs Brazilian Real previous week (33.5 percent)
Bitcoin (14.1 percent) vs Bitcoin previous week (12.3 percent)


Individual COT Forex Markets:

US Dollar Index Futures:

US Dollar Index Forex Futures COT ChartThe US Dollar Index large speculator standing this week reached a net position of 27,931 contracts in the data reported through Tuesday. This was a weekly decline of -7,738 contracts from the previous week which had a total of 35,669 net contracts.

This week’s current strength score (the trader positioning range over the past three years, measured from 0 to 100) shows the speculators are currently Bullish with a score of 71.5 percent. The commercials are Bearish with a score of 26.9 percent and the small traders (not shown in chart) are Bearish with a score of 47.6 percent.

US DOLLAR INDEX StatisticsSPECULATORSCOMMERCIALSSMALL TRADERS
– Percent of Open Interest Longs:84.24.110.1
– Percent of Open Interest Shorts:32.760.84.9
– Net Position:27,931-30,7752,844
– Gross Longs:45,7042,2265,479
– Gross Shorts:17,77333,0012,635
– Long to Short Ratio:2.6 to 10.1 to 12.1 to 1
NET POSITION TREND:
– Strength Index Score (3 Year Range Pct):71.526.947.6
– Strength Index Reading (3 Year Range):BullishBearishBearish
NET POSITION MOVEMENT INDEX:
– 6-Week Change in Strength Index:-17.918.0-6.8


Euro Currency Futures:

Euro Currency Futures COT ChartThe Euro Currency large speculator standing this week reached a net position of 33,449 contracts in the data reported through Tuesday. This was a weekly advance of 45,286 contracts from the previous week which had a total of -11,837 net contracts.

This week’s current strength score (the trader positioning range over the past three years, measured from 0 to 100) shows the speculators are currently Bearish with a score of 45.3 percent. The commercials are Bullish with a score of 61.2 percent and the small traders (not shown in chart) are Bearish-Extreme with a score of 5.7 percent.

EURO Currency StatisticsSPECULATORSCOMMERCIALSSMALL TRADERS
– Percent of Open Interest Longs:31.453.911.5
– Percent of Open Interest Shorts:26.361.98.6
– Net Position:33,449-52,31018,861
– Gross Longs:206,564354,89175,546
– Gross Shorts:173,115407,20156,685
– Long to Short Ratio:1.2 to 10.9 to 11.3 to 1
NET POSITION TREND:
– Strength Index Score (3 Year Range Pct):45.361.25.7
– Strength Index Reading (3 Year Range):BearishBullishBearish-Extreme
NET POSITION MOVEMENT INDEX:
– 6-Week Change in Strength Index:20.9-18.9-2.1


British Pound Sterling Futures:

British Pound Sterling Futures COT ChartThe British Pound Sterling large speculator standing this week reached a net position of -54,843 contracts in the data reported through Tuesday. This was a weekly rise of 13,243 contracts from the previous week which had a total of -68,086 net contracts.

This week’s current strength score (the trader positioning range over the past three years, measured from 0 to 100) shows the speculators are currently Bearish with a score of 21.9 percent. The commercials are Bullish-Extreme with a score of 84.0 percent and the small traders (not shown in chart) are Bearish-Extreme with a score of 8.4 percent.

BRITISH POUND StatisticsSPECULATORSCOMMERCIALSSMALL TRADERS
– Percent of Open Interest Longs:15.574.18.2
– Percent of Open Interest Shorts:36.146.515.2
– Net Position:-54,84373,488-18,645
– Gross Longs:41,289197,34621,738
– Gross Shorts:96,132123,85840,383
– Long to Short Ratio:0.4 to 11.6 to 10.5 to 1
NET POSITION TREND:
– Strength Index Score (3 Year Range Pct):21.984.08.4
– Strength Index Reading (3 Year Range):BearishBullish-ExtremeBearish-Extreme
NET POSITION MOVEMENT INDEX:
– 6-Week Change in Strength Index:-17.514.6-2.4


Japanese Yen Futures:

Japanese Yen Forex Futures COT ChartThe Japanese Yen large speculator standing this week reached a net position of -81,280 contracts in the data reported through Tuesday. This was a weekly fall of -588 contracts from the previous week which had a total of -80,692 net contracts.

This week’s current strength score (the trader positioning range over the past three years, measured from 0 to 100) shows the speculators are currently Bearish-Extreme with a score of 18.8 percent. The commercials are Bullish-Extreme with a score of 83.2 percent and the small traders (not shown in chart) are Bearish with a score of 20.5 percent.

JAPANESE YEN StatisticsSPECULATORSCOMMERCIALSSMALL TRADERS
– Percent of Open Interest Longs:13.975.88.9
– Percent of Open Interest Shorts:46.337.015.4
– Net Position:-81,28097,513-16,233
– Gross Longs:34,767190,26722,337
– Gross Shorts:116,04792,75438,570
– Long to Short Ratio:0.3 to 12.1 to 10.6 to 1
NET POSITION TREND:
– Strength Index Score (3 Year Range Pct):18.883.220.5
– Strength Index Reading (3 Year Range):Bearish-ExtremeBullish-ExtremeBearish
NET POSITION MOVEMENT INDEX:
– 6-Week Change in Strength Index:-34.629.5-8.7


Swiss Franc Futures:

Swiss Franc Forex Futures COT ChartThe Swiss Franc large speculator standing this week reached a net position of -6,740 contracts in the data reported through Tuesday. This was a weekly lift of 565 contracts from the previous week which had a total of -7,305 net contracts.

This week’s current strength score (the trader positioning range over the past three years, measured from 0 to 100) shows the speculators are currently Bearish with a score of 39.4 percent. The commercials are Bullish with a score of 64.2 percent and the small traders (not shown in chart) are Bearish with a score of 36.4 percent.

SWISS FRANC StatisticsSPECULATORSCOMMERCIALSSMALL TRADERS
– Percent of Open Interest Longs:20.054.525.5
– Percent of Open Interest Shorts:36.422.840.7
– Net Position:-6,74012,986-6,246
– Gross Longs:8,16722,30910,421
– Gross Shorts:14,9079,32316,667
– Long to Short Ratio:0.5 to 12.4 to 10.6 to 1
NET POSITION TREND:
– Strength Index Score (3 Year Range Pct):39.464.236.4
– Strength Index Reading (3 Year Range):BearishBullishBearish
NET POSITION MOVEMENT INDEX:
– 6-Week Change in Strength Index:7.7-10.311.6


Canadian Dollar Futures:

Canadian Dollar Forex Futures COT ChartThe Canadian Dollar large speculator standing this week reached a net position of 2,056 contracts in the data reported through Tuesday. This was a weekly decrease of -10,369 contracts from the previous week which had a total of 12,425 net contracts.

This week’s current strength score (the trader positioning range over the past three years, measured from 0 to 100) shows the speculators are currently Bearish with a score of 41.7 percent. The commercials are Bullish with a score of 69.5 percent and the small traders (not shown in chart) are Bearish with a score of 24.2 percent.

CANADIAN DOLLAR StatisticsSPECULATORSCOMMERCIALSSMALL TRADERS
– Percent of Open Interest Longs:29.945.721.2
– Percent of Open Interest Shorts:28.645.223.0
– Net Position:2,056892-2,948
– Gross Longs:47,91373,29833,975
– Gross Shorts:45,85772,40636,923
– Long to Short Ratio:1.0 to 11.0 to 10.9 to 1
NET POSITION TREND:
– Strength Index Score (3 Year Range Pct):41.769.524.2
– Strength Index Reading (3 Year Range):BearishBullishBearish
NET POSITION MOVEMENT INDEX:
– 6-Week Change in Strength Index:-21.525.5-23.1


Australian Dollar Futures:

Australian Dollar Forex Futures COT ChartThe Australian Dollar large speculator standing this week reached a net position of -40,556 contracts in the data reported through Tuesday. This was a weekly lift of 17,294 contracts from the previous week which had a total of -57,850 net contracts.

This week’s current strength score (the trader positioning range over the past three years, measured from 0 to 100) shows the speculators are currently Bearish with a score of 47.2 percent. The commercials are Bullish with a score of 57.8 percent and the small traders (not shown in chart) are Bearish with a score of 24.2 percent.

AUSTRALIAN DOLLAR StatisticsSPECULATORSCOMMERCIALSSMALL TRADERS
– Percent of Open Interest Longs:25.861.710.3
– Percent of Open Interest Shorts:52.727.117.9
– Net Position:-40,55652,128-11,572
– Gross Longs:38,79792,90015,434
– Gross Shorts:79,35340,77227,006
– Long to Short Ratio:0.5 to 12.3 to 10.6 to 1
NET POSITION TREND:
– Strength Index Score (3 Year Range Pct):47.257.824.2
– Strength Index Reading (3 Year Range):BearishBullishBearish
NET POSITION MOVEMENT INDEX:
– 6-Week Change in Strength Index:15.8-5.5-23.7


New Zealand Dollar Futures:

New Zealand Dollar Forex Futures COT ChartThe New Zealand Dollar large speculator standing this week reached a net position of -12,589 contracts in the data reported through Tuesday. This was a weekly lowering of -7,288 contracts from the previous week which had a total of -5,301 net contracts.

This week’s current strength score (the trader positioning range over the past three years, measured from 0 to 100) shows the speculators are currently Bullish with a score of 50.1 percent. The commercials are Bullish with a score of 56.3 percent and the small traders (not shown in chart) are Bearish-Extreme with a score of 3.3 percent.

NEW ZEALAND DOLLAR StatisticsSPECULATORSCOMMERCIALSSMALL TRADERS
– Percent of Open Interest Longs:24.369.85.3
– Percent of Open Interest Shorts:50.634.714.1
– Net Position:-12,58916,791-4,202
– Gross Longs:11,64633,4082,544
– Gross Shorts:24,23516,6176,746
– Long to Short Ratio:0.5 to 12.0 to 10.4 to 1
NET POSITION TREND:
– Strength Index Score (3 Year Range Pct):50.156.33.3
– Strength Index Reading (3 Year Range):BullishBullishBearish-Extreme
NET POSITION MOVEMENT INDEX:
– 6-Week Change in Strength Index:-20.719.6-5.0


Mexican Peso Futures:

Mexican Peso Futures COT ChartThe Mexican Peso large speculator standing this week reached a net position of -28,033 contracts in the data reported through Tuesday. This was a weekly fall of -2,652 contracts from the previous week which had a total of -25,381 net contracts.

This week’s current strength score (the trader positioning range over the past three years, measured from 0 to 100) shows the speculators are currently Bearish-Extreme with a score of 15.4 percent. The commercials are Bullish-Extreme with a score of 82.7 percent and the small traders (not shown in chart) are Bullish with a score of 61.2 percent.

MEXICAN PESO StatisticsSPECULATORSCOMMERCIALSSMALL TRADERS
– Percent of Open Interest Longs:56.038.94.3
– Percent of Open Interest Shorts:72.225.21.8
– Net Position:-28,03323,7414,292
– Gross Longs:96,67167,2017,445
– Gross Shorts:124,70443,4603,153
– Long to Short Ratio:0.8 to 11.5 to 12.4 to 1
NET POSITION TREND:
– Strength Index Score (3 Year Range Pct):15.482.761.2
– Strength Index Reading (3 Year Range):Bearish-ExtremeBullish-ExtremeBullish
NET POSITION MOVEMENT INDEX:
– 6-Week Change in Strength Index:-0.2-0.45.9


Brazilian Real Futures:

Brazil Real Futures COT ChartThe Brazilian Real large speculator standing this week reached a net position of 32,369 contracts in the data reported through Tuesday. This was a weekly lowering of -584 contracts from the previous week which had a total of 32,953 net contracts.

This week’s current strength score (the trader positioning range over the past three years, measured from 0 to 100) shows the speculators are currently Bullish-Extreme with a score of 82.2 percent. The commercials are Bearish-Extreme with a score of 18.0 percent and the small traders (not shown in chart) are Bullish-Extreme with a score of 84.7 percent.

BRAZIL REAL StatisticsSPECULATORSCOMMERCIALSSMALL TRADERS
– Percent of Open Interest Longs:81.512.46.0
– Percent of Open Interest Shorts:18.778.62.7
– Net Position:32,369-34,0711,702
– Gross Longs:41,9796,4103,109
– Gross Shorts:9,61040,4811,407
– Long to Short Ratio:4.4 to 10.2 to 12.2 to 1
NET POSITION TREND:
– Strength Index Score (3 Year Range Pct):82.218.084.7
– Strength Index Reading (3 Year Range):Bullish-ExtremeBearish-ExtremeBullish-Extreme
NET POSITION MOVEMENT INDEX:
– 6-Week Change in Strength Index:30.1-29.4-5.3


Bitcoin Futures:

Bitcoin Crypto Futures COT ChartThe Bitcoin large speculator standing this week reached a net position of 577 contracts in the data reported through Tuesday. This was a weekly advance of 451 contracts from the previous week which had a total of 126 net contracts.

This week’s current strength score (the trader positioning range over the past three years, measured from 0 to 100) shows the speculators are currently Bullish-Extreme with a score of 87.0 percent. The commercials are Bearish with a score of 25.0 percent and the small traders (not shown in chart) are Bearish-Extreme with a score of 18.3 percent.

BITCOIN StatisticsSPECULATORSCOMMERCIALSSMALL TRADERS
– Percent of Open Interest Longs:80.41.88.0
– Percent of Open Interest Shorts:76.27.66.3
– Net Position:577-812235
– Gross Longs:11,1572451,107
– Gross Shorts:10,5801,057872
– Long to Short Ratio:1.1 to 10.2 to 11.3 to 1
NET POSITION TREND:
– Strength Index Score (3 Year Range Pct):87.025.018.3
– Strength Index Reading (3 Year Range):Bullish-ExtremeBearishBearish-Extreme
NET POSITION MOVEMENT INDEX:
– 6-Week Change in Strength Index:14.1-36.0-1.5


Article By InvestMacroReceive our weekly COT Newsletter

*COT Report: The COT data, released weekly to the public each Friday, is updated through the most recent Tuesday (data is 3 days old) and shows a quick view of how large speculators or non-commercials (for-profit traders) were positioned in the futures markets.

The CFTC categorizes trader positions according to commercial hedgers (traders who use futures contracts for hedging as part of the business), non-commercials (large traders who speculate to realize trading profits) and nonreportable traders (usually small traders/speculators) as well as their open interest (contracts open in the market at time of reporting). See CFTC criteria here.

Soybean Meal and Gold Top Bullish & Bearish COT Speculator Extremes Positions

By InvestMacro

The latest update for the weekly Commitment of Traders (COT) report was released by the Commodity Futures Trading Commission (CFTC) on Friday for data ending on September 20th.

This weekly Extreme Positions report highlights the Top Most Bullish and Top Most Bearish Positions for the speculator category. Extreme positioning in these markets can foreshadow strong moves in the underlying market.

To signify an extreme position, we use the Strength Index (also known as the COT Index) of each instrument, a common method of measuring COT data. The Strength Index is simply a comparison of current trader positions against the range of positions over the previous 3 years using a range from 0 to 100. We use over 80 percent as extremely bullish and under 20 percent as extremely bearish. You can compare Strength Index scores across all markets in the data tables or cot leaders table.


Speculators or Non-Commercials Notes:

Speculators, classified as non-commercial traders by the CFTC, are made up of large commodity funds, hedge funds and other significant for-profit participants. The Specs are generally regarded as trend-followers in their behavior towards price action – net speculator bets and prices tend to go in the same directions. These traders often look to buy when prices are rising and sell when prices are falling. To illustrate this point, many times speculator contracts can be found at their most extremes (bullish or bearish) when prices are also close to their highest or lowest levels.

These extreme levels can be dangerous for the large speculators as the trade is most crowded, there is less trading ammunition still sitting on the sidelines to push the trend further and prices have moved a significant distance. When the trend becomes exhausted, some speculators take profits while others look to also exit positions when prices fail to continue in the same direction. This process usually plays out over many months to years and can ultimately create a reverse effect where prices start to fall and speculators start a process of selling when prices are falling.


Here Are This Week’s Most Bullish Speculator Positions:

Soybean Meal

soybean meal speculator extreme levels

Soybean Meal comes in at the most bullish extreme standing this week as speculator bets have been on a strong rise in this market. The Soybean Meal speculator level is currently right near the top of its 3-year range with at a 97.9 percent score.

Overall, the Soybean Meal position of +126,470 net speculator contracts is the most bullish position of the past twenty-six weeks.


Bitcoin

bitcoin speculator extreme positions

The Bitcoin speculator trader’s futures position comes in as the second most bullish extreme standing this week. The Bitcoin speculator level is currently at a 87 percent score of its 3-year range.

The speculator position totaled 577 net contracts this week which was a change by 451 contracts from last week.


Brazilian Real

Brazilian Real Speculator Extreme

The Brazil Real speculator trader’s futures position comes next in the extreme standings this week as traders have been adding to their bullish positioning in recent weeks. The BRL speculator level is now at an 82 percent score of its 3-year range.

The speculator position was 32,369 net contracts this week and saw a small dip by -584 contracts from last week. The speculator gross long position was a total of 41,979 contracts versus the total speculator gross short position of 9,610 contracts.


This Week’s Most Bearish Speculator Positions:

Gold

gold cot speculator extreme

The Gold speculator trader’s futures position comes in as the most bearish extreme standing this week as traders have been bailing sharply out of their futures positions. The Gold speculator level has fallen to a zero percent score of its 3-year range. This means that speculator sentiment is at its lowest level of the past three years currently.

The speculator position was 65,722 net contracts this week, a weekly drop of -31,622 contracts from last week and the lowest level in the past 178 weeks.


Russell 2000 Mini

Russell 2000 Mini Speculator Extremes Positions

The Russell 2000 Mini stock market is the next up in bearish extreme positioning this week. The Russell 2000 Mini is at just a 7.4 percent score of its 3-year range.

Speculative traders have been increasing their bearish bets for the Russell Mini for three straight weeks and the current net position (-106,838 net contracts) has now fallen to the most bearish level of the past five weeks.


WTI Crude Oil

wti crude cot speculator extreme

The WTI Crude Oil speculator trader’s futures position comes in next for the most bearish extreme standing on the week. The WTI Crude speculator level is at an 8 percent score out of its 3-year range.

The speculator position was 239,878 net contracts this week which was a change by 12,821 contracts from last week.


5-Year Bond

five year bond cot speculator extreme

The 5-Year Bond speculator trader’s futures position comes in as fourth most bearish extreme standing of the week. The 5-Year speculator level resides at an 11 percent score out of its 3-year range and the overall 5-Year Bond net position has been in a bearish position since April of 2021.

The overall net speculator position was a total of -493,804 net contracts this week and rose by a total of +27,655 contracts from last week.


Article By InvestMacroReceive our weekly COT Newsletter

*COT Report: The COT data, released weekly to the public each Friday, is updated through the most recent Tuesday (data is 3 days old) and shows a quick view of how large speculators or non-commercials (for-profit traders) were positioned in the futures markets.

The CFTC categorizes trader positions according to commercial hedgers (traders who use futures contracts for hedging as part of the business), non-commercials (large traders who speculate to realize trading profits) and nonreportable traders (usually small traders/speculators) as well as their open interest (contracts open in the market at time of reporting). See CFTC criteria here.


Large drop in Gold Speculator bets leads COT Metals Changes

By InvestMacro

Metals Open Interest Comparison

Here are the latest charts and statistics for the Commitment of Traders (COT) data published by the Commodities Futures Trading Commission (CFTC).

The latest COT data is updated through Tuesday September 20th and shows a quick view of how large traders (for-profit speculators and commercial entities) were positioned in the futures markets.

Large drop in Gold bets leads Weekly Speculator Changes

Metals Futures Large Speculator Net Position Changes

The COT precious metals speculator bets were higher overall this week as three out of the five metals markets we cover had higher positioning this week while the other two markets had lower contracts.

Leading the gains for the precious metals markets was Platinum (4,269 contracts) with Silver (3,000 contracts) and Palladium (192 contracts) also showing positive weeks.

The metals markets leading the declines in speculator bets this week were Gold (-31,622 contracts) with Copper (-1,300 contracts) also registering lower bets on the week.

Highlighting the COT Metals data this week was the sharp and continued decline in the Gold futures bets. Speculators dropped their Gold net positions this week by largest one-week amount in the past thirty-three weeks. The Gold position has now fallen for six straight weeks and by a total of -77,129 contracts over that 6-week time period. This bearishness has pushed the overall net positioning to a total of just +65,722 contracts, marking the lowest overall standing for Gold since April 23rd of 2019, a span of 178 weeks. The current investing environment has been a challenging one for Gold and the futures price this week touched the lowest level since April of 2020. Gold closed the week down over 1.6% and right around the $1,655.60 level.


Data Snapshot of Commodity Market Traders | Columns Legend
Sep-20-2022OIOI-IndexSpec-NetSpec-IndexCom-NetCOM-IndexSmalls-NetSmalls-Index
WTI Crude1,481,5451239,8788-261,5689421,69036
Gold469,395565,7220-75,4281009,7060
Silver132,1070-1,64012-5,629907,2694
Copper163,0584-20,2862223,21582-2,9298
Palladium5,9931-1,081171,26182-18033
Platinum62,900272,39012-5,496893,1065
Natural Gas960,2361-155,71132121,3086934,40362
Brent164,02511-37,9034836,732541,17125
Heating Oil292,6343214,09763-25,9414411,84439
Soybeans656,3101884,77339-55,48570-29,28822
Corn1,330,8419305,67769-241,23838-64,4396
Coffee191,433541,07274-42,998301,92617
Sugar744,972837,34544-35,86061-1,4856
Wheat285,5670-4,029149,98274-5,95380


Strength Scores

Strength scores (a measure of the 3-Year range of Speculator positions, from 0 to 100 where above 80 is extreme bullish and below 20 is extreme bearish) showed that Copper (21.7 percent) leads the metals markets with a score that is just outside an extreme bearish position of under 20 percent.

All of the other metals markets we cover continue to have scores under 20 percent with Gold at the lowest with 0.0 percent or the lowest level in three years. Silver (12.3 percent) is up over three percent from last week followed by Platinum (12.3 percent) and Palladium (16.8 percent). Platinum and Palladium are also higher than last week’s scores.


Strength Statistics:
Gold (0.0 percent) vs Gold previous week (11.0 percent)
Silver (12.3 percent) vs Silver previous week (9.0 percent)
Copper (21.7 percent) vs Copper previous week (22.7 percent)
Platinum (12.3 percent) vs Platinum previous week (6.6 percent)
Palladium (16.8 percent) vs Palladium previous week (15.7 percent)

Strength Trends

Strength Score Trends (or move index, calculates the 6-week changes in strength scores) showed that Copper (6.4 percent) leads the past six weeks trends for metals this week. Palladium (5.0 percent) and Platinum (2.1 percent) fill out the other positive movers in the latest trends data.

Gold (-26.8 percent) leads the downside trend scores with a big negative jump from last week’s -9.4 percent trend score and is followed by Silver at a trend score of -5.0 percent.

Metals Speculator Strength Trend (6-Weeks)
Move Statistics:
Gold (-26.8 percent) vs Gold previous week (-9.4 percent)
Silver (-5.0 percent) vs Silver previous week (-6.2 percent)
Copper (6.4 percent) vs Copper previous week (6.6 percent)
Platinum (2.1 percent) vs Platinum previous week (0.9 percent)
Palladium (5.0 percent) vs Palladium previous week (7.2 percent)


Individual COT Metals Market Charts:

Gold Comex Futures:

Gold Futures COT ChartThe Gold Comex Futures large speculator standing this week came in at a net position of 65,722 contracts in the data reported through Tuesday. This was a weekly fall of -31,622 contracts from the previous week which had a total of 97,344 net contracts.

This week’s current strength score (the trader positioning range over the past three years, measured from 0 to 100) shows the speculators are currently Bearish-Extreme with a score of 0.0 percent. The commercials are Bullish-Extreme with a score of 100.0 percent and the small traders (not shown in chart) are Bearish-Extreme with a score of 0.0 percent.

Gold Futures StatisticsSPECULATORSCOMMERCIALSSMALL TRADERS
– Percent of Open Interest Longs:45.730.28.6
– Percent of Open Interest Shorts:31.746.36.6
– Net Position:65,722-75,4289,706
– Gross Longs:214,557141,86240,500
– Gross Shorts:148,835217,29030,794
– Long to Short Ratio:1.4 to 10.7 to 11.3 to 1
NET POSITION TREND:
– Strength Index Score (3 Year Range Pct):0.0100.00.0
– Strength Index Reading (3 Year Range):Bearish-ExtremeBullish-ExtremeBearish-Extreme
NET POSITION MOVEMENT INDEX:
– 6-Week Change in Strength Index:-26.825.5-5.2


Silver Comex Futures:

Silver Futures COT ChartThe Silver Comex Futures large speculator standing this week came in at a net position of -1,640 contracts in the data reported through Tuesday. This was a weekly lift of 3,000 contracts from the previous week which had a total of -4,640 net contracts.

This week’s current strength score (the trader positioning range over the past three years, measured from 0 to 100) shows the speculators are currently Bearish-Extreme with a score of 12.3 percent. The commercials are Bullish-Extreme with a score of 89.9 percent and the small traders (not shown in chart) are Bearish-Extreme with a score of 4.2 percent.

Silver Futures StatisticsSPECULATORSCOMMERCIALSSMALL TRADERS
– Percent of Open Interest Longs:39.638.316.2
– Percent of Open Interest Shorts:40.842.610.7
– Net Position:-1,640-5,6297,269
– Gross Longs:52,32350,66121,383
– Gross Shorts:53,96356,29014,114
– Long to Short Ratio:1.0 to 10.9 to 11.5 to 1
NET POSITION TREND:
– Strength Index Score (3 Year Range Pct):12.389.94.2
– Strength Index Reading (3 Year Range):Bearish-ExtremeBullish-ExtremeBearish-Extreme
NET POSITION MOVEMENT INDEX:
– 6-Week Change in Strength Index:-5.07.5-16.6


Copper Grade #1 Futures:

Copper Futures COT ChartThe Copper Grade #1 Futures large speculator standing this week came in at a net position of -20,286 contracts in the data reported through Tuesday. This was a weekly decrease of -1,300 contracts from the previous week which had a total of -18,986 net contracts.

This week’s current strength score (the trader positioning range over the past three years, measured from 0 to 100) shows the speculators are currently Bearish with a score of 21.7 percent. The commercials are Bullish-Extreme with a score of 81.6 percent and the small traders (not shown in chart) are Bearish-Extreme with a score of 8.4 percent.

Copper Futures StatisticsSPECULATORSCOMMERCIALSSMALL TRADERS
– Percent of Open Interest Longs:28.750.78.1
– Percent of Open Interest Shorts:41.136.59.9
– Net Position:-20,28623,215-2,929
– Gross Longs:46,77382,69313,179
– Gross Shorts:67,05959,47816,108
– Long to Short Ratio:0.7 to 11.4 to 10.8 to 1
NET POSITION TREND:
– Strength Index Score (3 Year Range Pct):21.781.68.4
– Strength Index Reading (3 Year Range):BearishBullish-ExtremeBearish-Extreme
NET POSITION MOVEMENT INDEX:
– 6-Week Change in Strength Index:6.4-3.3-21.4


Platinum Futures:

Platinum Futures COT ChartThe Platinum Futures large speculator standing this week came in at a net position of 2,390 contracts in the data reported through Tuesday. This was a weekly gain of 4,269 contracts from the previous week which had a total of -1,879 net contracts.

This week’s current strength score (the trader positioning range over the past three years, measured from 0 to 100) shows the speculators are currently Bearish-Extreme with a score of 12.3 percent. The commercials are Bullish-Extreme with a score of 89.1 percent and the small traders (not shown in chart) are Bearish-Extreme with a score of 5.2 percent.

Platinum Futures StatisticsSPECULATORSCOMMERCIALSSMALL TRADERS
– Percent of Open Interest Longs:44.138.611.8
– Percent of Open Interest Shorts:40.347.36.9
– Net Position:2,390-5,4963,106
– Gross Longs:27,75624,2817,432
– Gross Shorts:25,36629,7774,326
– Long to Short Ratio:1.1 to 10.8 to 11.7 to 1
NET POSITION TREND:
– Strength Index Score (3 Year Range Pct):12.389.15.2
– Strength Index Reading (3 Year Range):Bearish-ExtremeBullish-ExtremeBearish-Extreme
NET POSITION MOVEMENT INDEX:
– 6-Week Change in Strength Index:2.1-1.8-1.4


Palladium Futures:

Palladium Futures COT ChartThe Palladium Futures large speculator standing this week came in at a net position of -1,081 contracts in the data reported through Tuesday. This was a weekly advance of 192 contracts from the previous week which had a total of -1,273 net contracts.

This week’s current strength score (the trader positioning range over the past three years, measured from 0 to 100) shows the speculators are currently Bearish-Extreme with a score of 16.8 percent. The commercials are Bullish-Extreme with a score of 81.8 percent and the small traders (not shown in chart) are Bearish with a score of 33.4 percent.

Palladium Futures StatisticsSPECULATORSCOMMERCIALSSMALL TRADERS
– Percent of Open Interest Longs:22.959.915.5
– Percent of Open Interest Shorts:40.938.918.5
– Net Position:-1,0811,261-180
– Gross Longs:1,3713,592930
– Gross Shorts:2,4522,3311,110
– Long to Short Ratio:0.6 to 11.5 to 10.8 to 1
NET POSITION TREND:
– Strength Index Score (3 Year Range Pct):16.881.833.4
– Strength Index Reading (3 Year Range):Bearish-ExtremeBullish-ExtremeBearish
NET POSITION MOVEMENT INDEX:
– 6-Week Change in Strength Index:5.0-4.4-6.1


Article By InvestMacroReceive our weekly COT Newsletter

*COT Report: The COT data, released weekly to the public each Friday, is updated through the most recent Tuesday (data is 3 days old) and shows a quick view of how large speculators or non-commercials (for-profit traders) were positioned in the futures markets.

The CFTC categorizes trader positions according to commercial hedgers (traders who use futures contracts for hedging as part of the business), non-commercials (large traders who speculate to realize trading profits) and nonreportable traders (usually small traders/speculators) as well as their open interest (contracts open in the market at time of reporting). See CFTC criteria here.

Eurodollar and 10-Year Bond Speculator bets rebounded before Fed Hikes

By InvestMacro

Here are the latest charts and statistics for the Commitment of Traders (COT) reports data published by the Commodities Futures Trading Commission (CFTC).

The latest COT data is updated through Tuesday September 20th and shows a quick view of how large traders (for-profit speculators and commercial hedgers) were positioned in the futures markets.

Eurodollar and 10-Year Bond bets rebound in Weekly Speculator Changes

The COT bond market speculator bets were mixed this week as four out of the eight bond markets we cover had higher positioning this week while the other four markets had lower contracts.

Leading the gains for the bond markets was the Eurodollar (653,551 contracts) with the 10-Year Bond (123,299 contracts), the 5-Year Bond (27,655 contracts) and the 2-Year Bond (15,766 contracts) also showing positive weeks.

The bond markets leading the declines in speculator bets this week was the Fed Funds (-23,797 contracts) with the Ultra 10-Year (-22,022 contracts), the Ultra US Bond (-19,316 contracts) and the Long US Bond (-4,568 contracts) also registering lower bets on the week.

Highlighting the COT Bonds data this week was the rebound in both the Eurodollar and the 10-Year Bonds positioning. Both of these bond markets continue to have very bearish speculator positions and it has been that way since global central banks started to get more hawkish in raising their benchmark interest rates to fight inflation.

The Eurodollar turned from a bullish speculator position to bearish in May of 2021 while the 10-Year saw its speculative positioning flip bullish to bearish in October of 2021.

This week saw sharp gains for each of these markets with the Eurodollar jumping by a total of +653,551 net contracts and the 10-Year by +123,299 net contracts.

The bonds data was heavily influenced by the Federal Reserve’s interest rate decision coming out the next day that resulted in a 75 basis point hike. This likely prompted traders to take off positions that were deemed risky or to try and position for possible surprise outcomes of the Fed meeting.

The Eurodollar speculative change data for that Tuesday was the result of speculators sharply dropping their gross short positions by a total of -709,309 contracts. This is compared to a -55,758 contract decline in the gross long positions.

The 10-Year change, meanwhile, was the result of speculators raising their gross long positions by a total of +100,016 contracts in addition to reducing their gross short contracts by -23,283 to get the weekly net change of 123,299 contracts.


Data Snapshot of Bond Market Traders | Columns Legend
Sep-20-2022OIOI-IndexSpec-NetSpec-IndexCom-NetCOM-IndexSmalls-NetSmalls-Index
Eurodollar8,320,3650-2,223,771122,509,93186-286,16041
FedFunds1,719,1985824,16443-17,27358-6,89142
2-Year2,020,40211-342,41513438,181100-95,7669
Long T-Bond1,235,65251-99,5395278,9583920,58169
10-Year3,700,92944-229,59038342,34863-112,75853
5-Year3,974,32150-493,80411639,72891-145,92441


Strength Scores

Strength Scores (a normalized measure of Speculator positions over a 3-Year range, from 0 to 100 where above 80 is extreme bullish and below 20 is extreme bearish) showed that the US Treasury Bond (52.2 percent) leads the bonds category and is the only market above the midpoint of its 3-year range. The Fed Funds (42.6 percent) comes in as the next highest bonds market in strength scores.

On the downside, the 5-Year Bond (10.8 percent), the Eurodollar (12.2 percent) and the 2-Year Bond (13.1 percent) come in at the lowest strength levels currently and are all in bearish extreme positions (below 20 percent).

Strength Statistics:
Fed Funds (42.6 percent) vs Fed Funds previous week (45.5 percent)
2-Year Bond (13.1 percent) vs 2-Year Bond previous week (9.9 percent)
5-Year Bond (10.8 percent) vs 5-Year Bond previous week (6.7 percent)
10-Year Bond (37.5 percent) vs 10-Year Bond previous week (18.8 percent)
Ultra 10-Year Bond (21.3 percent) vs Ultra 10-Year Bond previous week (27.0 percent)
US Treasury Bond (52.2 percent) vs US Treasury Bond previous week (53.7 percent)
Ultra US Treasury Bond (35.9 percent) vs Ultra US Treasury Bond previous week (43.8 percent)
Eurodollar (12.2 percent) vs Eurodollar previous week (0.2 percent)

Strength Trends

Strength Score Trends (or move index, calculates the 6-week changes in strength scores) show that the Eurodollar (12.2 percent) leads the past six weeks trends for bonds this week. The 10-Year Bond (8.6 percent), the Ultra 10-Year Bond (4.6 percent) and the Fed Funds (2.9 percent) fill out the rest of the positive movers in the latest trends data.

The 2-Year Bond (-34.4 percent) leads the downside trend scores currently while the next market with lower trend scores were the 5-Year Bond (-21.6 percent) followed by the US Treasury Bond (-16.9 percent).


Strength Trend Statistics:
Fed Funds (2.9 percent) vs Fed Funds previous week (6.3 percent)
2-Year Bond (-34.4 percent) vs 2-Year Bond previous week (-52.2 percent)
5-Year Bond (-21.6 percent) vs 5-Year Bond previous week (-28.1 percent)
10-Year Bond (8.6 percent) vs 10-Year Bond previous week (-8.7 percent)
Ultra 10-Year Bond (4.6 percent) vs Ultra 10-Year Bond previous week (7.7 percent)
US Treasury Bond (-16.9 percent) vs US Treasury Bond previous week (-12.7 percent)
Ultra US Treasury Bond (-1.9 percent) vs Ultra US Treasury Bond previous week (2.3 percent)
Eurodollar (12.2 percent) vs Eurodollar previous week (-1.7 percent)


Individual Markets:

3-Month Eurodollars Futures:

Eurodollar Bonds Futures COT ChartThe 3-Month Eurodollars large speculator standing this week recorded a net position of -2,223,771 contracts in the data reported through Tuesday. This was a weekly advance of 653,551 contracts from the previous week which had a total of -2,877,322 net contracts.

This week’s current strength score (the trader positioning range over the past three years, measured from 0 to 100) shows the speculators are currently Bearish-Extreme with a score of 12.2 percent. The commercials are Bullish-Extreme with a score of 85.9 percent and the small traders (not shown in chart) are Bearish with a score of 41.5 percent.

3-Month Eurodollars StatisticsSPECULATORSCOMMERCIALSSMALL TRADERS
– Percent of Open Interest Longs:6.769.44.8
– Percent of Open Interest Shorts:33.439.28.2
– Net Position:-2,223,7712,509,931-286,160
– Gross Longs:556,5375,772,986398,527
– Gross Shorts:2,780,3083,263,055684,687
– Long to Short Ratio:0.2 to 11.8 to 10.6 to 1
NET POSITION TREND:
– Strength Index Score (3 Year Range Pct):12.285.941.5
– Strength Index Reading (3 Year Range):Bearish-ExtremeBullish-ExtremeBearish
NET POSITION MOVEMENT INDEX:
– 6-Week Change in Strength Index:12.2-12.47.4


30-Day Federal Funds Futures:

Federal Funds 30-Day Bonds Futures COT ChartThe 30-Day Federal Funds large speculator standing this week recorded a net position of 24,164 contracts in the data reported through Tuesday. This was a weekly fall of -23,797 contracts from the previous week which had a total of 47,961 net contracts.

This week’s current strength score (the trader positioning range over the past three years, measured from 0 to 100) shows the speculators are currently Bearish with a score of 42.6 percent. The commercials are Bullish with a score of 57.8 percent and the small traders (not shown in chart) are Bearish with a score of 42.1 percent.

30-Day Federal Funds StatisticsSPECULATORSCOMMERCIALSSMALL TRADERS
– Percent of Open Interest Longs:12.771.72.3
– Percent of Open Interest Shorts:11.372.72.7
– Net Position:24,164-17,273-6,891
– Gross Longs:217,6311,232,60139,438
– Gross Shorts:193,4671,249,87446,329
– Long to Short Ratio:1.1 to 11.0 to 10.9 to 1
NET POSITION TREND:
– Strength Index Score (3 Year Range Pct):42.657.842.1
– Strength Index Reading (3 Year Range):BearishBullishBearish
NET POSITION MOVEMENT INDEX:
– 6-Week Change in Strength Index:2.9-3.513.7


2-Year Treasury Note Futures:

2-Year Treasury Bonds Futures COT ChartThe 2-Year Treasury Note large speculator standing this week recorded a net position of -342,415 contracts in the data reported through Tuesday. This was a weekly boost of 15,766 contracts from the previous week which had a total of -358,181 net contracts.

This week’s current strength score (the trader positioning range over the past three years, measured from 0 to 100) shows the speculators are currently Bearish-Extreme with a score of 13.1 percent. The commercials are Bullish-Extreme with a score of 100.0 percent and the small traders (not shown in chart) are Bearish-Extreme with a score of 8.7 percent.

2-Year Treasury Note StatisticsSPECULATORSCOMMERCIALSSMALL TRADERS
– Percent of Open Interest Longs:6.983.67.6
– Percent of Open Interest Shorts:23.861.912.4
– Net Position:-342,415438,181-95,766
– Gross Longs:139,3581,688,474154,106
– Gross Shorts:481,7731,250,293249,872
– Long to Short Ratio:0.3 to 11.4 to 10.6 to 1
NET POSITION TREND:
– Strength Index Score (3 Year Range Pct):13.1100.08.7
– Strength Index Reading (3 Year Range):Bearish-ExtremeBullish-ExtremeBearish-Extreme
NET POSITION MOVEMENT INDEX:
– 6-Week Change in Strength Index:-34.440.5-18.2


5-Year Treasury Note Futures:

5-Year Treasury Bonds Futures COT ChartThe 5-Year Treasury Note large speculator standing this week recorded a net position of -493,804 contracts in the data reported through Tuesday. This was a weekly rise of 27,655 contracts from the previous week which had a total of -521,459 net contracts.

This week’s current strength score (the trader positioning range over the past three years, measured from 0 to 100) shows the speculators are currently Bearish-Extreme with a score of 10.8 percent. The commercials are Bullish-Extreme with a score of 91.3 percent and the small traders (not shown in chart) are Bearish with a score of 40.9 percent.

5-Year Treasury Note StatisticsSPECULATORSCOMMERCIALSSMALL TRADERS
– Percent of Open Interest Longs:6.784.77.3
– Percent of Open Interest Shorts:19.168.611.0
– Net Position:-493,804639,728-145,924
– Gross Longs:266,4523,366,448291,033
– Gross Shorts:760,2562,726,720436,957
– Long to Short Ratio:0.4 to 11.2 to 10.7 to 1
NET POSITION TREND:
– Strength Index Score (3 Year Range Pct):10.891.340.9
– Strength Index Reading (3 Year Range):Bearish-ExtremeBullish-ExtremeBearish
NET POSITION MOVEMENT INDEX:
– 6-Week Change in Strength Index:-21.619.3-4.3


10-Year Treasury Note Futures:

10-Year Treasury Notes Bonds Futures COT ChartThe 10-Year Treasury Note large speculator standing this week recorded a net position of -229,590 contracts in the data reported through Tuesday. This was a weekly gain of 123,299 contracts from the previous week which had a total of -352,889 net contracts.

This week’s current strength score (the trader positioning range over the past three years, measured from 0 to 100) shows the speculators are currently Bearish with a score of 37.5 percent. The commercials are Bullish with a score of 62.6 percent and the small traders (not shown in chart) are Bullish with a score of 53.3 percent.

10-Year Treasury Note StatisticsSPECULATORSCOMMERCIALSSMALL TRADERS
– Percent of Open Interest Longs:10.777.59.0
– Percent of Open Interest Shorts:16.968.212.1
– Net Position:-229,590342,348-112,758
– Gross Longs:397,0502,868,123334,645
– Gross Shorts:626,6402,525,775447,403
– Long to Short Ratio:0.6 to 11.1 to 10.7 to 1
NET POSITION TREND:
– Strength Index Score (3 Year Range Pct):37.562.653.3
– Strength Index Reading (3 Year Range):BearishBullishBullish
NET POSITION MOVEMENT INDEX:
– 6-Week Change in Strength Index:8.6-5.2-3.1


Ultra 10-Year Notes Futures:

Ultra 10-Year Treasury Notes Bonds Futures COT ChartThe Ultra 10-Year Notes large speculator standing this week recorded a net position of -28,808 contracts in the data reported through Tuesday. This was a weekly reduction of -22,022 contracts from the previous week which had a total of -6,786 net contracts.

This week’s current strength score (the trader positioning range over the past three years, measured from 0 to 100) shows the speculators are currently Bearish with a score of 21.3 percent. The commercials are Bullish with a score of 79.4 percent and the small traders (not shown in chart) are Bearish with a score of 45.2 percent.

Ultra 10-Year Notes StatisticsSPECULATORSCOMMERCIALSSMALL TRADERS
– Percent of Open Interest Longs:8.381.19.0
– Percent of Open Interest Shorts:10.470.018.0
– Net Position:-28,808152,285-123,477
– Gross Longs:113,6571,109,324123,083
– Gross Shorts:142,465957,039246,560
– Long to Short Ratio:0.8 to 11.2 to 10.5 to 1
NET POSITION TREND:
– Strength Index Score (3 Year Range Pct):21.379.445.2
– Strength Index Reading (3 Year Range):BearishBullishBearish
NET POSITION MOVEMENT INDEX:
– 6-Week Change in Strength Index:4.6-1.3-8.3


US Treasury Bonds Futures:

US Year Treasury Notes Long Bonds Futures COT ChartThe US Treasury Bonds large speculator standing this week recorded a net position of -99,539 contracts in the data reported through Tuesday. This was a weekly fall of -4,568 contracts from the previous week which had a total of -94,971 net contracts.

This week’s current strength score (the trader positioning range over the past three years, measured from 0 to 100) shows the speculators are currently Bullish with a score of 52.2 percent. The commercials are Bearish with a score of 38.8 percent and the small traders (not shown in chart) are Bullish with a score of 68.9 percent.

US Treasury Bonds StatisticsSPECULATORSCOMMERCIALSSMALL TRADERS
– Percent of Open Interest Longs:6.277.113.8
– Percent of Open Interest Shorts:14.270.712.2
– Net Position:-99,53978,95820,581
– Gross Longs:76,399952,947170,936
– Gross Shorts:175,938873,989150,355
– Long to Short Ratio:0.4 to 11.1 to 11.1 to 1
NET POSITION TREND:
– Strength Index Score (3 Year Range Pct):52.238.868.9
– Strength Index Reading (3 Year Range):BullishBearishBullish
NET POSITION MOVEMENT INDEX:
– 6-Week Change in Strength Index:-16.919.8-2.9


Ultra US Treasury Bonds Futures:

Ultra US Year Treasury Notes Long Bonds Futures COT ChartThe Ultra US Treasury Bonds large speculator standing this week recorded a net position of -365,913 contracts in the data reported through Tuesday. This was a weekly fall of -19,316 contracts from the previous week which had a total of -346,597 net contracts.

This week’s current strength score (the trader positioning range over the past three years, measured from 0 to 100) shows the speculators are currently Bearish with a score of 35.9 percent. The commercials are Bullish with a score of 76.5 percent and the small traders (not shown in chart) are Bullish with a score of 54.0 percent.

Ultra US Treasury Bonds StatisticsSPECULATORSCOMMERCIALSSMALL TRADERS
– Percent of Open Interest Longs:5.183.210.7
– Percent of Open Interest Shorts:31.659.48.1
– Net Position:-365,913330,14335,770
– Gross Longs:71,3061,152,370147,949
– Gross Shorts:437,219822,227112,179
– Long to Short Ratio:0.2 to 11.4 to 11.3 to 1
NET POSITION TREND:
– Strength Index Score (3 Year Range Pct):35.976.554.0
– Strength Index Reading (3 Year Range):BearishBullishBullish
NET POSITION MOVEMENT INDEX:
– 6-Week Change in Strength Index:-1.90.03.3


Article By InvestMacroReceive our weekly COT Newsletter

*COT Report: The COT data, released weekly to the public each Friday, is updated through the most recent Tuesday (data is 3 days old) and shows a quick view of how large speculators or non-commercials (for-profit traders) were positioned in the futures markets.

The CFTC categorizes trader positions according to commercial hedgers (traders who use futures contracts for hedging as part of the business), non-commercials (large traders who speculate to realize trading profits) and nonreportable traders (usually small traders/speculators) as well as their open interest (contracts open in the market at time of reporting). See CFTC criteria here.