By JustMarkets
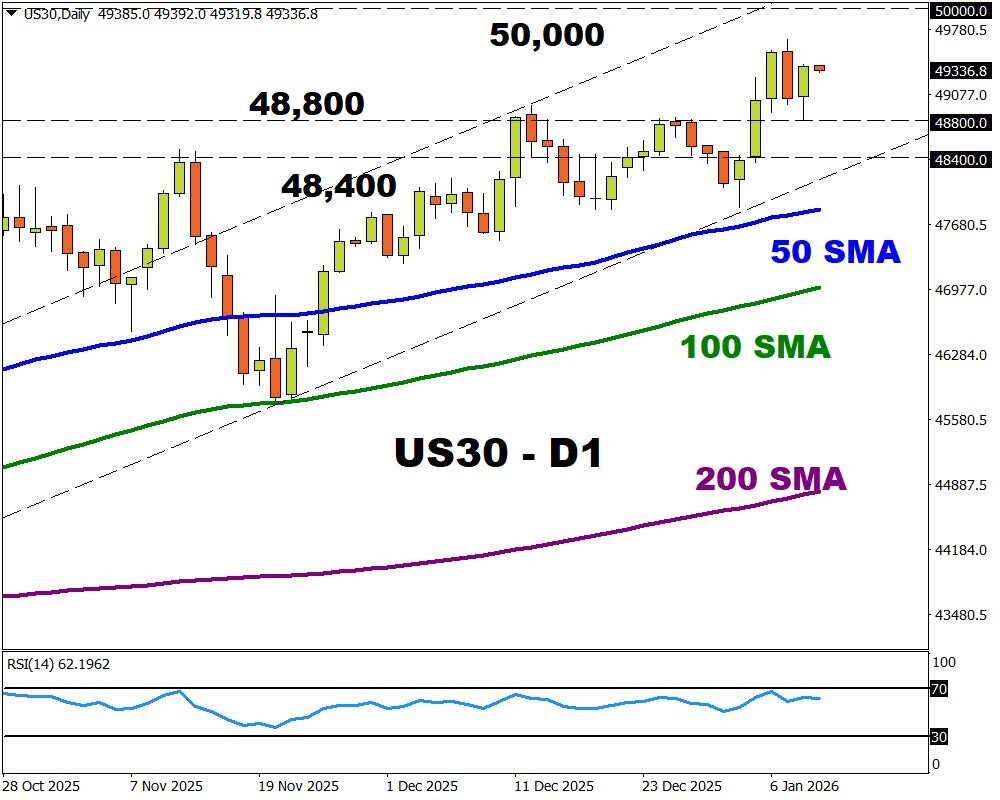
The US stock market ended Friday at historic highs as investors reacted to December labor market data and anticipated signals from the Fed. By Friday’s close, the Dow Jones Index (US30) rose by 0.48% (+2.12% for the week). The S&P 500 (US500) gained 0.65% (+1.07% for the week). The technology-heavy Nasdaq (US100) closed higher by 1.02% (+1.16% for the week). Major indices posted steady gains as employment statistics pointed to a slowdown in job creation, while the unemployment rate simultaneously fell to 4.4%, which was perceived as a sign of a resilient but not overheated labor market. Technology companies, primarily semiconductor manufacturers, made the largest contribution to the rally, boosted by optimism surrounding the development of artificial intelligence.
The Canadian dollar (CAD) weakened to the 1.39 level against the US dollar, hitting a one-month low amid a deteriorating labor market, which lowered expectations for further policy tightening by the Bank of Canada. December statistics showed a sharp rise in unemployment to 6.8%, driven by an increase in labor force participation, while moderate employment growth and slowing wage growth indicated a cooling of domestic inflationary pressure and confirmed the sufficient restrictiveness of current rates. Additional pressure on the currency came from the commodities market. Combined, these factors narrowed interest rate differential expectations and strengthened the currency’s downward trend.
The Mexican peso (MXN) traded near the 18 per dollar level, remaining under pressure from a strong US dollar that offset domestic support factors. The published Banxico minutes confirmed a balanced and cautious approach to monetary policy: following the expected rate cut to 7.0%, the regulator emphasized its reliance on incoming data and a lack of intention to accelerate the easing cycle, which served to stabilize market expectations.
European equity markets mostly rose on Friday. The German DAX (DE40) climbed 0.53% (+2.35% for the week), the French CAC 40 (FR40) closed up 1.44% (+1.39% for the week), the Spanish IBEX 35 (ES35) edged down 0.03% (+0.46% for the week), and the British FTSE 100 (UK100) finished up 0.80% (+1.74% for the week).
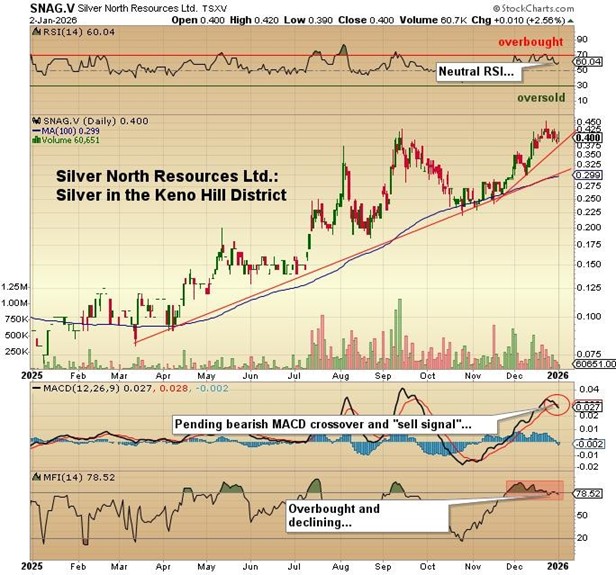
On Friday, silver (XAG) surged nearly 4% to $80 per ounce, as the slowdown in US job growth bolstered expectations for Fed rate cuts, triggering renewed demand for precious metals after the easing of pressure from indices. This shift reduced pressure on real yields and stimulated the opening of new long positions and the closing of short positions in silver futures.
Platinum prices (XPT) jumped by more than 3%, approaching the $2370 per ounce mark, amid a general rise in precious metal prices and investors’ desire to return to recent record levels. The market was supported by increased demand for safe-haven assets due to intensifying geopolitical tensions. Platinum continued its move toward the December high, maintaining support from both defensive demand and an increased willingness among investors to use precious metals as a risk hedge.
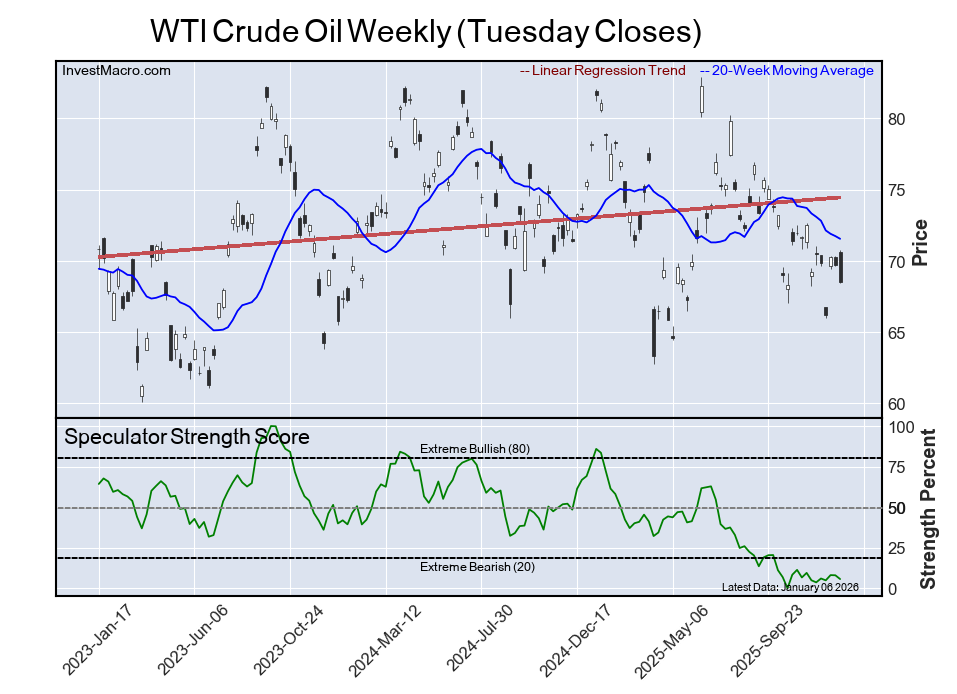
WTI crude oil rose 2.3% on Friday, continuing its recovery from recent declines and ending the week with a 1.5% gain. Prices were supported by escalating geopolitical tensions, primarily due to intensifying protests in Iran, accompanied by reports of casualties and internet shutdowns, raising concerns over potential supply disruptions from a key producer. An additional factor was the ongoing uncertainty surrounding Venezuelan oil exports following tightened US oversight. The geopolitical premium in prices increased, which was also reflected in heightened demand for bullish options, although rising global inventories and threats of oversupply continued to limit further upside potential.
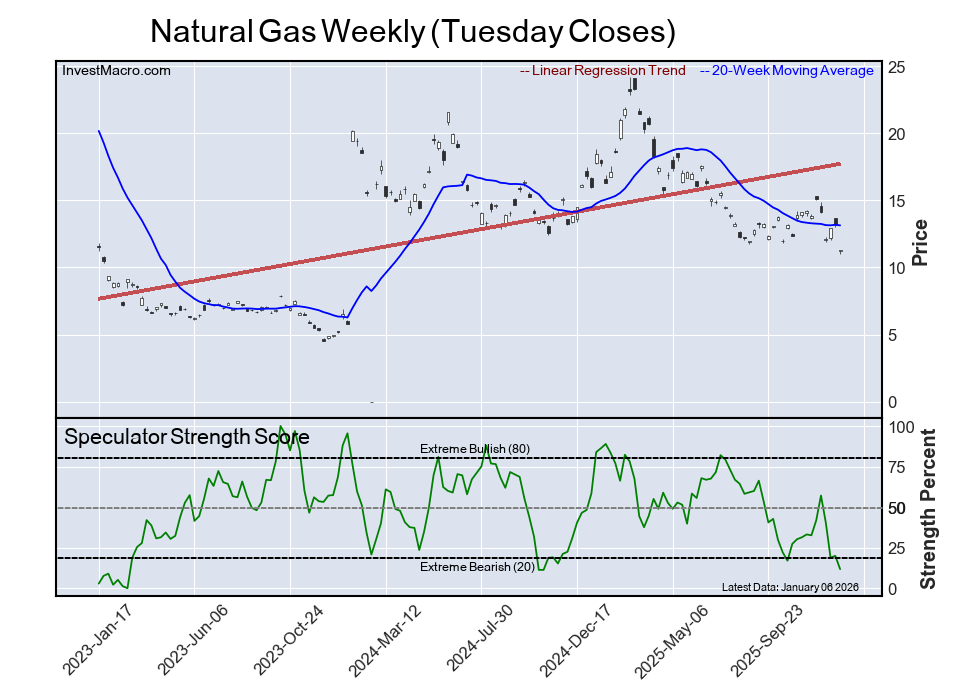
US natural gas (XNG) prices fell sharply by over 5%, dropping below $3.25 per MMBtu, the lowest level since mid-October. The primary downward pressure came from updated weather prognoses indicating a warmer-than-usual winter across much of the country, weakening heating demand expectations for the coming weeks. The weather factor outweighed positive signals from the market balance. LNG exports remain at record levels, and gas deliveries to export terminals in January stayed near historic highs despite a moderate decline in production following the December peak.
Asian markets traded with mixed results last week. The Japanese Nikkei 225 (JP225) rose by 1.82%, the Chinese FTSE China A50 (CHA50) gained 0.58%, Hong Kong’s Hang Seng (HK50) fell by 0.49%, and the Australian ASX 200 (AU200) showed a negative 5-day result of 0.09%.
The offshore yuan strengthened to 6.97 per dollar, hitting a nearly three-year high amid growing confidence in the currency and a notable decrease in hedging costs. Forward contracts allow for locking in rates below the current spot, reflecting the lowest implicit costs since 2022 and stimulating demand for currency risk management instruments. The yuan’s appreciation, exceeding 5% over the past year, is fueled by a combination of external and internal factors, including a weakening dollar, China’s sustained trade surplus, an improving macroeconomic backdrop, and capital inflows ahead of the Lunar New Year. Stronger daily fixings by the People’s Bank of China (PBoC) have also reinforced market expectations that the regulator is not hindering further appreciation of the national currency.
S&P 500 (US500) 6,966.28 +44.82 (+0.65%)
Dow Jones (US30) 49,504.07 +237.96 (+0.48%)
DAX (DE40) 25,261.64 +134.18 (+0.53%)
FTSE 100 (UK100) 10,124.60 +79.91 (+0.80%)
USD Index 99.14 +0.20% (+0.21%)
By JustMarkets
This article reflects a personal opinion and should not be interpreted as an investment advice, and/or offer, and/or a persistent request for carrying out financial transactions, and/or a guarantee, and/or a forecast of future events.